Fostering in England 1 April 2021 to 31 March 2022
Updated 29 November 2023
Applies to England

© Crown copyright 2023
This publication is licensed under the terms of the Open Government Licence v3.0 except where otherwise stated. To view this licence, visit nationalarchives.gov.uk/doc/open-government-licence/version/3 or write to the Information Policy Team, The National Archives, Kew, London TW9 4DU, or email: psi@nationalarchives.gov.uk.
Where we have identified any third party copyright information you will need to obtain permission from the copyright holders concerned.
This publication is available at https://www.gov.uk/government/statistics/fostering-in-england-1-april-2021-to-31-march-2022/fostering-in-england-1-april-2021-to-31-march-2022
The Fostering in England 1 April 2021 to 31 March 2022 release also includes:
- data tables
- methodology
- pre-release access list
Summary
This release covers:
- the numbers of foster carers and foster places and placements, in both local authority (LA) and independent fostering agencies (IFA)
- data relating to types of foster care, registrations, deregistrations and a range of other subjects
- the period between 1 April 2021 and 31 March 2022
Main findings
Since 2018, mainstream fostering capacity has decreased slightly.
As at 31 March 2022, of the 43,905 fostering households in England, 36,050 were mainstream fostering households. Since 2018, the number of approved mainstream fostering households has decreased by 4% and the number of approved mainstream fostering places has decreased by 5%. During the same period, the number of filled mainstream fostering places has remained fairly static and the number of vacant mainstream fostering places has decreased by 23%.
There is an upward trend in fostering provision provided by family and friends households.
About 1 out of every 6 fostering households in England offers family and friends provision, providing care for about 1 in 5 fostered children. As at 31 March 2022, there were 43,905 fostering households in England. Of these, 7,855 were family and friends households, providing care for around 11,210 children. The number of approved family and friends households has increased by 29% since 2018 (6,100). The proportion of total approved fostering households that are family and friends households has increased from 14% in 2018 to 18% in 2022.
There has been a downward trend in the number of applications for mainstream fostering over the last 5 years. In both sectors a relatively large number of enquiries are not translating into applications.
The number of mainstream fostering applications has fallen from 10,520 in 2018 to 8,280 in 2022. This year, IFAs reported a ratio of 23 initial enquiries per application and LAs reported a ratio of 8 initial enquiries per application. Both sectors’ ratios suggest that a relatively large volume of enquiries are not translating into applications. This discrepancy is much higher in the IFA sector, where it has increased substantially.
There is increasing use of IFAs for mainstream foster care provision.
The proportion of children in mainstream foster care looked after by IFAs has increased by 5 percentage points since 2018. In 2018, IFAs accounted for 40% of all filled fostering places and in 2022 this had risen to 45%.
LA households tend to stay registered for longer than IFA households.
LA services reported that 31% of mainstream fostering deregistrations were within 2 years of approval compared with 34% of IFA deregistrations. Of mainstream fostering deregistrations within the LA sector, 28% had been with their services for 10 or more years compared with 15% of IFA deregistrations.
Introduction
This statistical release covers LA fostering agencies and IFA in England in the year 1 April 2021 to 31 March 2022. It includes data about fostering households, foster carers, retention, recruitment and capacity of providers. Throughout this release, we have included data on historical trends as far back as 2017 to 2018, where available.
Compared with previous years, 2021 was an unusual year, with high figures in several areas including enquiries, applications and approvals. Given the context of the COVID-19 pandemic, it is perhaps unsurprising that 2021 seems to have been an outlier. For this reason, what follows will look back to 2018 to get a sense of longer-term trends throughout the sector, rather than using year-to-year comparisons with 2021.
We collected data from 428 agencies (146 LAs and 282 IFAs). This was 97% of all 442 eligible agencies and is likely to account for about 99% of all foster carers.
At the end of March 2022, there were 43,905 fostering households in total in England. Of these, 36,050 offered mainstream fostering provision and 7,855 were family and friends households.
This report is notably different to its predecessors. Mainstream and family and friends fostering are both important types of foster care provision. These national statistics differ in that they cover these 2 groups as separate and different stories. Family and friends provision is approved solely by LAs, and for specific children. The foster carers in this category sometimes go on to become mainstream carers, but not frequently. Their routes into foster care, and their routes from foster care, are different to those of mainstream carers. They are not a resource to support those in care that can be replenished through, for example, more recruitment drives. By writing about them separately, we aim to analyse mainstream fostering from the LA and IFA sectors more clearly.
Consequently, the main body of this report focuses on mainstream foster care only. It does not include data on family and friends provision; the latter is covered in a separate section towards the end of the report. It is different to the methodology of previous fostering statistics and this may affect the interpretation and understanding of historical data.
By writing about the data in this way, we are hoping to help give a more accurate picture of the state of foster care in England.
Mainstream fostering households
We collected data on 36,050 mainstream fostering households from 428 agencies (LA and IFA). The number of mainstream fostering households is slightly below the level in 2018, although this only represents a 4% decrease over this time.
The sector split of fostering households as at March 2022 has changed slightly over the past 5 years, with LAs accounting for a steadily decreasing proportion of all approved households – from 61% in 2018 to 58% in 2022. This year, LAs accounted for nearly 3 in 5 approved fostering households (20,845), while IFAs represented just over 2 in 5 (15,205).
Of the 36,050 households, 4,035 were newly approved during 2021 to 2022 and still active at 31 March 2022. This is an 18% decrease in the number of newly approved households from 2018 to 2022. LAs and IFAs accounted for similar amounts of newly approved households with 51% and 48%, respectively.
Figure 1: Proportion of all approved and newly approved households by sector, as at 31 March 2022

Percentages are rounded and may not sum to 100.
View data in an accessible table format.
As at 31 March 2022, most fostering households had 2 carers, with LAs at 69% and IFAs at 71% of their respective total of approved households. These levels have not varied a great deal since 2018.
Mainstream households by primary placement type
As at March 2022, the most common placement types were non-permanent (49%) and permanent (40%). The remaining 11% of households offered other placement types including emergency, parent and child, multi-dimensional treatment, remand, fostering to adopt and short-break places. ‘Not permanent’ care refers to care that is not currently planned to last until the child ceases to be looked after or until the child reaches the age of 18.
Figure 2: Breakdown of the most common primary placement types of fostering households as at 31 March 2022

This chart is not to scale.
View data in an accessible table format.
Newly approved mainstream households
In total, there were 4,035 newly approved fostering households during 2021 to 2022 that were still active on 31 March 2022.
The number of newly approved households whose primary placement type is non-permanent foster care was similar for LAs and IFAs, though in both cases the number has decreased from 2017 to 2018 (by 12% and 20%, respectively). Approved households have decreased for permanent households, which has had an impact the overall newly approved household number.
Table 1: Primary placement type of foster care offered by newly approved households during 2021 to 2022, by sector
| Primary placement type | Number of new households (England) | Number of new households (LA) | Number of new households (IFA) | Percentage of new households (LA) | Percentage of new households (IFA) |
|---|---|---|---|---|---|
| Non-permanent foster care | 2,340 | 1,270 | 1,070 | 61% | 55% |
| Permanent foster care | 910 | 240 | 670 | 12% | 34% |
| All other types of foster care | 775 | 560 | 215 | 27% | 11% |
| Total | 4,035 | 2,075 | 1,955 | 100% | 100% |
Figures are rounded so subtotals may not sum to totals.
Mainstream households offering a range of foster care types
As at 31 March 2022, 62% of fostering households offered multiple types of foster care, in line with previous years. Of all fostering households in England, 37% were approved for 2 types of care, 15% for 3 types of care and 10% for 4 or more types of care. These numbers do not differ substantially from the previous years’ data.
Around 43% of LA and 87% of IFA households were approved for multiple types of care, in line with previous years.
Mainstream fostering household sizes
As at 31 March 2022, the majority of fostering households were approved to care for 2 or more children (71%). Compared with LAs, IFAs tend to approve a higher proportion of households to care for 3 or more children and a lower proportion to care for just 1 child.
Of IFA households, 43% were approved to care for 3 or more children, compared with 26% of LA households. The proportion of LA households approved for 3 or more children has dropped slightly from 28% in 2018 to 26% in 2022. In the IFA sector, the proportion has also decreased slightly, from 45% to 43% over the same period.
Of IFA households, 21% were only approved to look after one child compared with 34% of LA households. Over the last 5 years, the proportion of households approved to care for just 1 child has increased slightly from 33% to 34% in the LA sector and from 19% to 21% in the IFA sector.
Within both LA and IFA sectors, newly approved households were more likely to be approved to look after smaller numbers of children. Of newly approved households, 46% were for approved for 1 child, compared with 28% of all approved households.
Figure 3: Proportion of all approved and newly approved households by household size, as at 31 March 2022

Percentages are rounded and may not sum to 100.
View data in an accessible table format.
Retention
In 2021 to 2022, more mainstream fostering households deregistered (5,435) than were approved (4,035), leading to a net decrease in fostering capacity since last year.
During 2021 to 2022, 290 households were both approved and deregistered.
The split between the 2 sectors of all deregistrations was relatively even, with 54% (2,925) of deregistrations occurring in LAs and 46% (2,510) in IFAs.
IFAs have seen an increase in capacity of 440 households (3%) from 2018 to 2022. The LA sector has seen a decrease in capacity of 1,770 households (8%) during the same period.
Figure 4: Number of fostering households that deregistered compared to number that were newly approved in 2021 to 2022, by sector

Figures are rounded and may not sum to the overall totals in the text.
View data in an accessible table format.
Deregistrations and length of time being a foster carer
Of fostering households that held an approved status at some point during 2021 to 2022, 13% had deregistered by the end of the year (5,435 of 41,485).
LA households tended to stay registered for longer than IFA households. LA services reported that 31% of deregistrations were within 2 years of approval, while 28% had been with their services for 10 or more years. In contrast, a higher proportion of deregistrations were within 2 years among IFAs (34%), and a lower proportion had been registered for 10 or more years (15%).
Recruitment
Enquiries to applications
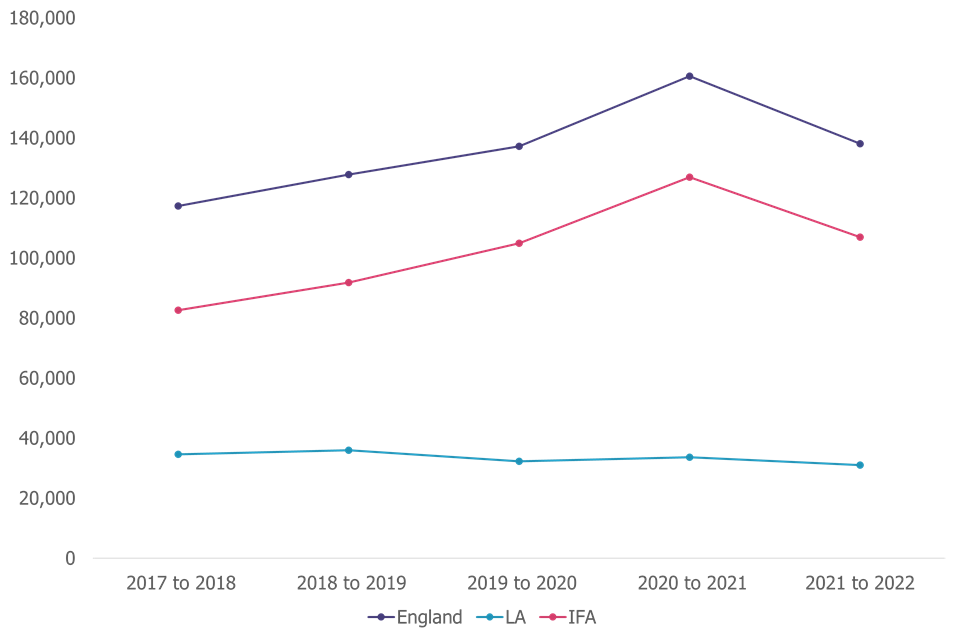
There were 138,075 initial enquiries from prospective mainstream fostering households in the year ending 31 March 2022. The number of initial enquiries is 18% higher than in 2017 to 2018, and has been slowly rising over that period. The number of enquiries received by IFAs has similarly risen since 2017 to 2018, by 29%. The number of enquiries to LAs has declined in the same period, by 10% (to 31,045), but has gone up and down over the years, rather than steadily declining.
This year, the IFA (107,030) and LA (31,045) sectors made up 78% and 22%, respectively of initial enquiries. Over the past few years there has been an upward trend in the proportion of total enquiries received by the IFA sector: from 70% in 2017 to 2018 to a peak of 79% in 2020 to 2021.
This year, only 6% of those who made initial enquiries about becoming a foster carer went on to apply. Since 2017 to 2018, when 9% of those who enquired went on to apply, there has been a downward trend in the proportion of applications to enquiries. This means that, over the last 5 years, an increasing number of people have been making initial enquiries about becoming a foster carer but a decreasing proportion of them have gone on to make an application.
The conversion rate remains different for the LA and IFA sectors. Actual applications were equivalent to 4% of initial enquiries for IFAs and 12% for LAs. The total number of initial enquiries was much higher in the IFA sector (107,030) than the LA sector (31,045), but this translated to a total number of applications for IFAs (4,615) that was just 950 more than the LA sector (3,665).
This year, IFAs reported a ratio of 23 initial enquiries per application and LAs reported a ratio of 8 initial enquiries per application. In the LA sector, the ratio of enquiries to applications has remained fairly steady since 2017 to 2018, with between 6 and 9 enquiries for each application throughout this period. For IFAs, the ratio of enquiries to applications has increased steadily since 2017 to 2018, when it was 14 to one. Both sectors’ ratios suggest a relatively large volume of enquiries are not translating into applications, but this discrepancy is much higher – and increasing – in the IFA sector.
Figure 5: Initial enquiries since 1 April 2017, by sector
Estimates have been used for the number of enquiries in 2019 to 2020.
View data in an accessible table format.
Applications to approvals
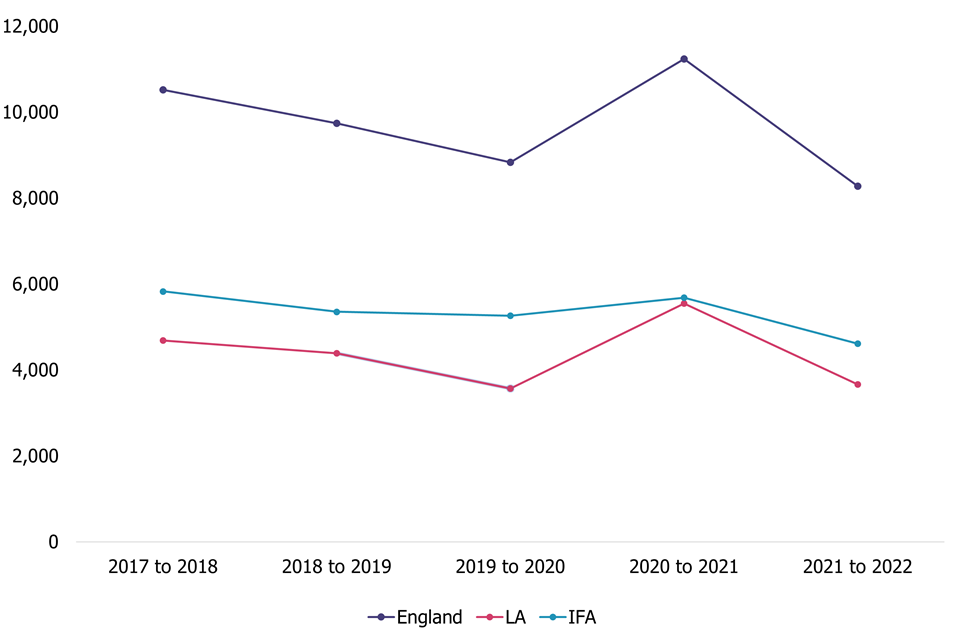
This year, 8,280 applications to become a foster carer were received. This is the lowest number of applications in several years, 21% lower than 2017 to 2018. If 2020 to 2021 is excluded as a potential outlier, which seems feasible given the pandemic, there has been a steady decrease over the last 5 years from the 2017 to 2018 total of 10,520.
For both sectors, applications are at their lowest level in several years. LA applications have decreased by 22% since 2018, and IFA applications have dropped by 21% over the same period. In both sectors, 2021 seems to have been an unusual year, with high numbers of enquiries and applications.
Figure 6: Applications since 1 April 2017, by sector
View data in an accessible table format.
Of the 8,280 applications received, 5,670 (68%) were completed in-year. The overall proportion of completed applications is the same as last year (69%) and is up from 66% in 2017 to 2018.
The outcomes of those 5,670 completed applications were: 28% approved (1,575), 71% withdrawn (4,025) and 1% rejected (70). Of the 4,025 withdrawn applications, 71% (2,875) were withdrawn by the applicant and 29% (1,150) were withdrawn by the service. The percentage of applications withdrawn by the service (29%) was much lower than in 2017 to 2018 (49%).
Figure 7: Applications received in 2021 to 2022, by status on 31 March 2022

This chart is not to scale.
View data in an accessible table format.
The proportion of applications completed in-year has stayed consistent over the last 5 years, at about two thirds, while the proportion of completed applications that were approved has dropped slightly this year (28% in 2021 to 2022, compared with 35 to 39% in each of the preceding 4 years).
Both sectors have seen a decrease in the proportion of approved applications over the years. This year, the most substantial drop has been in the IFA sector, where only 27% of processed applications led to approvals. This is down from 35% in 2017 to 2018. The proportion of approved applications in the LA sector was 29% this year, down from 36% in 2017 to 2018. The proportion of fostering households that were approved in-year is at its lowest level in several years. Households approved in-year make up 11% of fostering households now compared with 13 to 14% in each of the preceding 4 years.
Figure 8: Completed applications and approvals since 1 April 2017, by sector

View data in an accessible table format.
Across both sectors, a fairly high proportion of applications were withdrawn this year (71%). This contrasts with levels of 60 to 64% in the preceding 4 years. The large proportional decrease in approved applications this year in the IFA sector is accounted for by this increase in the number of withdrawals, particularly those withdrawn by the applicant. Last year saw a higher-than-usual number of withdrawals by the service in the LA sector, while this year sees a return to withdrawal levels that are more in-line with pre-pandemic numbers. LA withdrawals for 2021 to 2022 were 60% by applicant (970) and 40% by service (660), which is similar to the 2017 to 2018 figures of 61% by applicant (995) and 39% by service (625).
Figure 9: Number of withdrawn applications by service and applicant since 1 April 2017, by sector

View data in an accessible table format.
This year, the breakdown of withdrawals for IFAs was 80% by applicant (1,905) and 20% by service (490). There has been an upward trend in the proportion of applicant withdrawals in the IFA sector over the last 5 years, from 45% in the 2017 to 2018 year to 80% this year.
Training and development
As at 31 March 2022, 82% of the 61,360 approved mainstream foster carers (50,075) had completed their training, standards and development. Both sectors have similar levels of completed training (LAs 81% and IFAs 83%).
Of those carers who had not completed their training, 53% (5,990) were in progress, 34% (3,810) had not yet started and 6% (645) were awaiting sign-off. Both sectors have similar levels of training in progress, awaiting sign-off and not yet started. The remaining 7% (840) had a status of ‘Not known’ recorded, almost all accounted for by the LA sector (755).
Foster carers
Approved foster carers
As at 31 March 2022, the number of approved foster carers was 61,360. This represents a slight decrease compared with last year. However, if the last 2 years are excluded as potential anomalies due to the COVID-19 pandemic, it represents an overall decrease in the number of foster carers over the years, with a 4% decrease from 2017 to 2018 (63,815 carers).
As in previous years, LA agencies continue to account for about 6 in 10 of all carers (58%). In the LA sector, the number of carers has decreased by 8% since 2017 to 2018; in the IFA sector, it has increased slightly, by 2%, in the same period.
Of 61,360 approved foster carers as at 31 March 2022, 6,680 (11%) were approved between 1 April 2021 and 31 March 2022. LA agencies once again accounted for around half (51%) of these new approvals, which is slightly lower than the proportion of all LA-approved foster carers (58%).
Figure 10: Number of approved foster carers in England as at 31 March 2022, compared to the number newly approved within the year, by sector

View data in an accessible table format.
Ethnicity
On 31 March 2022, in line with previous years, 81% of foster carers were White. This is lower than the proportion of White people in the adult (aged 20 and older) population (87%).
As in previous years, a greater proportion of foster carers were from ethnic minority backgrounds in IFAs (23%) than in the LA sector (13%). As at 31 March 2021 (the most recent available children’s data on ethnicity), children of ethnic minority backgrounds make up 28% of children under the care of IFAs and 21% of children under the care of LAs.
Of all newly approved foster carers during 2021 to 2022, 77% were White and 20% were from ethnic minority backgrounds. The remaining 3% were reported with their ethnicity marked as ‘Not known’, in line with previous years.
Figure 11: Ethnicity of all approved and newly approved foster carers by sector, as at 31 March 2022

Due to rounding, totals may not add up.
View data in an accessible table format.
Age
This was the third year that we collected age data for foster carers and the picture has remained largely similar to the last 2 years. Note that the discussion in this section relates to individual carers and not fostering households.
As at 31 March 2022, the largest group of all approved foster carers were in their 50s (41%). For foster carers newly approved in-year, we see a higher percentage of carers in the younger age brackets. Foster carers in their 20s and 30s accounted for a quarter (26%) of all newly approved foster carers, but only 10% of foster carers overall.
More than 3 in every 5 carers who deregistered in 2021 to 2022 were over the age of 50 (65%). Carers in their 50s made up the highest proportion of deregistrations (35%) and those in their 20s made up the lowest (2%). However, when considering deregistrations as a percentage of carers who held an approved status at some point during 2021 to 2022 by age, those in their 50s had the lowest proportion of deregistrations (22%) and those in the 20 to 24 age bracket had a similar percentage of deregistrations to those aged 65 and over (16%). Nearly 1 in 5 deregistrations in the 25 to 29 age bracket were due to the carers adopting or taking a special guardianship order for the child or children (18%), while only 1% of those in the 50 or over age bracket who deregistered did so for these reasons.
Figure 12: Age of foster carers by status and sector, as at 31 March 2022

Percentages are rounded and may not sum to 100.
View data in an accessible table format.
Fostering capacity
A breakdown of newly approved households by sector can be found in the newly approved households section.
Approved places
There were 74,660 fostering places in England as at 31 March 2022. This is a decrease of 5% since 2018 (78,300).
As at 31 March 2022, LA-approved places had decreased by 9% since 31 March 2018, while IFA-approved places have increased by 2%. The majority of fostering places are still approved by LA fostering services. LAs reported 54% of all approved places, with 46% in IFAs, which represents a gradual increase in the proportion of places offered by IFAs over the last 5 years.
There were 1,455 household places used exclusively for short breaks, which is equivalent to 2% of all approved places. This represents a drop from a high of 2,120 places in 2018 to 2019. The proportion of approved places used for short-break care has remained consistent at 2 to 3% over the last 5 years.
Age of children looked after
This year, we collected data for the first time on the minimum and maximum age of children who could be looked after.
For just over 1 in 10 households, this data was not submitted. Of those households that we have age data for, the majority were approved to look after children from under the age of 1 (75%), while some households were approved to look after children from the age of 5 (15%). Most households were approved to look after children until they turn 18 (87%).
Occupancy
Of the 74,660 approved mainstream fostering places for which we have data, 60% were filled (44,550), 18% were vacant (13,170), 21% were unavailable (15,940) and 2% were used for short-break placements (1,455).
The exclusion of family and friends carers from the main data analysis this year has had a substantial effect on occupancy rates. This is because family and friends places are almost always occupied, as they are specifically approved for a particular situation. Since they are only provided through LAs, their exclusion from the main data means that the comparative breakdown of occupancy is different. This alteration in methodology is why the breakdown and discussion of previous years differs in this year’s report compared with previous years. The overall data is the same but it is segmented and analysed differently.
IFAs and LAs have a similar level of occupancy, with about 3 in 5 places occupied across both sectors. This level has been consistent over the last 5 years in the LA sector, while in the IFA sector it has risen slightly from 53% in 2017 to 2018 to 59% this year. Over the last 5 years, the number of filled fostering places has not changed, but the number of vacant places has decreased by 23% (from 17,150 to 13,170). There are around the same number of children living with foster carers now as there were 5 years ago, but there are fewer vacant places. Throughout this period, the proportion of places that were not available has stayed steady at around 20% (this year, it is 21%).
Figure 13: Proportion of fostering places as at 31 March each year from 2018 to 2022, by occupancy status and sector

Estimates have been used for the number of places as at 31 March 2020.
View data in an accessible table format.
Unavailable fostering places
Unavailable places have tended to represent around 1 in 5 total places over the last 5 years, and currently account for 21% of total places (15,940). The proportion of unavailable places is similar in IFAs (22%) and LAs (20%). When family and friends carers data is excluded, it is evident that the difference between the sectors is not substantial, with a 2 percentage point difference this year. This is despite the proportion of unavailable places being slightly higher in IFAs in the past.
There can be a number of reasons why a place is ‘not available’ for fostering. Compared to LAs, IFAs tended to have higher proportions of unavailable places due to the needs of the child currently in placement (19% compared to 12%) and of places only available if a sibling group is placed (22% compared to 12%). LAs (20%) tended to have more places unavailable due to the carer taking a break or pending resignation than IFAs (15%). About 1 in 10 unavailable places have that status due to the young person staying put. IFAs (8%) have a slightly lower proportion of unavailable places for this reason than LAs (11%), which has been the case for most of the past 5 years.
Across both sectors, the most common reason given for places being unavailable was ‘carer reasons (not otherwise stated)’ (26% for each sector). For a full breakdown of the reasons for unavailable places, please see the accompanying underlying data file for this release.
Safeguarding
Restraint
During 2021 to 2022, there were 730 reported incidents of physical restraint, 71% of which were reported in the IFA sector. Some of the differences between sectors may be affected by variations in reporting processes between IFAs and LAs and by differences in the types of provision they offer.
Allegations of abuse
During 2021 to 2022, there were 3,010 allegations of abuse made against foster carers.
Almost two thirds of allegations of abuse in 2021 to 2022 (1,965 or 65%) were made by fostered children against their foster carers, which is a similar proportion to previous years. The remaining allegations came from other sources. In the same way as previous years, the split between allegations made in both sectors broadly reflects the proportion of children placed in each sector.
Physical abuse has continued to account for the largest number of allegations. In 2021 to 2022, 51% of all allegations were related to physical abuse; this percentage has dropped very slightly over the years since 2017 to 2018. Over the same period the proportion of emotional abuse allegations has risen slightly from 19% to 24% this year. Allegations of sexual abuse continue to be the least common, accounting for 8%. This proportion has remained practically unchanged since at least 2017 to 2018.
Half (52%) of all allegations resulted in an outcome of no further action. This outcome has seen a slight decrease from an average of 57% in the years between 2017 to 2018 and 2019 to 2020. Broadly in line with previous years, 18% of allegations resulted in continued monitoring of foster carers. The proportion of allegations referred on to the fostering panel for review has seen a slight increase over the last few years, from 26% in 2017 to 2018 to 30% in 2021 to 2022.
Figure 14: Outcomes of investigations into allegations of abuse in 2021 to 2022 split by sector

Percentages are rounded and may not sum to 100.
View data in an accessible table format.
Nearly half of all investigations into allegations were resolved in 21 days or less (47%). Just under a quarter of allegations (24%) took more than 50 working days to conclude. On average, investigations into allegations took slightly longer to resolve in the LA sector than in the IFA sector.
Figure 15: Length of time taken to resolve allegations of abuse in 2021 to 2022, by sector

Percentages are rounded and may not sum to 100.
View data in an accessible table format.
Family and friends households
As mentioned, above, the previous sections of this report focus on mainstream foster care only. This section discusses only family and friends foster care. Family and friends care is only offered by households within the LA sector. It involves a separate approval process to other types of foster care. These households usually receive approval to care for a specific child or children. Almost all of the households with a primary designation of family and friends that were active at the end of March 2022 were not approved to offer other types of care (99%).
Family and friends households made up 18% of all active fostering households as at 31 March 2022 (7,855 of 43,905), which is slightly higher than 2017 to 2018 (14%). Just over a quarter of LA households had family and friends care as their primary placement offer (27%). This is higher than 2017 to 2018 when family and friends households made up 21% of active LA households (6,100 of 28,715). The upward trend in the proportion of LA foster care made up by family and friends households is illustrated in Figure 16.
Family and friends households accounted for 60% of LA households approved in-year that were still active on 31 March 2022, up slightly from 56% in 2017 to 2018. This type of household made up 60% of deregistrations in the LA sector in the 2021 to 2022 period, which is similar to the year before (62%). At the end of March 2022, family and friends households had 12,285 foster carers, which is equivalent to 17% of all approved foster carers, and looked after 11,210 children, which is equivalent to 20% of all fostered children.
Local authorities reported that 4,850 family and friends households were approved in 2021 to 2022, including those that deregistered in-year. This was a small increase of 7% from 2017 to 2018 (4,540 family and friends households approved). Of these newly approved family and friends households, 3,145 (65%) were still active at 31 March 2022. The other 1,705 households were both approved and deregistered in the year. In total, 4,470 family and friends households deregistered during 2021 to 2022. Two fifths (41%) of the family and friends households that deregistered within the 2021 to 2022 period did so within 6 months of registering; this is the same proportion as last year. This is common for these types of households, which are often only temporarily approved to provide foster care for a specific child for a short period of time. Of the total deregistrations of carers in their 20s, 79% were family and friends carers in the LA sector, which is in line with last year’s figures (80%).
Of approved family and friends carers as at 31 March 2022, 85% were White and 10% were from minority ethnic groups. Around 5% of family and friends carers (615) did not have their ethnicity recorded. This group makes up nearly half of all foster carers of unknown ethnicity (47%), although family and friends carers only represent less than 1 in 5 of all foster carers.
The use of family and friends households is in line with the expectation that LAs will place children with family and friends wherever possible. The increase in their number has played a significant part in meeting the demands set by the rising number of children in care and a reducing pool of available mainstream foster placements.
Figure 16: Proportion of LA households approved for family and friends care as at 31 March each year from 2018 to 2022

View data in an accessible table format.
Revisions to previous release
This is the first release of this data for the period 1 April 2021 to 31 March 2022.
The Fostering in England 1 April 2021 to 31 March 2022 page also includes:
- data tables
- methodology
- pre-release access list
Contacts
If you are a member of the public and have any comments or feedback on this publication, please contact Adam King socialcaredata@ofsted.gov.uk.
Acknowledgements
Thanks to the following for their contribution to this statistical release: Noopur Naik and Hannah Tempest.
Glossary
Definitions of terms are within the statistical glossary.
Annex: data tables for figures
This section contains the underlying data in an accessible table format for all figures.
Data for Figure 1: Proportion of all approved and newly approved households by sector, as at 31 March 2022
| Group | Total number | LA | IFA |
|---|---|---|---|
| All approved households as at 31 March 2022 | 36,050 | 58% | 42% |
| Newly approved households during 2021 to 2022 | 4,035 | 51% | 48% |
See Figure 1
Data for Figure 2: Breakdown of the most common primary placement types of fostering households as at 31 March 2022
| Group | Number | Percentage |
|---|---|---|
| Approved households as at 31 March 2022 | 36,050 | 100% |
| Households offering 2 primary placement types | 32,085 | 89% |
| Households offering other primary placement types | 3,970 | 11% |
| Households offering non-permanent placements | 17,600 | 55% |
| Households offering permanent placements | 14,485 | 45% |
See Figure 2
Data for Figure 3: Proportion of all households and newly approved households by household size, as at 31 March 2022
| Group | Approved for 1 child | Approved for 2 children | Approved for 3 or more children |
|---|---|---|---|
| All approved households | 28% | 38% | 33% |
| All LA households | 34% | 39% | 26% |
| All IFA households | 21% | 37% | 43% |
| All newly approved households | 46% | 35% | 18% |
| Newly approved LA households | 56% | 33% | 11% |
| Newly approved IFA households | 36% | 38% | 26% |
See Figure 3
Data for Figure 4: Number of fostering households that deregistered compared to number that were newly approved in 2021 to 2022, by sector
| Sector | Newly approved households | Deregistered households |
|---|---|---|
| LA | 2,075 | 2,925 |
| IFA | 1,955 | 2,510 |
See Figure 4
Data for Figure 5: Initial enquiries since 1 April 2017
| Sector | 2017 to 2018 | 2018 to 2019 | 2019 to 2020 | 2020 to 2021 | 2021 to 2022 |
|---|---|---|---|---|---|
| England | 117,335 | 127,850 | 137,265 | 160,635 | 138,075 |
| LA | 34,650 | 35,960 | 32,280 | 33,645 | 31,045 |
| IFA | 82,685 | 91,890 | 104,995 | 126,985 | 107,030 |
See Figure 5
Data for Figure 6: Applications since 1 April 2017, by sector
| Sector | 2017 to 2018 | 2018 to 2019 | 2019 to 2020 | 2020 to 2021 | 2021 to 2022 |
|---|---|---|---|---|---|
| England | 10,520 | 9,740 | 8,835 | 11,235 | 8,280 |
| LA | 4,690 | 4,390 | 3,570 | 5,550 | 3,665 |
| IFA | 5,830 | 5,355 | 5,265 | 5,685 | 4,615 |
See Figure 6
Data for Figure 7: Applications received in 2021 to 2022, by status on 31 March 2022
| Group | Number | Percentage |
|---|---|---|
| Applications received in 2021 to 2022 | 8,280 | 100% |
| Applications completed | 5,670 | 68% |
| Applications still in progress | 2,610 | 32% |
| Applications completed in approval | 1,575 | 28% |
| Applications completed in withdrawal | 4,025 | 71% |
| Applications completed in rejection | 70 | 1% |
| Withdrawn applications by applicant | 2,875 | 71% |
| Withdrawn applications by service | 1,150 | 29% |
See Figure 7
Data for Figure 8: Completed applications and approvals since 1 April 2017, by sector
| Group | 2017 to 2018 | 2018 to 2019 | 2019 to 2020 | 2020 to 2021 | 2021 to 2022 |
|---|---|---|---|---|---|
| Applications completed in-year (LA) | 2,715 | 2,580 | 2,110 | 3,920 | 2,365 |
| Applications approved (LA) | 970 | 1,020 | 905 | 1,170 | 675 |
| Applications completed in-year (IFA) | 4,190 | 3,655 | 3,545 | 3,830 | 3,305 |
| Applications approved (IFA) | 1,455 | 1,395 | 1,235 | 1,555 | 900 |
See Figure 8
Data for Figure 9: Number of withdrawn applications by service and applicant since 1 April 2017, by sector
| Group | 2017 to 2018 | 2018 to 2019 | 2019 to 2020 | 2020 to 2021 | 2021 to 2022 |
|---|---|---|---|---|---|
| LA withdrawals (applicant) | 995 | 1,050 | 755 | 1,345 | 970 |
| LA withdrawals (service) | 625 | 470 | 425 | 1,360 | 660 |
| IFA withdrawals (applicant) | 1,230 | 1,420 | 1,740 | 1,445 | 1,905 |
| IFA withdrawals (service) | 1,475 | 820 | 555 | 815 | 490 |
See Figure 9
Data for Figure 10: Number of approved foster carers in England as at 31 March 2022, compared to the number newly approved within the year, by sector
| Group | Total number | LA | IFA |
|---|---|---|---|
| All approved foster carers as at 31 March 2022 | 61,360 | 58% | 42% |
| Newly approved foster carers during 2021 to 2022 | 6,680 | 51% | 49% |
See Figure 10
Data for Figure 11: Ethnicity of all approved and newly approved foster carers by sector, as at 31 March 2022
| Group | White | Minority ethnic groups | Not known |
|---|---|---|---|
| All approved (England) | 49,985 | 10,680 | 700 |
| All approved (LA) | 30,200 | 4,630 | 505 |
| All approved (IFA) | 19,785 | 6,055 | 195 |
| Newly approved (England) | 5,150 | 1,340 | 190 |
| Newly approved (LA) | 2,780 | 485 | 160 |
| Newly approved (IFA) | 2,370 | 850 | 30 |
See Figure 11
Data for Figure 12: Age of foster carers by status and sector, as at 31 March 2022
| Group | 20 to 29 | 30 to 39 | 40 to 49 | 50 to 59 | 60+ |
|---|---|---|---|---|---|
| All approved (England) | 1% | 9% | 21% | 41% | 27% |
| All approved (LA) | 1% | 9% | 21% | 40% | 29% |
| All approved (IFA) | 2% | 10% | 21% | 42% | 25% |
| Newly approved (England) | 5% | 21% | 31% | 33% | 11% |
| Newly approved (LA) | 4% | 23% | 34% | 29% | 10% |
| Newly approved (IFA) | 5% | 18% | 28% | 37% | 12% |
| Deregistered (England) | 2% | 12% | 22% | 35% | 30% |
| Deregistered (LA) | 2% | 13% | 21% | 33% | 32% |
| Deregistered (IFA) | 2% | 11% | 22% | 37% | 27% |
See Figure 12
Data for Figure 13: Proportion of fostering places as at 31 March each year from 2018 to 2022, by occupancy status and sector
| Sector | Year | Filled | Vacant | Not available | Short break |
|---|---|---|---|---|---|
| LA | 2018 | 26,535 | 9,550 | 8,015 | 1,060 |
| LA | 2019 | 26,450 | 9,090 | 7,795 | 1,285 |
| LA | 2020 | 26,345 | 8,100 | 8,100 | 1,145 |
| LA | 2021 | 24,685 | 7,530 | 9,080 | 1,040 |
| LA | 2022 | 24,375 | 6,985 | 8,310 | 1,175 |
| IFA | 2018 | 17,890 | 7,600 | 7,605 | 660 |
| IFA | 2019 | 19,050 | 6,990 | 8,045 | 840 |
| IFA | 2020 | 19,770 | 5,965 | 9,220 | 605 |
| IFA | 2021 | 20,065 | 6,475 | 8,285 | 210 |
| IFA | 2022 | 20,175 | 6,185 | 7,630 | 280 |
See Figure 13
Data for Figure 14: Outcomes of investigations into allegations of abuse in 2021 to 2022 split by sector
| Sector | Number | Concerns resolved, no further action | Continued monitoring for agreed period | Concerns remained, refer to fostering panel for review |
|---|---|---|---|---|
| LA | 1,715 | 45% | 20% | 34% |
| IFA | 1,290 | 62% | 14% | 24% |
See Figure 14
Data for Figure 15: Length of time taken to resolve allegations of abuse in 2021 to 2022, by sector
| Sector | 21 days or less | 22 to 30 days | 31 to 50 days | Over 50 days |
|---|---|---|---|---|
| LA | 44% | 14% | 13% | 28% |
| IFA | 51% | 16% | 14% | 19% |
See Figure 15
Data for Figure 16: Proportion of LA households approved for family and friends care as at 31 March each year from 2018 to 2022
| Year | Total number of LA households | Family and friends LA households | Mainstream LA households |
|---|---|---|---|
| 2018 | 28,715 | 21% | 79% |
| 2019 | 29,325 | 24% | 76% |
| 2020 | 29,295 | 25% | 75% |
| 2021 | 29,540 | 27% | 73% |
| 2022 | 28,700 | 27% | 73% |
See Figure 16