Fostering in England 2020 to 2021: main findings
Published 11 November 2021
Applies to England

© Crown copyright 2021
This publication is licensed under the terms of the Open Government Licence v3.0 except where otherwise stated. To view this licence, visit nationalarchives.gov.uk/doc/open-government-licence/version/3 or write to the Information Policy Team, The National Archives, Kew, London TW9 4DU, or email: psi@nationalarchives.gov.uk.
Where we have identified any third party copyright information you will need to obtain permission from the copyright holders concerned.
This publication is available at https://www.gov.uk/government/statistics/fostering-in-england-1-april-2020-to-31-march-2021/fostering-in-england-2020-to-2021-main-findings
The Fostering in England 1 April 2020 to 31 March 2021 release also includes:
- data tables
- methodology
- pre-release access list
Summary
This release covers:
- the numbers of foster carers and foster places and placements, in both local authority (LA) fostering agencies and independent fostering agencies (IFAs)
- data relating to types of foster care, registrations, deregistrations and a range of other subjects
- the period between 1 April 2020 and 31 March 2021
Despite the numbers of fostering households and foster carers in England being at their highest ever levels, the increases are not keeping up with demand in the sector.
As at 31 March 2021, there were 45,370 fostering households and 76,640 foster carers in England. This is a 2% and 4% increase since 2014 to 2015, respectively. However, over the period to March 2020, the number of children in foster care grew by around 11%.
The number of family and friends households continues to rise, and is at an all-time high.
As at 31 March 2021, just over a quarter of LA fostering households (8,045) had family and friends care as their primary placement offer (27%). This is an increase of 7 percentage points from 2015 to 2016. Of all newly approved LA households that were still active on 31 March 2021 (6,070), 58% were family and friends households (3,525).
Although record levels of enquiries were received from prospective fostering households, the conversion rate to applications continues to fall.
There were 160,635 initial enquiries from prospective fostering households in the year ending 31 March 2021, but only 10,145 (6%) foster carer applications were received. This proportion has decreased from 12% in 2014 to 2015.
There continues to be a large difference in conversion rates from initial enquiries to applications between both sectors.
Although the majority of initial enquires (79%) came from the IFA sector, fewer of these IFA enquiries converted into applications. IFAs reported a ratio of 25:1 initial enquiries to applications, whereas LAs reported 7:1.
The proportion of fostering applications that are approved in the year has decreased.
During 2020 to 2021, 32% of fostering applications from prospective households were approved. This is a decrease from 2015 to 2016, when 44% of applications were approved.
Introduction
This statistical release covers LA fostering agencies and IFAs in England in the year 1 April 2020 to 31 March 2021. It includes data about fostering households, foster carers, retention, recruitment and capacity of providers.
Throughout this release, we have included historical trend data as far back as 2014 to 2015, where available. The 2014 to 2015 year represented a high point of foster care activity.
In the latest Department for Education (DfE) published data covering 2019 to 2020, fostered children numbered 57,380 and represented nearly three quarters of all children in care, or fewer than 1% of all children in England.
At the end of March 2021, there were 45,370 fostering households in 425 agencies in England. These households had 76,640 approved foster carers looking after about 55,990 children. These 425 agencies represented 96% of all eligible agencies: 145 LA agencies and 280 IFAs.
The numbers of fostering households and foster carers in England are at their highest ever levels. Despite this, the increase in the overall number of households and carers has been slow at a time when the number of children in care is at its highest level in England. The sectoral split has remained stable throughout this period. LAs continue to account for around two thirds of both households and carers.
Over the last 7 years, the general trend has been of a slow increase in numbers of places, with a 9% increase since March 2015. However, this increase has not kept up with the demand for places, with the number of children in foster care having increased by around 11% over the period to March 2020. Our own research, along with that carried out by The Competition and Markets Authority (CMA), indicates that although there are more approved places than children in foster care, this does not mean that there are sufficient appropriate placements for children. While the number of children in care continues to grow, one of the most significant challenges in suitably matching children with carers is the shortage of fostering families, increasing the likelihood of further instability for fostered children.
The majority of fostering places (60%) are still approved by LA fostering services. This is to be expected since they care for almost two thirds of children in placements (64%).
Patterns of occupancy have stayed broadly the same over the last 7 years, with just under two thirds of places being filled. LAs continue to have higher proportions of filled places (68%) than IFAs (58%). However, this higher proportion of filled places in LAs is largely accounted for by family and friends carers, due to the nature of their approvals for a specific child.
This year, although record levels of enquiries were received from prospective fostering households, the proportion that convert into applications is at an all-time low (6%), and half of what it was in 2014 to 2015 (12%). There continues to be a large difference in conversion rates from initial enquiries to applications between both sectors. Although the majority of initial enquires (79%) came from the IFA sector, fewer of these IFA enquiries converted into applications. IFAs reported a ratio of 25:1 initial enquiries to applications, whereas LAs reported a ratio of 7:1.
Fostering households
We collected data on 45,370 fostering households from 425 agencies (LA and IFA), which accounts for 96% of all eligible agencies. The number of fostering households is at its highest level since 2015, although this only represents a 2% increase over this time.
The sector split of fostering households as at March 2021 has remained very similar over the last 7 years. LAs accounted for around 29,500 households (65%), and IFAs for around 15,800 households (35%).
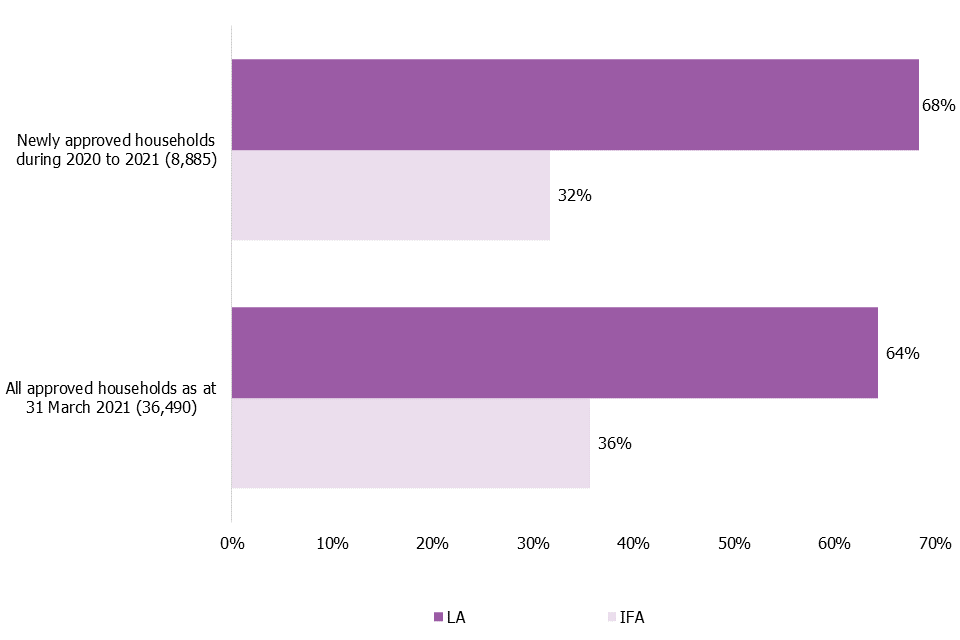
Of the 45,370 households, 8,880 were newly approved during 2020 to 2021 and still active at 31 March 2021. This marked a 12% increase in the number of newly approved households since 2014 to 2015. LAs accounted for just over two thirds of newly approved households (6,070 households or 68%), although 58% (3,525) of these new LA approvals were family and friends households
Figure 1: Proportion of all approved and newly approved households by sector, as at 31 March 2021
View data in an accessible format.
As at 31 March 2021, the majority of fostering households had 2 carers. Single-carer households accounted for less than one third (31%) of all households. This picture has been the same since 2015 to 2016.
Households by primary placement type
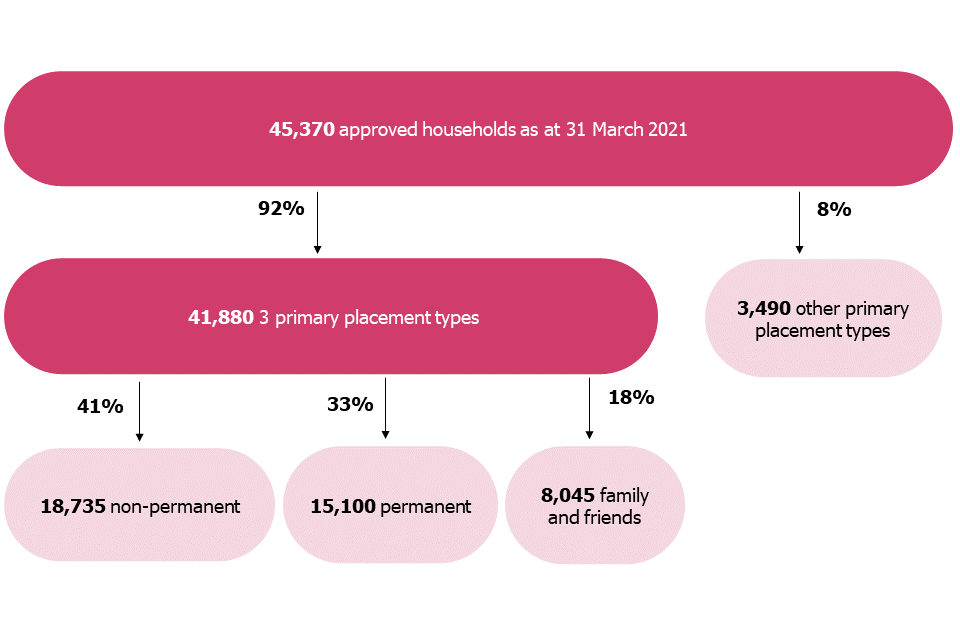
As at 31 March 2021, 3 primary placement types accounted for 92% of all fostering households in England: non-permanent (41%), permanent (33%) and family and friends (18%). ‘Non-permanent’ care refers to care that is not currently planned to last until the child ceases to be looked after or until the child reaches 18.
Figure 2: Breakdown of the primary placement types of fostering households at 31 March 2021
This chart is not to scale.
View data in an accessible format.
While the proportions of households with the primary placement types of ‘non-permanent’ and ‘permanent’ have remained similar since 2015 to 2016, the proportion whose primary offer was for family and friends care has increased by 5 percentage points over this same period.
Family and friends care is only offered by households within the LA sector, and involves a separate approval process to other types of foster care. These households usually receive this separate approval to care for a specific child/children. Almost all of these types of households (99%) were not approved to offer other types of care.
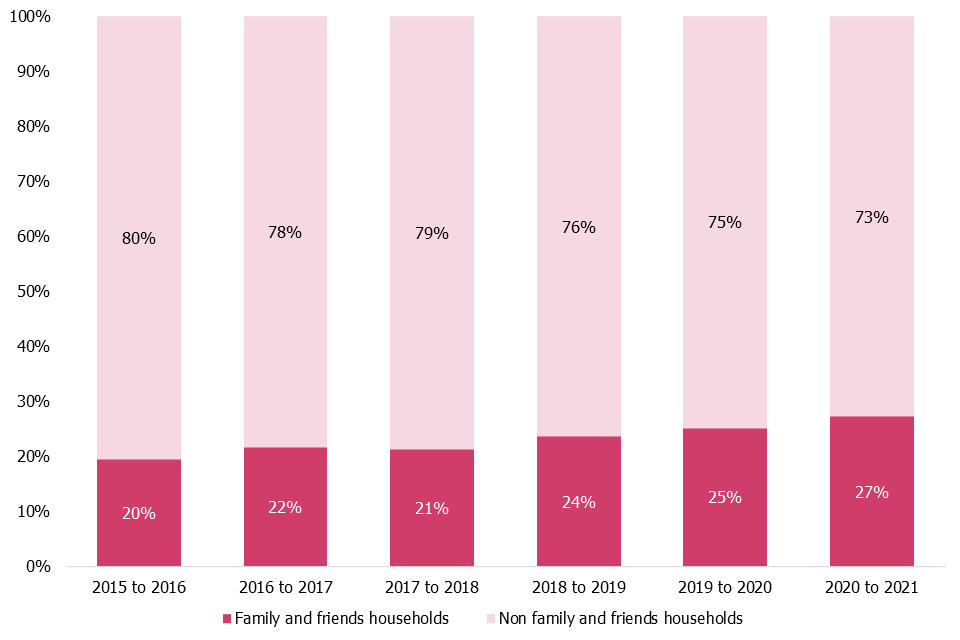
As at 31 March 2021, just over a quarter of LA households had family and friends care as their primary placement offer (27%). This marked an increase of 7 percentage points from 2015 to 2016.
Since 2015 to 2016, there has been an increased reliance on family and friends households by LAs to place children.
Figure 3: Proportion of LA households approved for family and friends care since 2015 to 2021
View data in an accessible format.
The other primary placement types (short breaks, emergency, parent and child, multi-dimensional treatment, fostering to adopt, remand, shared care and ‘other’) accounted for less than 10% of fostering households in England.
Family and friends households
As at 31 March 2021, of the 45,370 approved households, 8,045 (18%) were family and friends households. These households had 12,750 foster carers, looking after 11,240 children.
There were 5,215 newly approved family and friends households during 2020 to 2021, which represented 66% of all newly approved LA households. Of these newly approved family and friends households, 3,525 (68%) were still active at 31 March 2021. The other 1,690 households were both approved and deregistered in the year. This is common for these types of households, which are often only temporarily approved to provide foster care for a specific child, sometimes for a short period of time, until a more permanent option is found.
In total, there were 4,180 family and friends households that deregistered during 2020 to 2021. Nearly half (41%) of the deregistered family and friends households deregistered within 6 months. These households are more likely to have shorter terms of approval, for the reasons given above.
Family and friends households accounted for 58% of new approvals that were still active on 31 March 2021, and 62% of deregistrations in the LA sector.
All commentary from this point on in the fostering households section will exclude households with a primary offering of family and friends care.
Newly approved households
In total, there were 5,680 newly approved fostering households during 2020 to 2021 that were still active on 31 March 2021.
The number of newly approved households whose primary placement type was non-permanent foster care was similar among LAs and IFAs. In contrast, IFAs approved almost 3 times more households whose primary placement type was permanent: 980 new households in IFAs compared with 380 in LAs. There was a similar pattern in new approvals in the previous year.
Table 1: Primary placement type of foster care offered by newly approved households during 2020 to 2021, by sector
| Primary placement type | Number of new households – England | Number of new households – LA | Number of new households – IFAs | Percentage of new households – LA | Percentage of new households – IFAs |
|---|---|---|---|---|---|
| Non-permanent | 3,200 | 1,635 | 1,565 | 64 | 56 |
| Permanent | 1,355 | 380 | 980 | 15 | 35 |
| All other types | 800 | 530 | 270 | 21 | 10 |
Households offering a range of foster care
As at 31 March 2021, 62% of fostering households offered multiple types of foster care, in line with previous years. Of all fostering households in England, 37% were approved for 2 types of care, 15% for 3 types of care and 10% for 4 or more types of care.
In line with previous years, the proportion of households approved for multiple types of care was much higher in the IFA sector: 86%, compared with 45% for LAs.
Fostering household sizes
As at 31 March 2021, the majority (71%) of fostering households were approved to care for 2 or more children. Although IFA households were more likely to be approved to care for larger numbers of children, they also had higher numbers of vacant places, suggesting that some IFAs may be approving larger numbers of places than they are likely to be able to fill. For example, in one large IFA, all households were approved for 3 children. These places accounted for 3% of all approved IFA places. However, of these places, less than half were filled (45%). The remaining places were either vacant or not available. As a result of similar practice across some other IFAs, the proportion of total approved places in IFAs will not reflect the real number of available places.
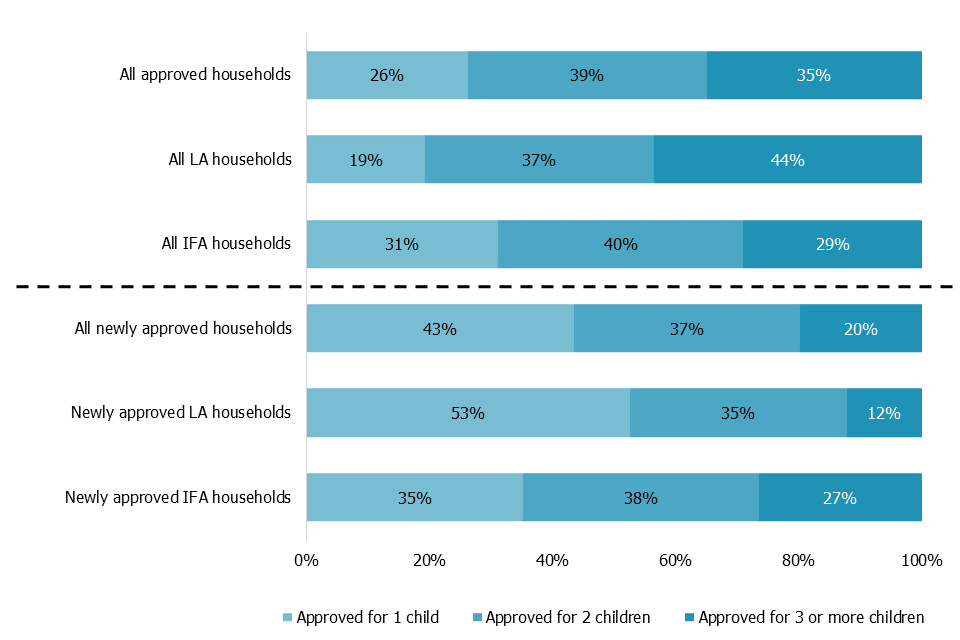
For IFA households, 41% were approved to care for 3 or more children, compared with 27% of LA households. The proportion of households approved for larger numbers of children has decreased slightly on the previous year, as part of steady decreases since a peak in 2018 to 2019, with this capacity now at the lowest level since 2014 to 2015.
Within both LA and IFA sectors, newly approved households were more likely to be approved to look after smaller numbers of children. Forty-three per cent of newly approved households that were approved in 2020 to 2021 were for 1 child, compared with 29% of all approved households.
Figure 4: Proportion of all households and newly approved households by household size, as at 31 March 2021
View data in an accessible format.
Fostering households – postcode data
Postcodes of the fostering household began to be recorded in the latest collection. This allows for detailed geographic analysis of households. Of the 37,325 approved and newly approved households, 34,905 (93%) included postcode information, and 98% of these were matched to a coordinate. Distances were calculated between households and the registered address of the agency or authority as recorded with Ofsted. As such, distances may not account for agencies with regional sub-offices.
For households registered to agencies in England, the average distance between a household and its agency/authority office was 19 miles. LA households were on average 10 miles from their authority’s registered address, while IFA households were on average 32 miles from their agency’s registered address. As might be expected, this shows that LAs tend to approve more local households compared with IFAs.
We will be publishing more on distances in relation to locations of placements next year.
Table 2: Average distance (in miles) between households and parent agencies by region
| Region | All sectors | LA | IFA |
|---|---|---|---|
| East Midlands | 24 | 14 | 33 |
| East of England | 21 | 17 | 31 |
| London | 20 | 6 | 33 |
| North East, Yorkshire and the Humber | 14 | 8 | 28 |
| North West | 13 | 8 | 21 |
| South East | 28 | 14 | 43 |
| South West | 24 | 12 | 41 |
| West Midlands | 16 | 9 | 23 |
| England | 19 | 10 | 32 |
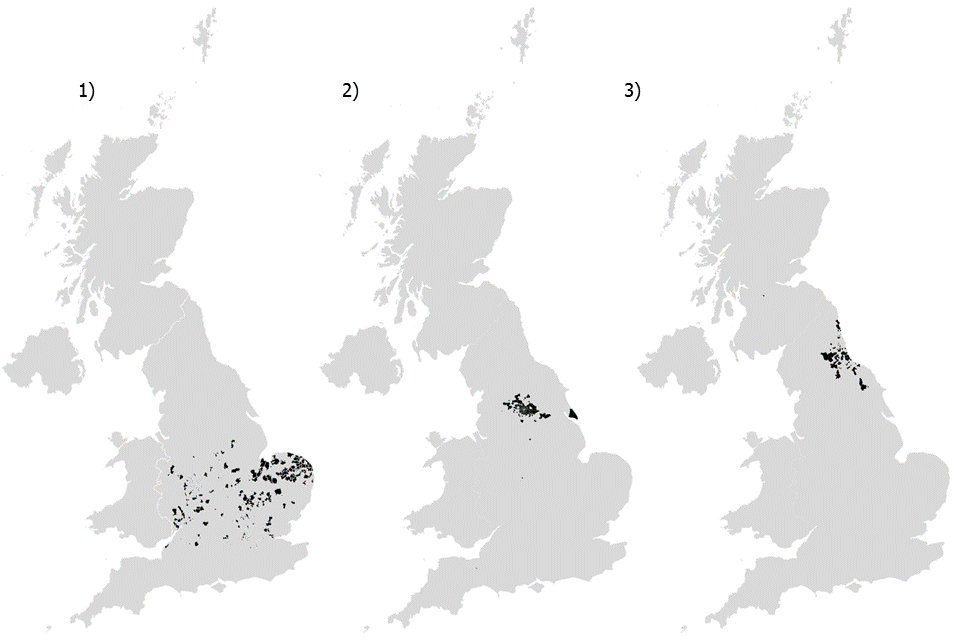
The region that an agency/authority was based in also affected the average distance between household and agency office. LAs and IFAs registered to addresses in the South East had a much higher average distance between household and agency. Figure 5 below highlights the different levels in distribution of households between a large IFA, a large LA and a more modest-sized IFA. The difference between the large IFA and large LA shows the difference in recruitment scope that the 2 sectors can have.
The postcode data will be used to better inform our inspection of fostering agencies. It also allows us to see for the first time the nature of the distribution of households for each agency. As can be seen in Figure 5, a large IFA (1) can have households spread over many areas of the country, in a number of regions. An LA, even a large one (2), tends to have carers more proximate to its boundary, while still having some carers at some distance from it. And a modestly sized IFA (3) may specialise regional recruitment in particular regions.
We will be publishing more on the subject of the geographical aspects of foster care, particularly on the topic of deprivation, next year.
Figure 5: Distribution of 1) a large IFA, 2) a large LA and 3) a modestly sized IFA
View data in an accessible format.
Retention
In the following retention and recruitment sections, family and friends households are excluded.
In the year ending 31 March 2021, the number of newly approved households was higher than the number of deregistered households (5,355 newly approved and 4,870 deregistered). There were also 320 households that were both approved and deregistered during the year.
As at 31 March 2021, a greater proportion of LA households had been caring for children for 10 years or more (31%), compared with IFA households (16%).
The proportional split between the 2 sectors was relatively even, with 53% (2,580) of deregistrations in LAs and 47% (2,285) in IFAs.
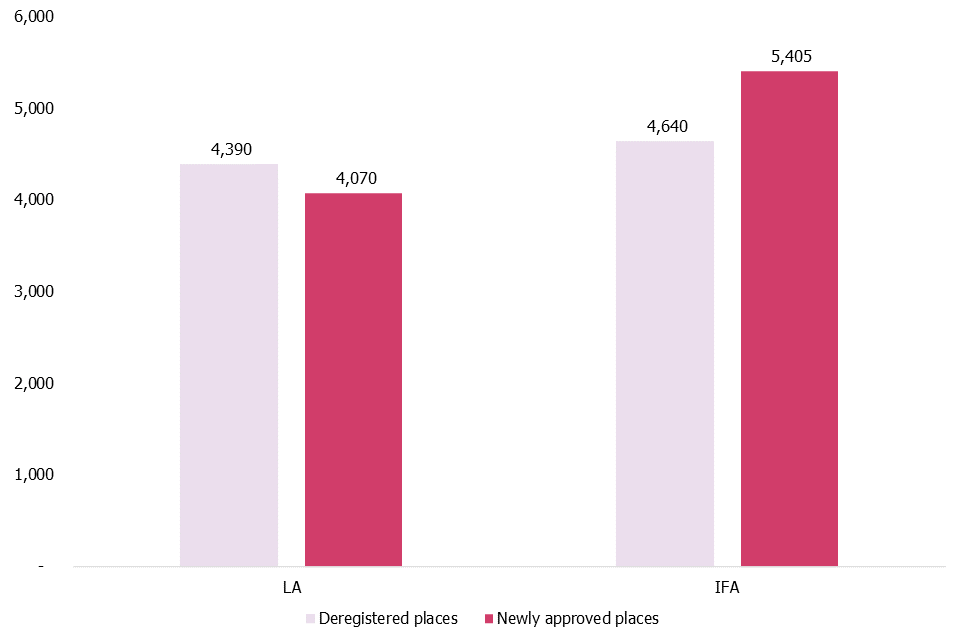
Recruitment and retention among IFA services has led to a net increase in capacity: 525 additional households and 765 additional places. In contrast, there has been a decrease in capacity of 35 households and 325 places in the LA sector. The large decrease in places compared with households was due to a high number of households approved for 3 or more places being deregistered, with new approvals of this type of home being much lower. Table 3 illustrates this further.
Table 3: Net change between deregistrations and new approvals of LA and IFA households, by number of approved places
| Approved places | Deregistered households | Newly approved households | Net change in households | |
|---|---|---|---|---|
| LAs | 1 place | 1,245 | 1,335 | 85 |
| LAs | 2 places | 870 | 895 | 25 |
| LAs | 3 or more places | 460 | 310 | -150 |
| IFAs | 1 place | 705 | 990 | 285 |
| IFAs | 2 places | 835 | 1,075 | 240 |
| IFAs | 3 or more places | 750 | 745 | 0 |
Due to rounding, totals may not add up.
Overall, there was a net increase of 45 LA carers and a net increase of 960 IFA carers.
Figure 6: Number of deregistered and approved places during 2020 to 2021, by sector
View data in an accessible format.
Deregistrations and length of time being a foster carer
Thirty per cent of deregistered fostering households (1,470) deregistered within 2 years of their approval.
The length of time between approval and deregistration tended to be longer among LA fostering services than in IFAs. LA services reported that 27% of deregistrations were within 2 years of approval, while 29% had been with their services for more than 10 years. In contrast, a higher proportion of deregistrations were within 2 years among IFAs (34%), while a lower proportion had been with their services for more than 10 years (15%).
Recruitment
Enquiries to applications
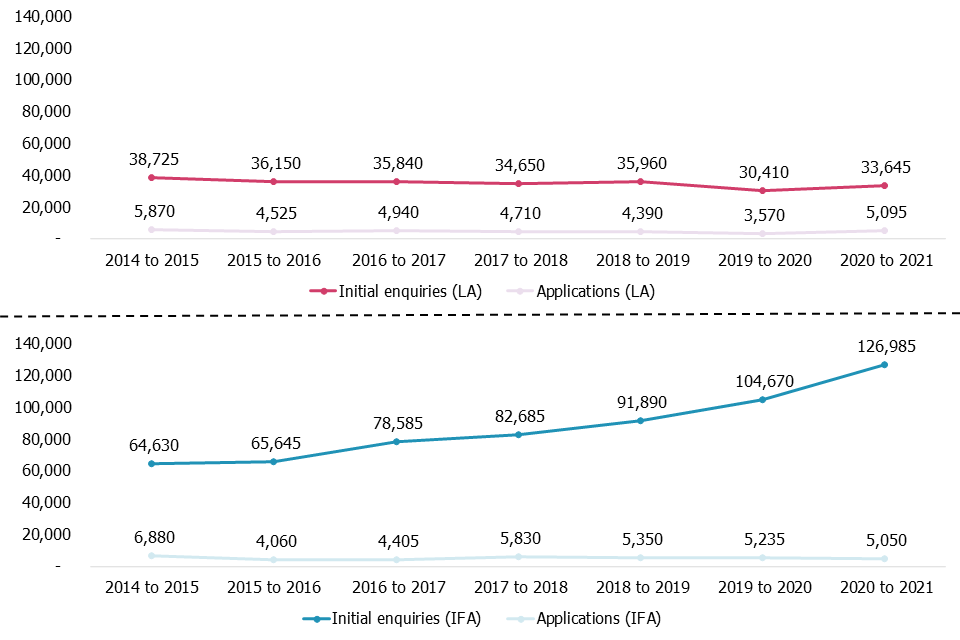
There were 160,635 initial enquiries from prospective fostering households in the year ending 31 March 2021. The number of initial enquiries is at an all-time high and there has been a 55% increase since 2014 to 2015 (103,355).
We recorded that almost 4 in 5 initial enquiries (79%) were within the IFA sector. This continues the trend of growing numbers of initial enquires coming from the IFA sector, from 64,630 in 2014 to 2015, to 126,985 in 2020 to 2021. This year, there was an increase in initial enquires in both sectors, a 21% increase for IFAs and 11% for LAs.
Despite this record level of enquiries, there were only 10,145 applications received to become a foster carer. While IFAs received 126,985 initial enquiries, they only received 5,050 applications, slightly fewer than the 5,095 applications received by LAs following 33,645 enquiries, a much smaller number of enquiries in comparison. This highlights the major differences in conversion rates from initial enquiries to applications in the sectors.
IFAs reported a ratio of 25:1 initial enquiries to applications, whereas LAs reported a ratio of 7:1. Both sectors’ ratios suggest that a relatively large volume of enquiries are not translating into applications. Figure 7 illustrates this gap between enquiries and applications.
The conversion rate of enquiries to applications in England is at the lowest level on record, 16:1. This marks a continuation of a steady decline since 2014 to 2015, when the ratio was around 8:1.
Applications have decreased by 20% since 2014 to 2015, from 12,750 to 10,145. There has been a 27% decrease in applications in IFAs and a 13% decrease in LAs.
Figure 7: Enquiries and applications since 1 April 2014, by sector
View data in an accessible format.
Applications to approvals
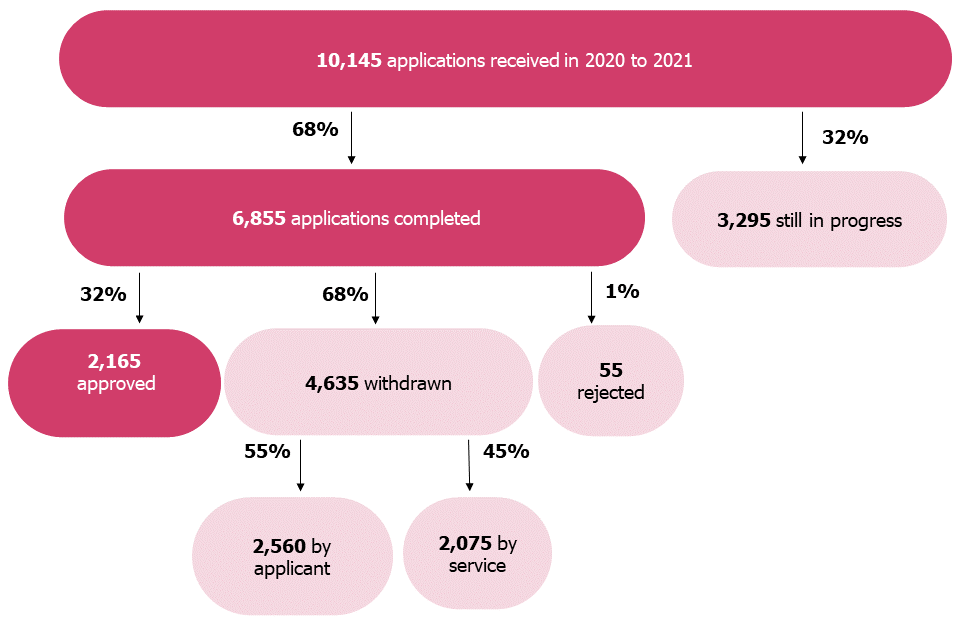
Of the 10,145 applications received, 6,850 (68%) were completed in-year. Since 2015 to 2016, there has been an overall increase in completed applications, from 61% to 68% this year.
The outcomes of those 6,850 completed applications were: 32% approved (2,165), 68% withdrawn (4,635) and 1% rejected (55). Of the 4,635 withdrawn applications, 55% (2,560) were withdrawn by the applicant and 45% (2,075) were withdrawn by the service. This split in withdrawals differs from previous years, when there tended to be, on average, around two thirds of withdrawals from applicants, and the other third by the service.
The full ratio of initial enquiries to final approved applications in all sectors was 74:1. For LAs, this ratio was lower at 36:1, whereas for IFAs, the ratio was much higher at 102:1.
Figure 8: Applications received in 2020 to 2021, by status on 31 March 2021
This chart is not to scale.
View data in an accessible format.
Despite the increase in completed applications since 2015 to 2016, the proportion of those that were approved has decreased over the same period. In 2015 to 2016, 44% of completed applications were approved, compared with 32% this year. There has been a decrease in proportions of approved applications in both sectors over the years. However, it is most notable in the LA sector, where only 26% of completed applications led to approvals this year, compared with 45% in 2015 to 2016. The large proportional decrease this year in the LA sector is accounted for by the large increase in number of withdrawals, particularly those withdrawn by the service. This change might be as a result of COVID-19 but we will need to wait until we have next year’s data to be able to make any real comparisons. In IFAs, 38% were approved this year, compared with 43% in 2015 to 2016.
Figure 9: Completed applications and approvals since 1 April 2016, by sector
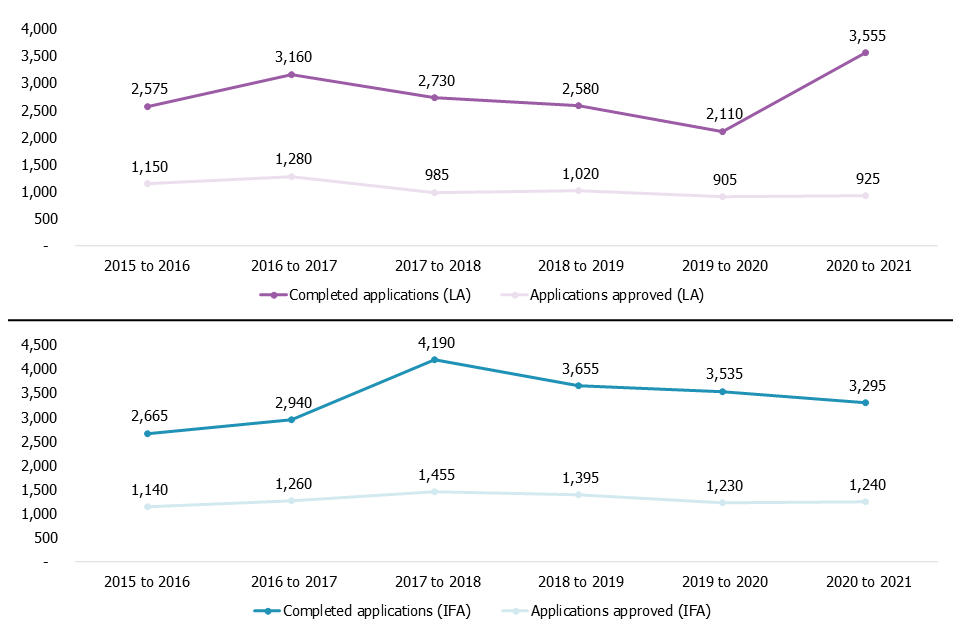
View data in an accessible format.
Training and development
As at 31 March 2021, 80% of approved foster carers (51,145) had completed their training, standards and development. Both sectors had similar levels of completed training: LAs 80% and IFAs 81%.
Of those carers who were overdue to complete their training, 59% (7,540) were in progress, 30% (3,760) had not yet started and 5% (655) were awaiting sign-off. The remaining 6% (790) had a status of ‘not known’ recorded, almost all accounted for by the IFA sector.
Figure 10: Training, standards and development status of foster carers by sector, as at 31 March 2021
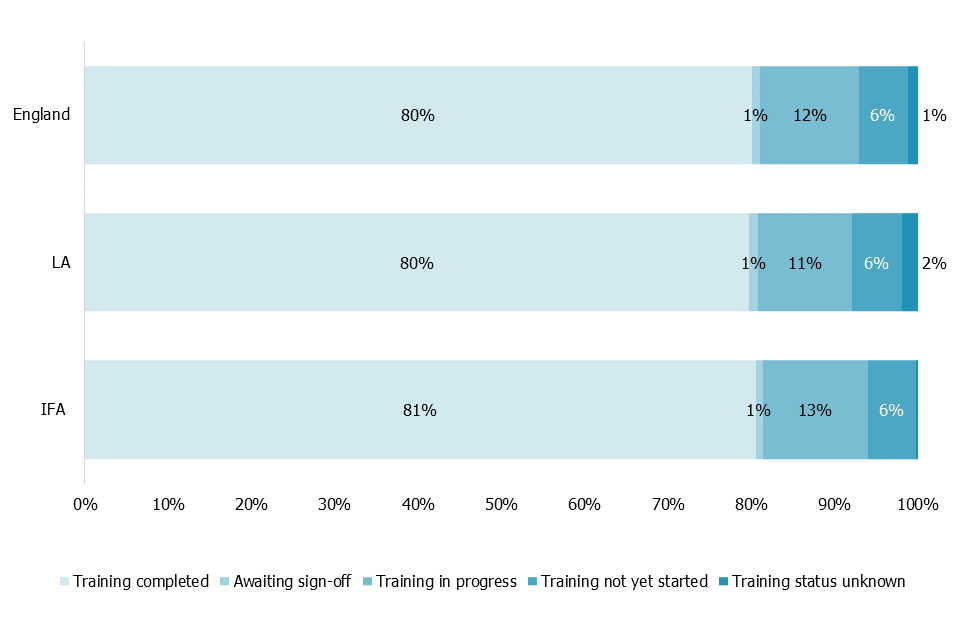
View data in an accessible format.
Foster carers
In the following foster carer sections, data has been included for all types of foster carers, including family and friends carers.
Approved foster carers
As at 31 March 2021, the number of approved foster carers was 76,640. This continues the slow increase in number of foster carers over the years, with a 4% increase from 2014 to 2015 (73,845 carers). Despite this increase in foster carers, the number has not kept up with demand in the sector, which has had an increase of around 11% in the number of fostered children over the period to March 2020. Although the number of children in care continues to grow, one of the most significant challenges in suitably matching children with carers is the shortage of fostering families, increasing the likelihood of further instability for fostered children.
As in previous years, LA agencies continued to account for almost two thirds of all carers (64%) and almost two thirds (64% or 35,925) of filled placements. In both the LA and IFA sectors, the number of foster carers increased from the previous year.
Of the 76,640 approved foster carers, 14,645 (19%) were newly approved between 1 April 2020 and 31 March 2021, an increase of 3 percentage points since 2015 to 2016. LA agencies once again accounted for a third (67%) of these new approvals in 2020 to 2021, which is to be expected since LA households continue to make up almost a third of all approved carers (64%).
Figure 11: Proportion of approved and newly approved foster carers in England, by sector
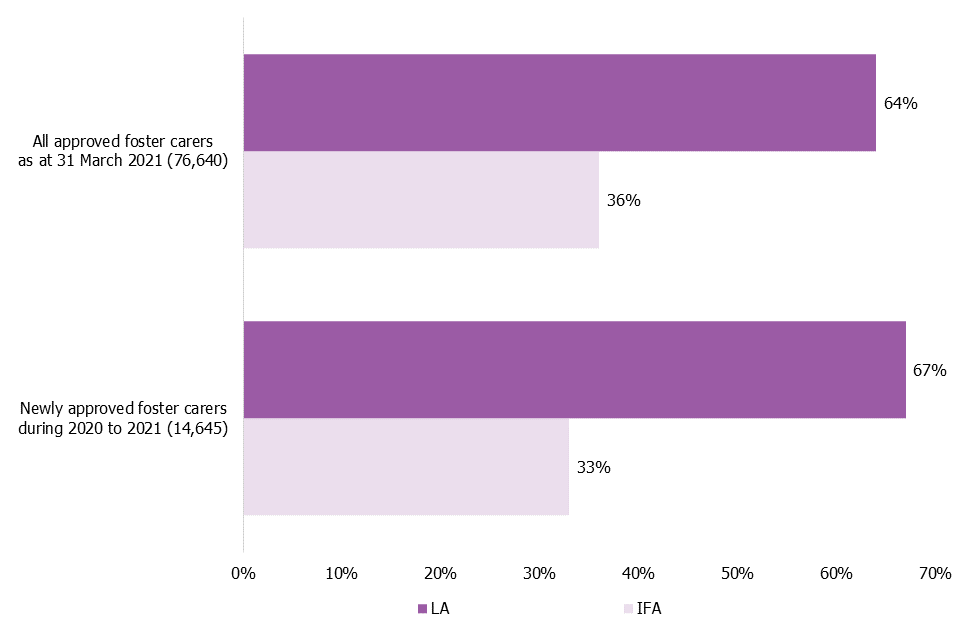
View data in an accessible format.
Ethnicity
On 31 March 2021, in line with previous years, most foster carers were White (82%). This is lower than the proportion of White people in the adult (aged 25 and older) population (88%).
As with previous years, there was a greater proportion of foster carers from non-White ethnic groups in IFAs (22%) than in the LA sector (12%), which reflects the proportion of children placed from non-White ethnic groups in each sector.
Of all newly approved foster carers during 2020 to 2021, 80% were White and 15% were from non-White ethnic groups. The remaining 5% were reported with their ethnicity marked as ‘not known’, in line with previous years. The large majority of these were family and friends carers approved by LA agencies.
Figure 12: Ethnicity of foster carers by sector, as at 31 March 2021 and approved during 2020 to 2021
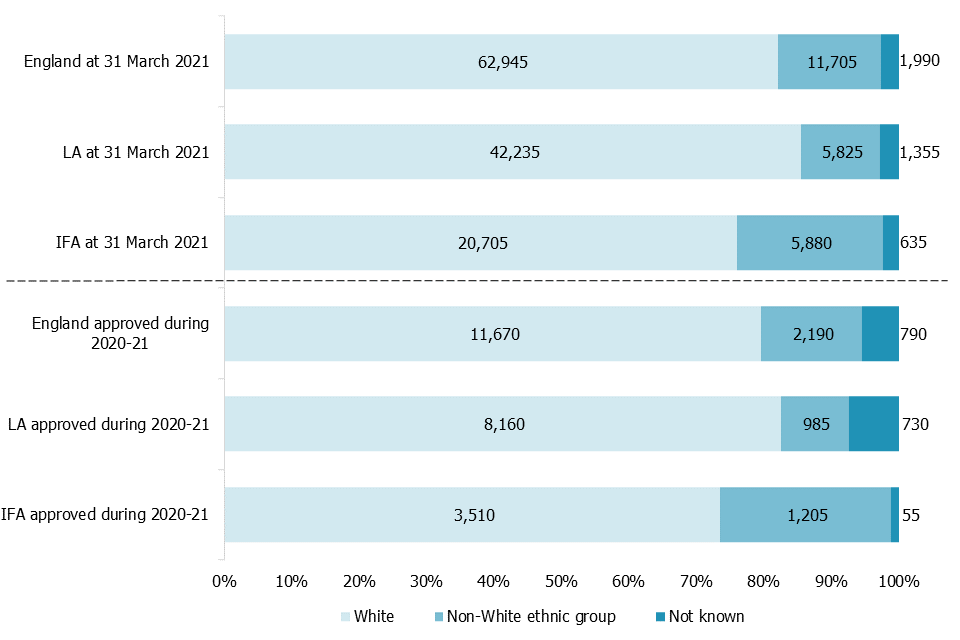
Of all foster carers approved at 31 March 2021, 5% had an ethnicity of ‘not known’ recorded. As a result, numbers relating to ethnic groups do not always add up to the totals.
View data in an accessible format.
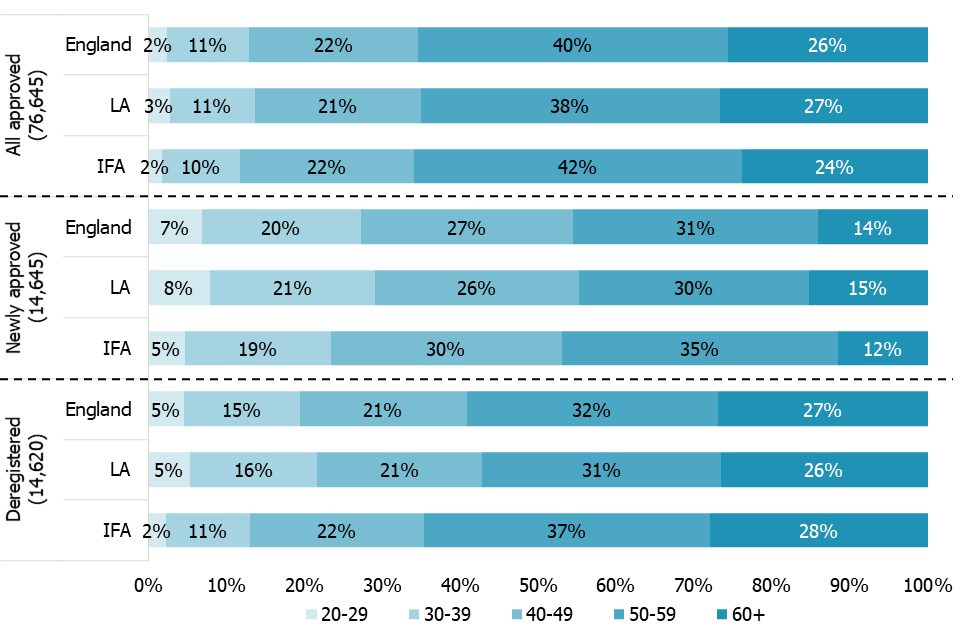
Age
This was the second year that we collected age data for foster carers, and the picture has remained largely similar to last year.
As at 31 March 2021, the largest group of all approved foster carers were in their 50s (40%).
For newly approved foster carers, there is a higher percentage of carers in the younger age brackets. Foster carers in their 20s and 30s accounted for just over a quarter (27%) of all newly approved foster carers.
When looking at the age of foster carers who deregistered, almost 60% of carers were over 50. Those carers in their 50s had the highest proportion of deregistrations (32%) and those in their 20s had the lowest (5%). However, when looking at the proportion of carers who deregistered within each age bracket, those in their 50s had the lowest proportion of deregistrations (13%) and those in their 20s the highest (27%). Of those deregistrations of carers in their 20s, 80% were family and friends carers in the LA sector.
Figure 13: Age of foster carers by status and sector, as at 31 March 2021
View data in an accessible format.
Fostering capacity
In the following fostering capacity sections, data has been included for all types of fostering households, including family and friends households.
Approved places
There were 88,180 fostering places in England as at 31 March 2021, which is broadly in line with previous years.
Over the last 7 years, the general trend has been of a slow increase in numbers of places, with a 9% increase since March 2015. However, this increase has not kept up with demand. This is because there are not always sufficient appropriate foster care placements for children, despite there being more approved places than children. LA places have increased by 9% overall, while IFA places have increased by 11%. The majority of fostering places are still approved by LA fostering services. LAs reported 60% of all approved places, with 40% in IFAs, which is similar to previous years.
There were 1,250 household places used exclusively for short breaks. This is a drop from 1,750 in March 2020, and from 2,120 in 2019.
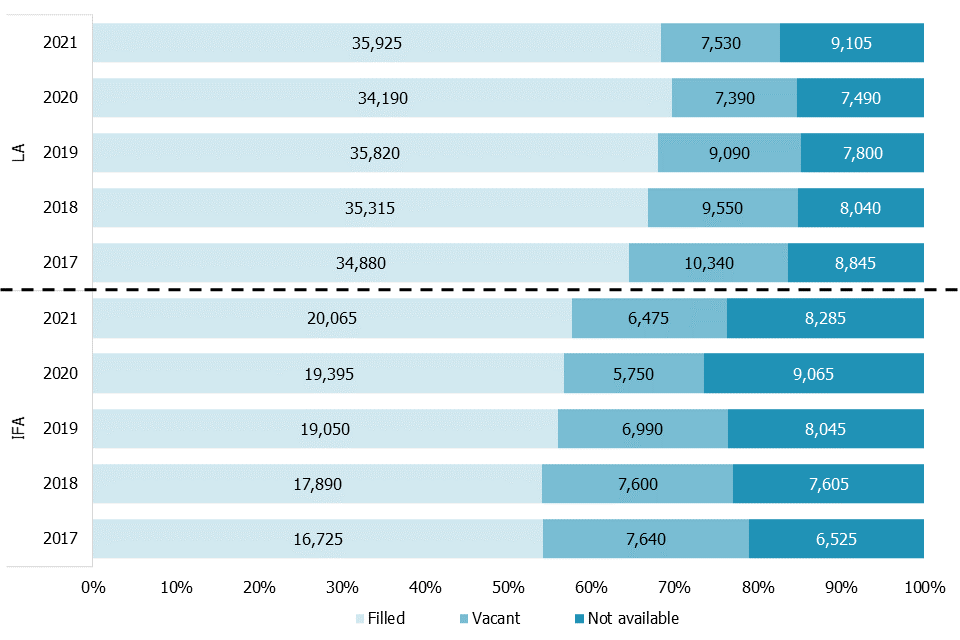
Occupancy
Of the 88,180 approved fostering places for which we have data, excluding those places used exclusively for short breaks:
- 64% were filled (55,990)
- 16% were vacant (14,005)
- 20% were ‘not available’ (17,390)
Patterns of occupancy have maintained a steady trend over the last 5 years. There have generally been more children living with foster carers and fewer places.
When looking at levels of occupancy within both sectors, we can see a difference. LAs continue to have higher proportions of filled places (68%) than IFAs (58%). However, this higher proportion of filled places in LAs is largely accounted for by family and friends carers, due to the nature of their approvals. IFAs continue to have higher proportions of both vacant places (19% compared with 14% in LAs) and ‘not available’ places (24% compared with 17% in LAs).
Figure 14: Fostering places by occupancy status and sector since 2017
View data in an accessible format.
Unavailable fostering places
Of the 88,180 approved fostering places, 20% (17,390) were ‘not available’. There has been a very gradual increase in the number of ‘not available’ places over the years, from 17% in 2014 to 2015.
A higher proportion of places were unavailable in IFAs (24%) than in LAs (17%). There can be a number of reasons why a place is ‘not available’ for fostering. When looking at the differences in reasons for these unavailable places between sectors, IFAs tended to have higher proportions of unavailable places due to the needs of the child currently in placement (19%) and places only available if a sibling group is placed (22%). LAs tended to have more places unavailable due to the carer taking a break or pending resignation (21%). However, across both sectors, the most common reason given for unavailable places was for ‘carer reasons (not otherwise stated)’. For a full breakdown of the reasons for unavailable places, please see the accompanying underlying data file for this release.
Safeguarding
In the following safeguarding sections, data has been included for all types of fostering households, including family and friends households.
Restraint
During 2020 to 2021, there were 930 reported incidents of physical restraint, 82% of which were reported in the IFA sector, which is in line with previous years. Some of the differences between sectors may be affected by variations in reporting processes between IFAs and LAs, but this data almost certainly includes a large amount of under reporting by LAs over the years.
Allegations of abuse
During 2020 to 2021, there were 2,600 allegations of abuse made against foster carers.
Almost two thirds of allegations of abuse in 2020 to 2021 (1,585 or 61%) were made by fostered children against their foster carers, which is a similar proportion to previous years. The remaining allegations came from other sources. In the same way as previous years, the split between allegations made in both sectors broadly reflects the proportion of children placed in each sector.
Physical abuse continues to account for the largest number of allegations. In 2020 to 2021, 53% of all allegations were related to physical abuse; this percentage has remained very similar over the years. Allegations of sexual abuse continue to be the least common, accounting for 8%. This proportion has remained practically unchanged since 2014 to 2015.
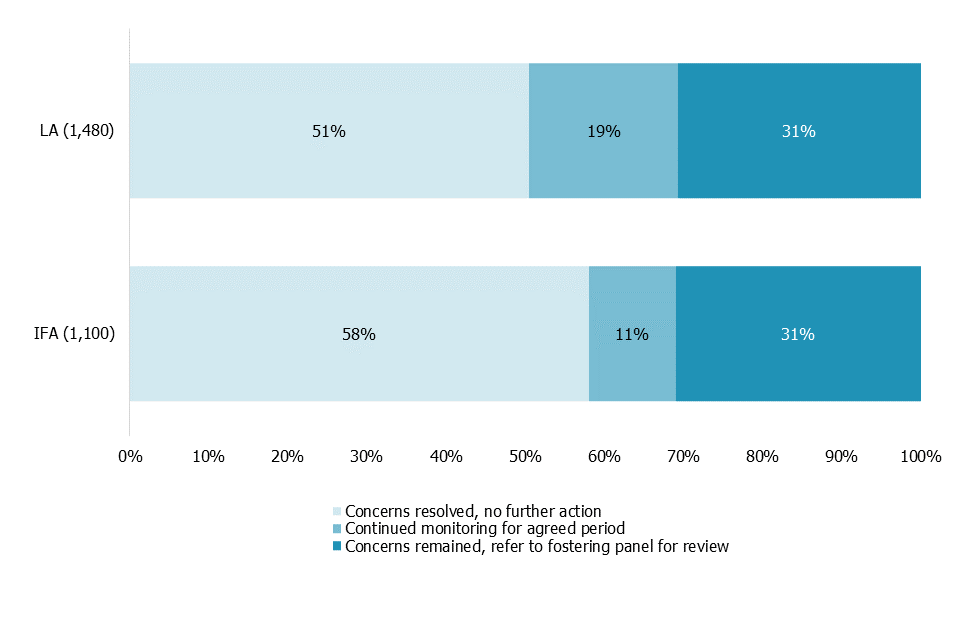
Just over half (54%) of all allegations resulted in an outcome of no further action. There has been a slight decrease in this outcome over the years, from 60% in 2014 to 2015. Broadly in line with previous years, 15% of allegations were subject to continued monitoring of foster carers. The proportion of allegations referred on to the fostering panel for review has continued to increase slightly over the last few years, from 26% in 2018 to 2019, to 31% in 2020 to 2021.
Figure 15: Outcomes of investigations into allegations of abuse in 2020 to 2021 split by sector
View data in an accessible format.
Half of all investigations into allegations were resolved in less than 21 days. Just over a quarter of allegations (26%) took more than 50 working days to conclude. On average, in both sectors, allegations were concluded in broadly the same amount of time.
Revisions to previous release
This is the first release of this data for the period 1 April 2020 to 31 March 2021.
The Fostering in England 1 April 2020 to 31 March 2021 page also includes:
- data tables
- methodology
- pre-release access list
Contacts
If you are a member of the public and have any comments or feedback on this publication, please contact Adam King socialcaredata@ofsted.gov.uk.
Acknowledgements
Thanks to the following for their contribution to this statistical release: Leonard Tippetts and Klara Davies.
Glossary
Definitions of terms are within the statistical glossary.
Annex: data tables for figures
This section contains the underlying data in an accessible table format for all figures.
Data for Figure 1: Proportion of all approved and newly approved households by sector, as at 31 March 2021
| Sector | Approved households as at 31 March 2021 (36,490) | Newly approved households during 2020 to 2021 (8,885) |
|---|---|---|
| IFA | 36% | 32% |
| LA | 64% | 68% |
See Figure 1.
Data for Figure 2: Breakdown of the primary placement types of fostering households at 31 March 2021
| Primary placement type | Number of households | Percentage of households |
|---|---|---|
| 3 primary placement types | 41,880 | 92% |
| Other placement types | 3,490 | 8% |
See Figure 2.
Data for Figure 3: Proportion of LA households approved for family and friends care since 2015 to 2021
| Year | Family and friends households | Non family and friends households |
|---|---|---|
| 2015 to 2016 | 20% | 80% |
| 2016 to 2017 | 22% | 78% |
| 2017 to 2018 | 21% | 79% |
| 2018 to 2019 | 24% | 76% |
| 2019 to 2020 | 25% | 75% |
| 2020 to 2021 | 27% | 73% |
See Figure 3.
Data for Figure 4: Proportion of all households and newly approved households by household size, as at 31 March 2021
| Approved for 1 child | Approved for 2 children | Approved for 3 or more children | |
|---|---|---|---|
| Newly approved IFA households | 35% | 38% | 27% |
| Newly approved LA households | 53% | 35% | 12% |
| All newly approved households | 43% | 37% | 20% |
| All LA households | 19% | 37% | 44% |
| All IFA households | 31% | 40% | 29% |
| All approved households | 26% | 39% | 35% |
See Figure 4.
Data for Figure 5: Distribution of 1) a large IFA, 2) a large LA and 3) a modestly sized IFA
1) A large IFA can have households spread over many areas of the country, in a number of regions.
2) An LA, even a large one, tends to have carers more proximate to its boundary, while still having some carers at some distance from it.
3) A modestly sized IFA may specialise regional recruitment in particular regions.
See Figure 5.
Data for Figure 6: Number of deregistered and approved places during 2020 to 2021, by sector
| IFA | LA | |
|---|---|---|
| Deregistered places | 4,640 | 4,390 |
| Newly approved places | 5,405 | 4,070 |
See Figure 6.
Data for Figure 7: Enquiries and applications since 1 April 2014, by sector
| 2014 to 2015 | 2015 to 2016 | 2016 to 2017 | 2017 to 2018 | 2018 to 2019 | 2019 to 2020 | 2020 to 2021 | |
|---|---|---|---|---|---|---|---|
| Initial enquiries (LA) | 38,725 | 36,150 | 35,840 | 34,650 | 35,960 | 30,410 | 33,645 |
| Initial enquiries (IFA) | 64,630 | 65,645 | 78,585 | 82,685 | 91,890 | 104,670 | 16,985 |
| Applications (LA) | 5,870 | 4,525 | 4,940 | 4,710 | 4,390 | 3,570 | 5,095 |
| Applications (IFA) | 6,880 | 4,060 | 4,405 | 5,830 | 5,350 | 5,235 | 5,050 |
See Figure 7.
Data for Figure 8: Applications received in 2020 to 2021, by status on 31 March 2021
| Total number of applications received from prospective fostering households between 1 April and 31 March | 10,145 |
|---|---|
| Number of applications approved | 2,165 |
| Total Number of applications withdrawn | 4,635 |
| Number of applications withdrawn by applicants | 2,560 |
| Number of applications withdrawn by services | 2,075 |
| Number of applications rejected after being presented to panel | 55 |
| Number of applications which remained in progress on 31 March | 3,295 |
| Number of applications completed | 6,850 |
See Figure 8.
Data for Figure 9: Completed applications and approvals since 1 April 2016, by sector
| 2015 to 2016 | 2016 to 2017 | 2017 to 2018 | 2018 to 2019 | 2019 to 2020 | 2020 to 2021 | |
|---|---|---|---|---|---|---|
| Completed applications (LA) | 2755 | 3155 | 2735 | 2580 | 2135 | 3560 |
| Applications approved (LA) | 1150 | 1280 | 985 | 1020 | 905 | 925 |
| Completed applications (IFA) | 2725 | 2940 | 4190 | 3655 | 3540 | 3295 |
| Applications approved (IFA) | 1140 | 1260 | 1455 | 1395 | 1230 | 1240 |
See Figure 9.
Data for Figure 10: Training, standards and development status of foster carers by sector, as at 31 March 2021
| England | LA | IFA | |
|---|---|---|---|
| Training completed | 80% | 80% | 81% |
| Awaiting sign off | 1% | 1% | 1% |
| Training in progress | 12% | 11% | 13% |
| Training not yet started | 6% | 6% | 6% |
| Training status unknown | 1% | 2% | 0% |
See Figure 10.
Data for Figure 11: Proportion of approved and newly approved foster carers in England, by sector
| LA | IFA | Percentage LA | Percentage IFA | |
|---|---|---|---|---|
| Newly approved foster carers during 2020 to 2021 (14,645) | 9,875 | 4,770 | 67% | 33% |
| All approved foster carers as at 31 March 2021 (76,640) | 49,420 | 27,220 | 64% | 36% |
See Figure 11.
Data for Figure 12: Ethnicity of foster carers by sector, as at 31 March 2021 and approved during 2020 to 2021
| England at 31 March 2021 | LA at 31 March 2021 | IFA at 31 March 2021 | England approved during 2020-21 | LA approved during 2020-21 | IFA approved during 2020-21 | |
|---|---|---|---|---|---|---|
| White | 62,945 | 42,235 | 20,705 | 11,670 | 8,160 | 3,510 |
| Non-White ethnic group | 11,705 | 5,825 | 5,880 | 2,190 | 985 | 1,205 |
| Not known | 1,990 | 1,355 | 635 | 790 | 730 | 55 |
See Figure 12.
Data for Figure 13: Age of foster carers by status and sector, as at 31 March 2021
All approved foster carers
| Age | England | LA | IFA |
|---|---|---|---|
| 20 to 29 | 2% | 3% | 2% |
| 30 to 39 | 11% | 11% | 10% |
| 40 to 49 | 22% | 21% | 22% |
| 50 to 59 | 40% | 38% | 42% |
| 60+ | 26% | 27% | 24% |
Newly approved foster carers
| Age | England | LA | IFA |
|---|---|---|---|
| 20 to 29 | 7% | 8% | 5% |
| 30 to 39 | 20% | 21% | 19% |
| 40 to 49 | 27% | 26% | 30% |
| 50 to 59 | 31% | 30% | 35% |
| 60+ | 14% | 15% | 12% |
Deregistered foster carers
| Age | England | LA | IFA |
|---|---|---|---|
| 20 to 29 | 5% | 5% | 2% |
| 30 to 39 | 15% | 16% | 11% |
| 40 to 49 | 21% | 21% | 22% |
| 50 to 59 | 32% | 31% | 37% |
| 60+ | 27% | 26% | 28% |
See Figure 13.
Data for Figure 14: Fostering places by occupancy status and sector, on 31 March
IFA places
| Filled | Vacant | Not available | |
|---|---|---|---|
| 2017 | 16,725 | 7,640 | 6,525 |
| 2018 | 17,890 | 7,600 | 7,605 |
| 2019 | 19,050 | 6,990 | 8,045 |
| 2020 | 19,395 | 5,750 | 9,065 |
| 2021 | 20,065 | 6,475 | 8,285 |
LA places
| Filled | Vacant | Not available | |
|---|---|---|---|
| 2017 | 34,880 | 10,340 | 8,845 |
| 2018 | 35,315 | 9,550 | 8,040 |
| 2019 | 35,820 | 9,090 | 7,800 |
| 2020 | 34,190 | 7,390 | 7,490 |
| 2021 | 35,925 | 7,530 | 9,105 |
See Figure 14.
Data for Figure 15: Outcomes of investigations into allegations of abuse in 2020 to 2021 split by sector
| Percentage concerns resolved, no further action | Percentage continued monitoring for agreed period | Percentage concerns remained, refer to fostering panel for review | |
|---|---|---|---|
| LA (1,480) | 51% | 19% | 31% |
| IFA (1,100) | 58% | 11% | 31% |
See Figure 15.