Fostering in England 2016 to 2017: main findings
Published 29 March 2018

© Crown copyright 2018
This publication is licensed under the terms of the Open Government Licence v3.0 except where otherwise stated. To view this licence, visit nationalarchives.gov.uk/doc/open-government-licence/version/3 or write to the Information Policy Team, The National Archives, Kew, London TW9 4DU, or email: psi@nationalarchives.gov.uk.
Where we have identified any third party copyright information you will need to obtain permission from the copyright holders concerned.
This publication is available at https://www.gov.uk/government/statistics/fostering-in-england-1-april-2016-to-31-march-2017/fostering-in-england-2016-to-2017-main-findings
This release covers:
-
the numbers and profile of foster carers and foster places and placements, in both local authority (LA) and independent fostering agencies (IFA)
-
data relating to types of foster care, registrations, de-registrations, to fostered children, and a range of other subjects
-
the period between 1 April 2016 and 31 March 2017
There were fewer actual places for children because there were more places that were ‘not available’.
As at 31 March 2017, there were 83,930 approved fostering places, representing a 1% increase on the previous year (83,175). The proportion that were filled increased from 61% to 62% but the proportion that were ‘not available’ also increased, from 16% (13,000) to 18% (15,520).
The number of approved fostering households continued to decrease steadily.
There were 43,710 approved fostering households as at 31 March 2017, a 1% decrease from last year (44,320). The overall number has decreased by 2% since March 2014 (44,780).
The number of approved family and friends households continued to increase.
There was an 11% increase in the number of family and friends (including ‘connected person’) households from 5,985 on 31 March 2016 to 6,615 this year. This was the fourth consecutive year of increased numbers of this type of household.
More applications were considered this year but conversion of completed applications to approvals decreased.
There was an increase of 9% in applications considered during 2016 to 2017 compared with last year, from 11,460 to 12,455, with a similar proportion completed. However, the conversion rate of completed applications to approvals decreased from 57% to 49%.
A smaller proportion of foster carers than of fostered children were from minority ethnic groups.
As at 31 March 2017, 24% of fostered children were from minority ethnic groups, compared with 14% of all foster carers.
A smaller proportion of young people who turned 18 during the year were staying put.
The proportion of young people staying put with their foster family after turning 18 during the year decreased by eight percentage points in comparison with last year – 46% (1,570) stayed put in 2016 to 2017 compared with 54% (2,190) in 2015 to 2016. In LA foster families 52% of young people stayed put; in IFA foster families 38% stayed put.
Children with at least one unplanned ending were more likely to have persistent school absence.
Thirteen percent of children who experienced at least one unplanned ending had persistent school absence in comparison with 5% of children with no unplanned endings. The rate of persistent school absence increased to 19% for children who experienced at least one unplanned ending and at least one educational placement change.
Introduction
This statistical release covers local authority (LA) fostering agencies and independent fostering agencies (IFA) in England in the year 1 April 2016 to 31 March 2017. It includes data about fostered children, foster carers, recruitment, and capacity of providers. Fostered children represented nearly three-quarters of all children in care, but less than a percent of all children in England.
This release uses data returned to Ofsted by the agencies, and so may reflect both changes that have happened in the sector and changes that have happened in how this is being recorded and reported by the agencies. The data collected is unique to Ofsted: it helps inform fostering policy and serves as a point of reference for all fostering agencies in the country.
As the data collection does not indicate the location of foster carers and children, IFAs cannot be neatly attached to regions: therefore, any regional analysis refers only to LA fostering agencies within that region.
Main findings
The following sections on places, households, recruitment and carers, unless specified otherwise, include analysis of mainstream fostering households and foster carers only. The analysis of family and friends households, and short break households is provided at the end of this chapter.
Fostering capacity[footnote 2]
The number of approved foster places continues its general trend of increasing. However, while the number of places did increase, the number of places that were unavailable for children to be placed into increased at a faster rate. This in effect meant that there were fewer places for children who needed foster care than last year.
In addition, the number of children in care increased at a faster rate than the number of fostering places which may suggest the fostering sector is struggling to keep up with the increasing demand.[footnote 3] This is a concern because fewer places being available has the potential to lead to children being placed further away or in placements that do not meet all of their needs. Any attempts the sector makes to increase the number of places need to bear this last fact in mind because recruitment of carers can often focus solely on numbers as opposed to meeting any need deficit of the children in their care not already placed.[footnote 4]
In total, there were 83,930 approved fostering places in England as at 31 March 2017, a 1% increase from the same point in the previous year (83,175).
The number of approved places increased by 2% in independent fostering agencies (IFA) (from 31,510 to 32,235), a change from last year’s decrease in places. The number remained static in LAs.
Figure 1: Occupancy trend as at 31 March
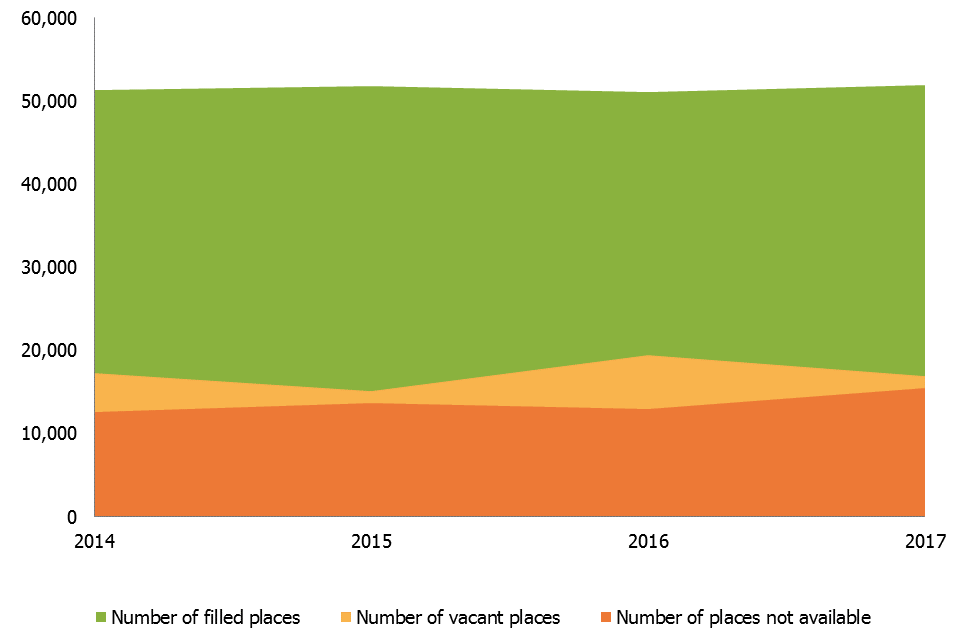
Figure 1
As at 31 March 2017, 62% of fostering places were filled (51,935) and 20% were vacant (16,875).[footnote 5] [footnote 6] The remaining 18% were ‘not available’ (15,520).[footnote 7] [footnote 8]
The percentage of places that were filled increased slightly from 61% in 2016 to 62% in 2017.
Having reached a high in 2016, the number and proportion of vacant places reduced in 2017 to 16,875 or 20% (19,480 or 23% in 2016).
The number and proportion of places ‘not available’ increased from 13,000 (16%) in 2016 to 15,520 (18%) in 2017.
This meant that, despite the total number of approved fostering places increasing, the number of places available for children to be placed into actually decreased by 3%. There were 70,175 available places as at 31 March 2016 which reduced to 68,410 this year.
Table 1: Reasons why fostering places are unavailable to be used
| England | LA | IFA | |
|---|---|---|---|
| Reason for not available place | % of not available places | % of not available places | % of not available places |
| Carer(s) taking a break/pending resignation | 24% | 28% | 18% |
| Unknown carer reasons | 19% | 17% | 20% |
| Needs of child not otherwise stated | 17% | 12% | 23% |
| Only available if sibling group placed | 15% | 12% | 19% |
| Staying Put | 8% | 9% | 6% |
| Reason unknown/other | 7% | 7% | 7% |
| Carer(s) under investigation | 4% | 5% | 3% |
| Reserved for short breaks placement | 4% | 6% | 1% |
| Reserved for pending placement | 3% | 4% | 2% |
| Reserved for shared care placement | 1% | 1% | 0% |
This year, Ofsted collected data on the reasons for places being unavailable to be used. As this had not been collected previously, it is not possible to draw any conclusions as to the case of the increase in ‘not available’ places.
While there were more ‘not available’ places in the LA sector (8,590), they made up a smaller proportion of all LA places (17%) than the equivalents in IFAs (6,930, or 21%). The 4 main reasons for ‘not available’ places overall were also the most prevalent in each sector.
The recent Commons Education Select Committee report, ‘Fostering’, noted that staying put ‘reduces the number of available places, further impacting capacity in the sector’. However, young people staying put made up only 8% of ‘not available’ places and the number actually fell this year. While it is not a large contributor to the increase in ‘not available’ places, it undoubtedly has an impact on the availability of places for children.
Fostering households
Section overview
The number of households and therefore the number of carers continued to steadily decrease, driven by the fall in mainstream households.[footnote 9] This would have been the biggest decrease in households in recent years but for the large increase in family and friends households. However, if the decrease in mainstream households continues, along with a continued increase in children in care, there is a risk that the sector will reach a point where there are not enough suitable places available.
Although falling in number, mainstream households are on average looking after more children, as seen by the small increase in approved foster places. This change could though be reducing the diversity or choice of carers with whom to place children and young people.
Short break households decreased by almost a third in the year.[footnote 10] This was an acceleration of the already steep decline in the number of these households seen over previous years. These carers offer a vital source of short term help to families and their children. The decrease in numbers increases the risk of a child being unable to be placed with a family who meet their needs and may even be placed outside of fostering in a residential setting.
Figure 2: Fostering households as at 31 March 2017 by type

Figure 2
There were 43,710 approved fostering households as at 31 March 2017, a 1% decrease from the previous year (44,320). This continued the trend of slight year-on-year decreases since March 2014.
This trend was reflected in mainstream households, which had decreased each year since March 2014, including by 2% from last year (from 36,485 to 35,820).
The number of family and friends households, however, rose to 6,615, representing an increase in family and friends households of 11% from 2016 (5,985). [footnote 11]
The use of family and friends households is in line with the expectations on LA to place children with family and friends wherever possible. The increase in their number has played a significant part in meeting the demands set by the rising number of children in care and a reducing pool of available mainstream foster placements.
As at 31 March 2017, there were 1,270 households that exclusively provided short breaks, a decrease of over 30% from 1,850 in 2016. While the number of short break households has decreased each year since March 2013 (2,725), the decrease seen this year represented by far the largest reduction in the last 4 years.
Capacity per household
The highest proportion of mainstream households (39%) were approved for 2 children (14,050). There has been a small shift towards larger households compared with the previous year, with an increase in those approved for 3 or more children (from 31% to 33%) and a decrease in those approved for one child (from 29% to 27%).
Figure 3: Capacity of mainstream fostering households as at 31 March 2017 by sector

Figure 3
IFAs were again more likely to have larger households than LAs: 42% of IFA households were approved for 3 or more children (6,030 households) compared with 28% of LA households (5,910 households). Both IFAs and LAs saw an increase from the previous year.
Of the newly approved households in 2016 to 2017, there was very little variation in the number of IFA households approved for one (33%), 2 (36%), or 3 or more (31%) children. Last year, 25% of IFA approvals in year were for larger households of 3 or more children. In the LA sector, more households were approved to look after smaller numbers of children – 48% of households approved in year were for one child compared with 15% for 3 or more children. [footnote 12]
Recruitment and retention
Section overview
Initial enquiries increased by more than 10% in the year. However, applications considered increased by far less, which suggests further work is needed to ensure that those initial enquiries result in applications to become foster carers.
The year saw a reversal of the 2-year trend of falling applications, although the amount received was still far below the figure from 2 years ago. It was nonetheless a welcome change. The decrease in the number of applications leading to approval however, despite the increase in applications, is concerning. The reduced conversion rate was driven by a large decrease in LA approvals. For the first time, IFAs approved a larger proportion of applications than LAs.
Recruitment
There were 114,425 initial enquiries in 2016 to 2017, representing a substantial increase (12%) on the previous year (101,795 in 2015 to 2016). This followed 2 consecutive years of falling numbers of initial enquiries.
This increase was attributable to the IFA sector, which rose by 20%: from 65,645 in 2015 to 2016 to 78,585 in 2016 to 2017. The LA sector actually saw a small decrease from 36,150 to 35,840 (1%).
The number of applications rose (9%), albeit not to the levels seen prior to a large fall last year. Agencies reported 12,455 applications in 2016 to 2017, compared with 11,460 in 2015 to 2016. [footnote 13]
The conversion rate of initial enquiries to applications was very different in the 2 sectors. As last year, 11% of initial enquiries nationally converted to applications. However, 18% of initial enquiries in the LA sector converted to applications compared with just 8% in IFAs. While IFAs have attracted more initial enquiries than LAs each year for the last 5 years, accentuated by the large increase this year, they have not been as efficient at converting these to applications.
As well as 4,375 mainstream fostering households approved in 2016 to 2017, agencies also approved 4,775 family and friends households and 170 short break households. This amounted to 9,320 newly-approved households in the year.
Application outcomes
Figure 4: Applications considered and completed in year as at 31 March
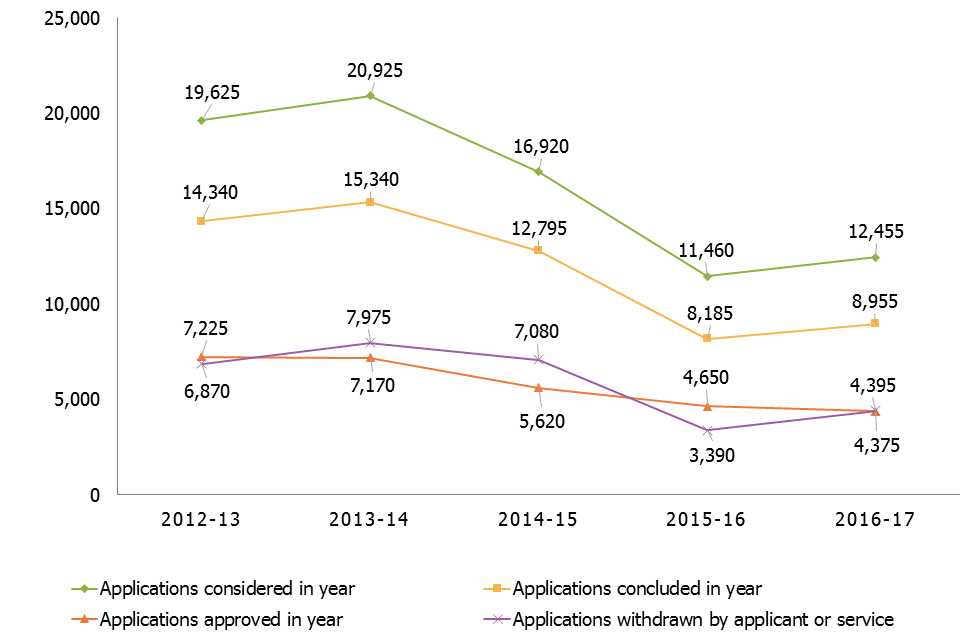
Figure 4
The number of applications that were considered and the number completed during the year increased from last year. These increases ended the long term trend of decreasing numbers in all areas. The only area that continued the long term decline was applications approved.
At 72%, the completion rate was just one percentage point higher than last year.
A large reduction in LA approval rates, from 57% to 45%, drove a national reduction of 8 percentage points compared with last year. Although, at 49% it is still in line with the long term trend. This year represented the first time in at least 5 years that the approval rate was higher for IFAs (53%) than it was for LAs (45%).
The proportion of completed applications withdrawn or rejected in the LA sector was 25% compared with 12% in 2015 to 2016. This meant an England figure of 21% which was in line with 2013 to 2014 and 2014 to 2015, suggesting the drop in 2015 to 2016 may have been an anomaly.
The proportion of applications withdrawn by applicants remained at 30% (2,695 applications).
De-registration and retention of fostering households
The nature of this year’s collection has meant that it is not always possible for Ofsted to identify the household type of some de-registered households. The following analysis, therefore, focuses on the de-registrations and retention of all household types together.
Overall, there were 8,275 de-registrations in 2016 to 2017, with the majority (73%) in the LA sector. This meant that there were more approved households in 2016 to 2017 (9,320) than there were de-registrations. [footnote 14]
The majority of de-registrations (4,935, or 60%) were initiated by the foster carer, with 2,485 (30%) initiated by the fostering service. The remaining 10% of de-registrations were due to either the household transferring to an IFA (410) or to an LA (270), or for an unknown reason (180).
Figure 5: De-registrations of all households by reason and sector, 2016 to 2017
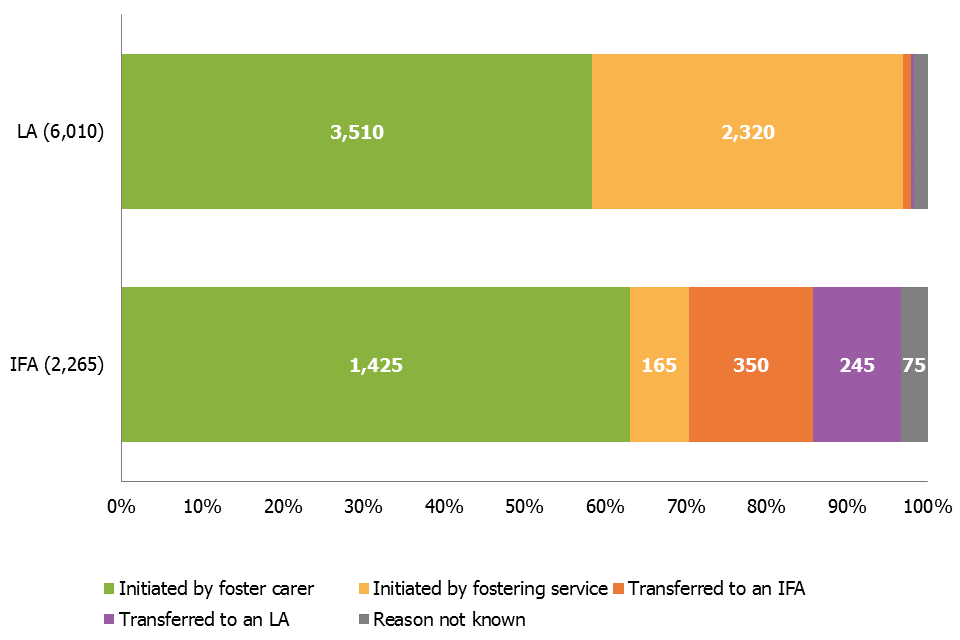
Figure 5
Mirroring the national picture, in the LA sector the majority of de-registrations (58%) were initiated by the foster carers themselves, with those initiated by the service making up the next biggest cohort (39%).
However, the reasons for de-registrations were quite different in IFAs. While the majority (63%) of de-registrations were initiated by foster carers, only 7% were initiated by the service. At 7%, this was less than the proportion that transferred to another IFA (16%) or to an LA (11%).
On average, households were approved for 4.1 years before de-registration.
Types of placements [footnote 15]
Table 2: Types of placements offered by mainstream fostering households as their primary offer [footnote 16]
| England | England | LA | LA | IFA | IFA | |
|---|---|---|---|---|---|---|
| Number of households | Percentage | Number of households | Percentage | Number of households | Percentage | |
| Short term | 18,115 | 51% | 12,470 | 59% | 5,645 | 40% |
| Long term/permanent | 15,270 | 43% | 7,925 | 37% | 7,345 | 52% |
| Multi-dimensional foster care treatment | 665 | 2% | 140 | 1% | 525 | 4% |
| Other | 370 | 1% | 210 | 1% | 160 | 1% |
| Parent and child | 365 | 1% | 150 | 1% | 215 | 2% |
| Short breaks | 340 | 1% | 270 | 1% | 70 | 0% |
| Emergency | 200 | 1% | 80 | 0% | 120 | 1% |
| Remand | 25 | 0% | 10 | 0% | 15 | 0% |
The proportions of all mainstream fostering households active at 31 March 2017 offering the various placement types as their primary designation were almost identical to the previous year.
Sixty-nine percent of mainstream fostering households offering short term placements as a primary offer were in the LA sector (12,470), as were 52% of households offering either long term or permanent placements (7,925).
However, while the proportion of those households offering short term placements as a primary offer being in the LA sector increased from the previous year (12,555 or 66% as at 31 March 2016), both the number and proportion of households offering either long-term or permanent placements as a primary offer decreased (8,280 or 55% as at 31 March 2016).
Looking at the placement offer in each sector, 52% of all IFA mainstream households (an increase of 4 percentage points) offered permanent or long term placements in comparison with 37% of LA households (a decrease of one percentage point).
Seventy-nine percent of mainstream households that provided multi-dimensional foster care placements as a primary offer were in the IFA sector (525).
Family and friends households
Between 2013 and 2016, Ofsted collected data on “connected person” households (those temporarily approved to provide foster care for particular children that they know for a very short time) as distinct from family and friends households. In 2016 to 2017, however, these 2 household types were recorded together as family and friends. For the purpose of comparison, historical numbers of family and friends households combines the 2 groups.
The agencies reported that there were 6,615 family and friends households as at 31 March 2017: an increase of 11% from 5,985 on 31 March 2016. This was a larger proportional increase than in either of the previous 2 years.
These households made up 15% of all active fostering households as at 31 March 2017, compared with 13% last year. The use of family and friends households is in line with the expectations on LA to place children with family and friends wherever possible. The increase in their number has played a significant part in meeting the demands set by the rising number of children in care and a reducing pool of available mainstream foster placements.
Family and friends households were made up of 10,650 foster carers, 84% of whom were White and 8% of whom were from minority ethnic groups.[footnote 18] These proportions were consistent with last year.
The agencies reported 4,775 households approved in 2016 to 2017. This was a 44% increase on 2015 to 2016 (3,325 households approved), which itself was an increase of 42% on 2014 to 2015 (2,335 households approved).
Short break households
The agencies reported a 31% reduction in households that were approved to provide short breaks only, from 1,850 last year to 1,270 as at 31 March 2017. Despite the overall decrease in short break households, the number registered with IFAs has increased.
The majority of short breaks households (79% or 1,005) were in the LA sector with 21% (265) in IFAs: a change from the last year when just 11% of short breaks households were registered with IFAs.
The number of short breaks carers decreased for the fourth consecutive year, with a decrease of almost a third from last year representing the largest reduction in that time period (from 2,795 in 2016 to 1,935 in 2017).
Of the short break foster carers 90% were White and 9% were from minority ethnic groups.[footnote 19] Similarly, of newly approved carers in 2016 to 2017, 90% were White and 10% were from minority ethnic groups.
Foster carers
Section overview
As with households, the number of mainstream foster carers continued its long-term decline this year. In fact, the numbers decreased by a greater proportion than in previous years.
The ethnicity data shows that there continues to be a disparity between the proportions of foster carers who are from minority ethnic backgrounds and the proportion of fostered children who are from minority ethnic backgrounds. A lower proportion of carers than children and young people are from minority ethnic backgrounds. The proportion of newly approved carers from minority ethnic backgrounds this year was higher than the proportion of already approved carers from these backgrounds, which is an encouraging sign that agencies have had some success in recruiting from a wider range of backgrounds.
Approved foster carers
The number of approved mainstream foster carers continued the trend of the previous 2 years and decreased compared with the previous year. The number decreased from 62,365 at 31 March 2016 to 61,415 at 31 March 2017.
The number of foster carers in family and friends households, however, rose markedly from 9,525 to 10,650 (12%).
The number of foster carers providing short breaks only has been in decline since at least 31 March 2013, and this year saw the largest reduction (31%) from the previous year (2,795 to 1,935). This is due to changes in the number of carers in the LA sector that reduced from 2,500 to 1,530 (39% decrease). The number of foster carers in IFAs providing short breaks only actually increased, from 295 to 405 (37% increase).
Ethnicity
Figure 6: Ethnicity of mainstream foster carers by sector, as at 31 March 2017 and approved during 2016 to 2017
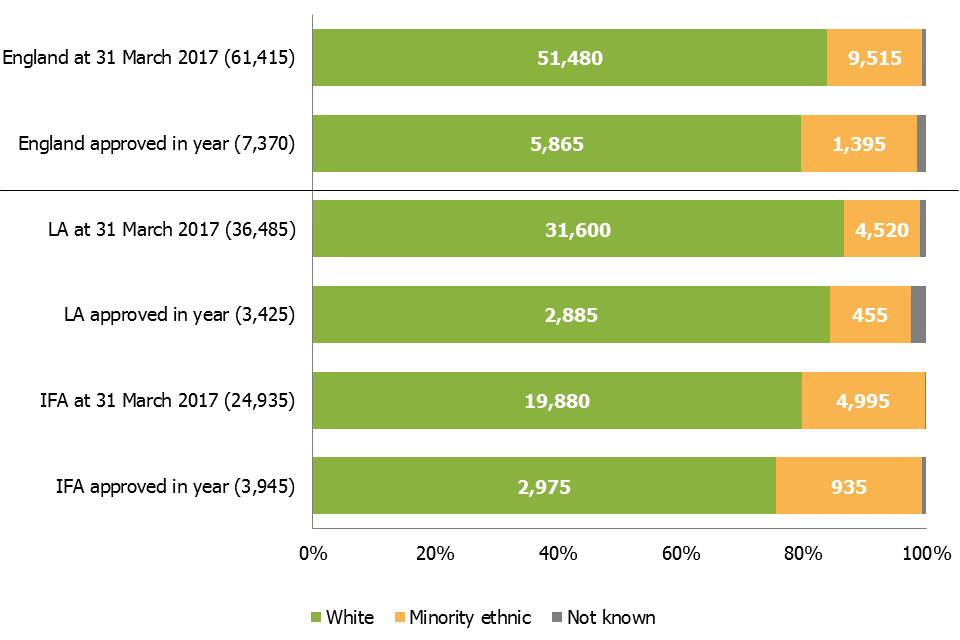
Figure 6
Most mainstream foster carers were White: 84%, as last year, slightly below the national level among the adult (aged 25 and older) population in the 2011 census (88%).
Similar to last year, there was a greater proportion of foster carers from minority ethnic groups in IFAs than in the LA sector. In IFAs, 80% of mainstream foster carers were White and 20% were from minority ethnic groups. In LAs, however, 87% were White and 12% were from minority ethnic groups.[footnote 20]
Five LAs reported having no mainstream foster carers from minority ethnic groups but all 5 reported placing minority ethnic children with their fostering service.[footnote 21]
Ofsted collected the ethnicity of all foster carers, including family and friends, and short break carers, and fostered children. As mentioned later in this report, as at 31 March 2017, 24% of fostered children were from minority ethnic groups, compared with 14% of all foster carers. This perhaps highlights the challenges the sector might sometimes face in finding suitable placements.[footnote 22]
Of those mainstream foster carers approved in 2016 to 2017, 80% were White and 19% were from minority ethnic groups.[footnote 23]
In the LA sector, 84% of newly approved carers were White, in comparison with 75% in IFAs. Conversely, 13% were from minority ethnic groups compared with 24% in IFAs. The proportion of newly approved carers from minority ethnic groups was larger than the proportion of all approved mainstream carers from minority ethnic groups. This suggests that agencies are trying to address this issue.
Children and young people
Number of children fostered [footnote 24]
In total, agencies reported 52,005 children and young people in placement on 31 March 2017; this is a small increase compared with last year, 200 children.[footnote 25] [footnote 26] [footnote 27]
Two thirds of these were in LA fostering places (34,410), and the remainder (17,595) were placed through IFAs, in line with 2016.
Characteristics of children
Section overview
There was a higher proportion of fostered children from minority ethnic backgrounds than there were foster carers from minority ethnic backgrounds. Although agencies as a whole are increasing the proportions of approved carers from minority ethnic backgrounds the gap between the two is still of concern. In particular LA agencies, with whose carers two thirds of fostered children are placed, are still recruiting a considerably higher proportion of White carers each year than IFAs. This means that there continues to be a risk that some children may be placed in households or with carers who are not able to meet all their needs.
Ethnicity
White children accounted for 76% of all fostered children, a slight fall from 77% in 2016. Twenty-four percent of children belonged to minority ethnic groups; this shows a 2% increase compared with last year.
Children from minority ethnic groups were therefore very slightly under-represented compared with the DfE’s figures for all children in care (25% of whom are from minority ethnic groups), and slightly over-represented compared with the national figures (according to the 2011 census, 21% of children in England are from minority ethnic groups).
Figure 7: Children fostered, by ethnicity
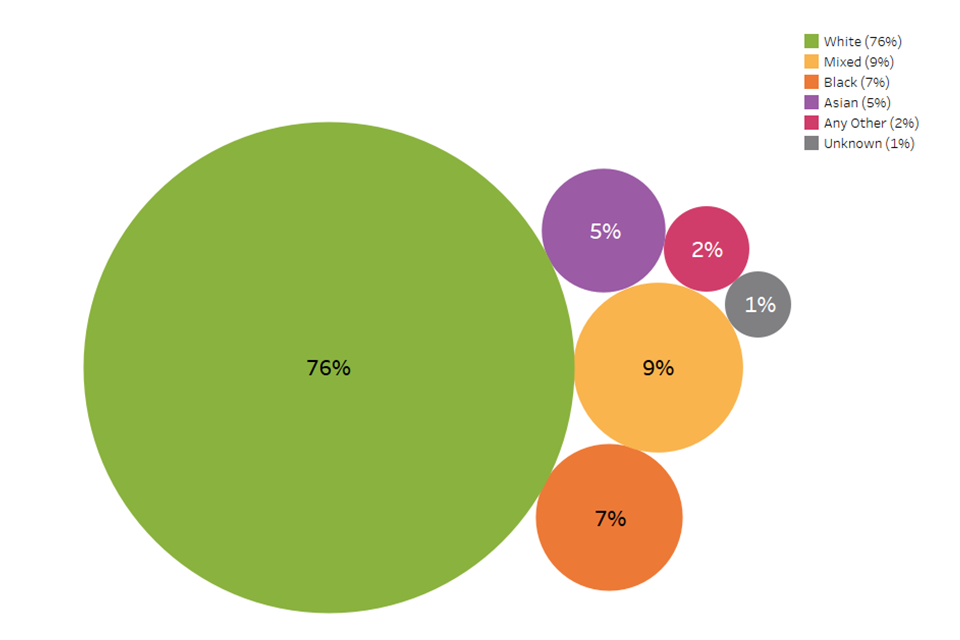
Figure 7
Disability
Just under 10% of children were reported to be disabled. Although the percentage is in line with 2016, the number is showing a decrease since last year with 4,855 in 2016 and 4,560 in 2017.
IFAs reported slightly higher percentages of disabled children (10% or 1,785) compared with 8% (2,775) for LAs.
Children’s experiences
Section overview
While agencies try to avoid children and young people experiencing unplanned endings, they do still happen for a number of usually unavoidable reasons. However, what is of concern is that 1 in 5 children who were subject to an unplanned ending were moved within 24 hours of the decision to end the placement. One in 4 children from minority ethnic backgrounds who were subject of an unplanned ending moved within 24 hours. Such an abrupt move almost inevitably does not give children or their carers time to prepare for the change and as such children are exposed to another major disruption to their lives.
The ‘staying put’ initiative was introduced to give stability and support to young people when they turned 18. However, young people were less likely this year compared with last to stay put with their foster carers when they turned 18. In particular, the proportion of young people staying put in IFAs fell to its lowest point since 2013.
Children who experience an unplanned placement ending were more than twice as likely to have persistent absence from education, as were children who had an educational placement change. These figures show the major impact a lack of stability can have on children’s education.
Placement stability
One in 20 children experienced unplanned endings and stayed with the same agency.[footnote 28] The majority of these children (82% or 1,945 children) were placed with LA fostering agencies at the time of the unplanned ending.
In total, these 2,375 children experienced 2,765 unplanned endings.
Of all 2,375 children with unplanned endings, 22% of children (525) experienced at least one move within 24 hours of the decision to end the placement early.
This links to the National Fostering Stocktake evidence report (page 8) which makes reference to the abruptness of some placement endings not giving adequate preparation to the children or foster carers.
In 2017, White children were slightly less likely than children from minority ethnic groups to move within 24 hours of the unplanned ending: 21% (395 of 1,860) compared with 25% (125 of 495).
Staying put[footnote 29]
Of the 3,430 children who turned 18 during 2016 to 2017, 46% (1,570) were still living with their former foster carers in 2016 to 2017, a decrease of 8 percentage points from 2016 (54%, 2,190). This is in line with the Education Select Committee report on fostering, which states that many young people are missing out on the staying put opportunity due to a lack of clarity and consistency around its implementation. The recent independent Foster Care in England report (page 120) also refers to the staying put arrangement and describes ‘a lack of information regarding [the] policy’.
The percentage of young people who “stayed put” with IFA carers decreased by 12 percentage points from the previous year and is at its lowest since 2013. This widens the percentage gap between LAs (52%) and IFAs (38%) compared with previous years.
Figure 8: Care leavers who remained with former foster carers after becoming 18, by sector, 2013 to 1017

Figure 8
Education
Figure 9: Percentage of fostered children experiencing at least one educational placement change, by sector as at 31 March 2017

Figure 9
We estimate that 32,765 fostered children were of school age, as at 31 March 2017. [footnote 30]
Of these 32,765 school-aged fostered children as at 31 March 2017, a total of 2,070 children experienced at least one educational placement change as a result of a fostering placement change during 2016 to 2017; this shows a decrease of 10% compared with last year.
Of the school-aged children in placement at 31 March 2017, 2,790 (9%) were persistently absent from education. In addition 2,155 had no educational arrangements during 2016 to 2017 and 2,500 attended alternative educational provisions. [footnote 31]
Children who experienced educational placement changes were also more likely to have persistent educational absence (12%) than children who did not experience educational placement changes (5%). This is also higher than the percentage of all fostered school-aged children who have persistent absence (9%), as well as the DfE’s national percentage of persistent absence for all school-aged children (10%).
Children in IFA placements make up a higher percentage of children experiencing an educational placement change (47%) than they do of all children in foster care generally (34%).
The majority of children with persistent absence were placed with LA foster carers (2,365, 85%). A higher percentage of children with no educational arrangements in year were placed with IFA carers (1,380, 64%).
A higher percentage of children who had at least one unplanned ending also had a change of educational placement (10%) compared with children with no unplanned endings who had a change of educational placements (4%).
Figure 10: Persistent absence linked to unplanned endings.
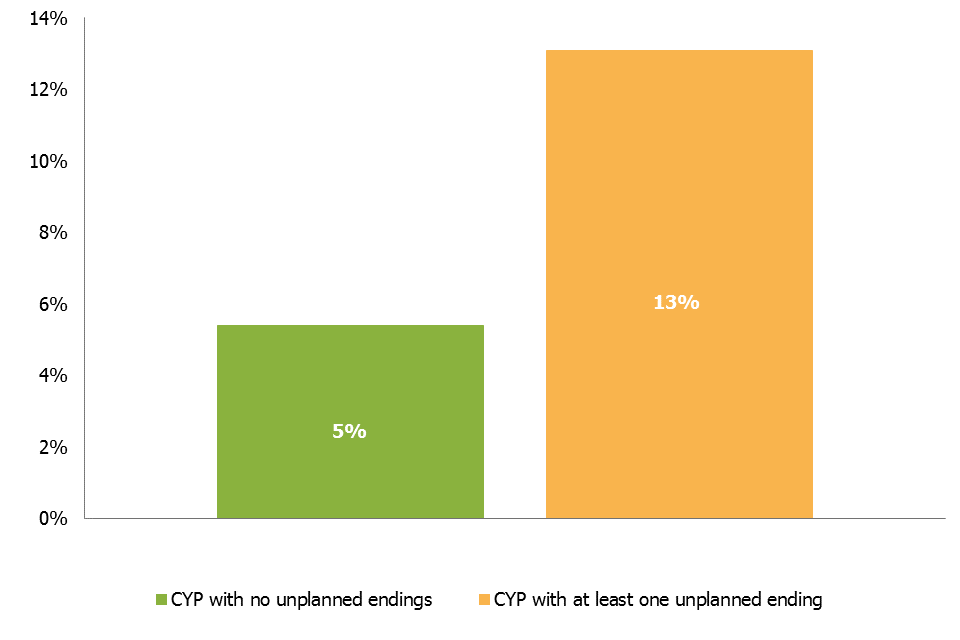
Figure 10
Children who experienced at least one unplanned ending had a higher rate of persistent absence (13%) compared with the children who did not experience unplanned endings (5%). This lends weight to the recent Education Select Committee report’s statement, which refers to instability as a factor in the increase in rate of absence from school. Persistent absence figures for children with unplanned endings are higher than the percentage of fostered school-aged children who have persistent absence (9%).
Restraint
In 2016 to 2017, there were 1,280 incidents of physical restraint, which is a 23% increase compared with last year.[footnote 32] The number of children affected (650) is also higher than last year: the average number of incidents per child who experienced restraint increased from 1.8 to 2.0.
The majority of incidents of physical restraint still took place within the IFA sector (76% of all instances); this may be because children with higher levels of needs are most likely to be placed with IFAs.
Safeguarding
Section overview
Children and young people who go missing from foster care should always be offered a return home interview (RHI) on their return. [footnote 33] [footnote 34] Last year just under half did not have a RHI. Therefore, even though a proportion of missing children and young people may have refused an RHI and the figures represent a slight improvement on the previous year, the low number of completed RHIs means that opportunities to fully understand the reasons why children go missing and help them stay safe are restricted.
Children and young people at risk of child sexual exploitation were far more likely to go missing than those not deemed at risk of child sexual exploitation. Almost half of children and young people at risk of child sexual exploitation went missing, compared with one in 20 of children and young people not at risk of child sexual exploitation.
Child sexual exploitation
There were 1,530 (3%) children and young people placed in foster care as at 31 March 2017 considered to be at risk of child sexual exploitation and 420 (1%) considered to be subject to child sexual exploitation. Although the percentages are in line with 2016, the numbers of children reported to be at risk or subject to child sexual exploitation have slightly decreased.
Of the children at risk of child sexual exploitation, 55% were placed with LAs and 45% were placed with IFAs.
Sixteen LAs reported that, of the children placed with their own approved foster carers on 31 March 2017, none were known to be either at risk of or subject to child sexual exploitation. [footnote 35]
Children going missing
In 2016 to 2017, a total of 3,230 children (6% of all fostered children) went missing, a total of 12,210 times, which equated to an average of 4 missing incidents per missing child, in line with 2016. [footnote 36]
The percentage of children going missing across England and in IFA placements has not changed from 2016, while the percentage in LA placements has slightly increased from 5% to 6%.
Black and Black British children were slightly over-represented in missing figures compared with all fostered children: 7% of fostered children were Black/Black British, but accounted for 9% of all missing children.
Figure 11: Children missing by reason, 2015 to 2017
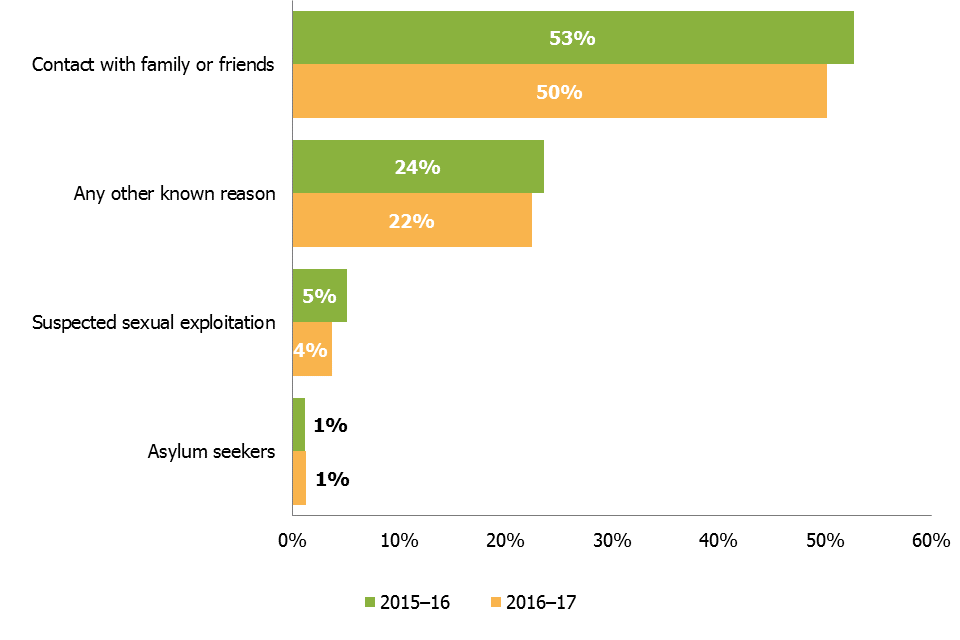
Figure 11
Half of all missing children (1,620) went missing primarily due to contact, including avoiding contact, with family and friends. Although this is a slight decrease compared with last year (50% compared with 53%), this is still the most common reason for children going missing.
The percentage of children going missing for unknown reasons has increased by 6 percentage points since last year, from 13% to 19%.
The majority of those missing (84% or 2,710) were missing for less than one week, in line with 2016.
The percentage of children missing for a total period of less than 24 hours is very similar across England as well as LAs and IFAs: between 52% and 54%.
Of the 12,210 missing incidents, 40% (4,850) were followed by an RHI, in line with 2016.
These RHI were conducted for 1,810 children who went missing: around 56% of the 3,230 total missing children.
Those children who had an RHI had an average of 2.7 per child, also in line with 2016.
Figure 12: Children going missing with no RHI, by sector as at 31 March 2017

Figure 12
Fifty-six per cent (700 out of 1,260) of children who went missing at least once and had no RHI were placed with IFAs compared with 44% (1,420) nationally.
There were 5 LAs that reported that no RHIs were provided for children who went missing at least once as at 31 March 2017. [footnote 37]
Missing children, child sexual exploitation and unplanned endings
Not all children at risk of sexual exploitation went missing during the year. Some, though, having gone missing in the previous year, will have been identified as being at risk because they went missing.
Table 3: Child sexual exploitation, missing and unplanned endings.
| CYP at risk of CSE | CYP not at risk of CSE | |
|---|---|---|
| Missing | 44% | 5% |
| Not missing | 56% | 95% |
| Missing with RHI | 68% | 53% |
| CYP who experienced at least one unplanned ending with educational placement change | 17% | 10% |
| CYP who experienced at least one unplanned ending with persistent absence | 33% | 11% |
Forty-four percent of children at risk of child sexual exploitation had at least one missing incident, compared with 5% of children not at risk.
A higher percentage of children at risk of child sexual exploitation who also went missing who had at least one RHI (68%), compared to children not at risk of child sexual exploitation who went missing (53%).
A higher percentage of children with unplanned endings who are at risk of child sexual exploitation are likely to have at least one educational placement change (17%) compared with children not at risk of child sexual exploitation (10%).
Allegations of abuse [footnote 38]
During 2016 to 2017, there were 2,525 allegations made against foster carers. Just under two thirds of these (1,665) were made by fostered children.
Figure 13: Allegations and number of those by foster children against foster carers

Figure 13
The total number of allegations increased by 3% (from 2,450 to 2,525) from 2016. There was also a 7% increase in allegations against foster carers by fostered children (from 1,550 to 1,665).
Although the split of allegations by sector remained the same compared with 2016, the IFA sector saw a 10% increase (from 690 to 760) with more children making allegations against foster carers.
Over half of all allegations were related to physical abuse, with allegations of sexual abuse being least common, much the same as in 2016.
In the same way as last year, the outcome of continued monitoring was more common for LAs (18%) than for IFAs (12%).
Forty-seven per cent of all LA investigations took less than 21 working days compared with 55% of those conducted by IFAs; for IFAs, this is a decrease of 4 percentage points (from 59% in 2016).
Reasons for children and young people leaving fostering agencies
For the first time in 2016 to 2017, data about reasons for leaving fostering agencies has been collected.
Figure 14: Reasons children and young people left a fostering agency’s care

Figure 14
The largest proportion of children and young people who left a foster agency’s care left due to no longer being looked after (41%). [footnote 39]
Of the 2,770 children who were transferred to an LA placement, 2,650 (96%) moved from IFAs. This could be LAs choosing to move children back to in-house carers after a placement in an IFA came to an end.
Out of the 2,890 children who were transferred to an IFA placement, 1,870 (65%) came from LA agencies. This may be linked to LAs placing children in IFAs in order to meet their more complex or specialist needs.
Revisions to previous release
This is the first release of this data for the period 1 April 2016 to 31 March 2017. This data is fixed point in time data and will not be revised.
Notes
The Fostering in England 1 April 2016 to 31 March 2017 page also includes:
- aggregated data at England, total LA, total IFA levels and at individual LA and regional total levels in Excel format
- an accompanying quality and methodology report, which provides an explanation about key uses of this data, further contextual information, the arrangements for quality assurance and information about strengths and limitations of the statistics
Glossary
A full definition of the terms below is available within the Dataset Excel file.
Alternative educational provision
This includes provisions outside of long-term and special schools. This includes: provision directly managed by a local authority; pupil referral units; hospital schools; hospital and home teaching services; tuition centres; e-learning centres; and provision that is brokered or arranged by a local authority, school or group of schools, such as placements in FE colleges, extended work experience, projects provided by the voluntary or private sector or multi-agency initiatives.
Approved foster carers
These are individual foster carers who were currently approved by a fostering service as at 31 March 2016.
At risk (of child sexual exploitation)
This is any child where there is a concern that they will become subject to child sexual exploitation at some point, but this exploitation has not yet happened. The risk does not need to have been confirmed by other professionals.
Child sexual exploitation
A form of child sexual abuse occurring when an individual or group takes advantage of an imbalance in power to coerce a child into sexual activity in exchange for something the victim needs or wants, or to increase the status or financial advantage of the perpetrator.
Disabled
Section 6 of the Equality Act 2010 defines a disabled person as someone who has a physical or mental impairment which has a substantial and long term adverse effect on his or her ability to carry out normal day to day activities.
Education placement change
This refers to a change in educational placement, which came about because of moving to a new fostering household between 1 April 2016 and 31 March 2017.
Exemption
An exemption is required in the specific situation in which a foster carer is asked to look after more than 3 children who are not all part of a sibling group, under sections 63(12) and Schedule 7(2) of the Children Act 1989.
Family and friends foster care
Foster care provided for a looked after child(ren) by a relative or friend who is approved by a fostering service to foster that particular child(ren).
Fostering agencies
Fostering agencies recruit, prepare, assess, train and support foster carers; they can be local authority, or independent (private companies or charities).
Foster places
Foster places refers to the total number of places that foster carers are approved to provide, whether occupied or not; it relates to the capacity of foster care in England.
Foster placements
Foster placements refers to arrangements made for children to be looked after, in this context living with foster carers.
Missing
In this context refers to children up to the age of 18 who have run away from their foster placement, have been abducted, or whose whereabouts are unknown; it does not include unauthorised absence where a child’s whereabouts are (thought to be) known.
Multi-dimensional treatment foster care (MTFC) under the Department for Education scheme
MTFC is a highly structured behavioural programme, providing wraparound multi-professional support and including daily communication between carers, the team and school aimed at diverting young people from anti-social peers.
No educational arrangements
This refers to children in foster care who have no mainstream, special school or alternative educational provision. The data needs to cover the financial year April-March (not the academic year) and is only applicable when the child/young person is in a foster placement.
No longer looked after
It refers to children who have ceased to be looked after (in care). They might have returned to live with their parents or other family member, or become subject to a Special Guardianship Order, or been adopted.
‘Not available’ places
These are foster care places in which no children are currently placed, but which are ‘not available’ for a child to be placed in. Among other reasons, this might be because a household is approved to provide additional places only to siblings and there are no siblings in placement, a former foster child is still living with the family under Staying Put arrangements after turning 18, or any placed children have been removed, or placements cannot be made, after an allegation against the carer(s).
Persistent absence from school
‘Persistent absence’ from school is defined by the Department for Education. Persistent absentees are defined as having an overall absence rate of around 15 per cent or more. As an example, this would equate to 46 or more sessions (23 days) of absence (authorised and unauthorised) during the first five half terms of the academic year. www.gov.uk/government/publications/absence-statistics-guide
Physical restraint
Stopping a foster child/young person from doing something they appear to want to do by physical means including to stop them hurting themselves.
Return home interview
An in-depth discussion of their reasons for running away offered to all children who go missing, by an independent person, usually the local authority, to try to prevent further missing episodes.
Staying put
A duty on LAs to facilitate and support fostered young people remaining with their former foster carers, if this is what both parties want.
Subject to (child sexual exploitation)
This refers to any child considered to have experienced child sexual exploitation. This does not have to have been confirmed by other professionals.
Unplanned endings
This is a placement which ended earlier than the original planned end date; unplanned endings within 24 hours refers to when a child moves within 24 hours of the decision to end the placement early.
Withdrawn
Applications which are stopped by the applicant or by the service (after a decision prior to panel that the applicant is not suitable).
Further information
If you have any comments or feedback on this publication, please contact Adam King on 03000 130020 or socialcaredata@ofsted.gov.uk
Acknowledgements
Thanks to the following for their contribution to this statistical release: Nilly El Khatib, Jeremy Honeywill and Richard Jones.
-
The 2016 to 2017 fostering dataset collection asked for data on all fostering households registered with the agency during 2016 to 2017 and the number of children placed in each household on 31 March 2017. This analysis includes all household types apart from short breaks only to make it comparable with last year’s figures. ↩
-
Throughout the document where children in care are referred to this is the same group of children that are also referred to as children looked after. ↩
-
‘Fostering’, Commons Education Select Committee, (Fostering, Valuing Care, Capacity, paragraphs 93-95), 2017; and ‘National fostering stocktake: call for evidence report’, DfE, page 9, 2017 ↩
-
Ofsted collected data from fostering agencies at household and child level. The number of filled places reported here at household level (51,935) is slightly different to the number of children in placement reported later in this report at child level (52,005). This is because at the end of the collection Ofsted had to accept submissions from a small number of agencies in which these 2 figures did not match. ↩
-
The DfE reported 53,420 children in care in foster placements at 31 March 2017. See ‘Children looked after in England including adoption: 2016 to 2017’, (DfE), page 8, 2017 ↩
-
A number of households had exemptions in place which allowed them to accommodate more children than they were approved for. As a result, a slightly larger number of places were reported as filled, vacant or unavailable (84,330) than the number of approved places (83,930). ↩
-
Not available’ places included those occupied by care leavers under “Staying Put” arrangements and those only available for siblings. Places were also unavailable for reasons relating to foster carers (for example, on hold due to personal and medical reasons) or the needs of children already in placement, for example, a requirement for solo placements. ↩
-
When the term ‘mainstream’ is used, it refers to all foster carers or fostering households that are not either family and friends, or short break foster carers/households. ↩
-
These are households and carers who offer only short break care to children. ↩
-
Between 2013 and 2016, Ofsted collected data separately on family and friends households and “connected person” households (those temporarily approved to provide foster care for particular children that they know for a very short time). In 2016 to 2017, however, these 2 household types were recorded together as family and friends. For the purpose of comparison, historical numbers of family and friends households combines the two groups. ↩
-
For 7 out of 4,375 mainstream households approved in 2016 to 2017, agencies did not provide the data on maximum number of children the fostering households were approved to care for. ↩
-
Seventy-one agencies, the majority of which (53) were IFAs, did not submit any data on prospective households. Sixty-six of these (including all but one of the LAs) had approved at least one mainstream household in 2016 to 2017. Furthermore, in-year mainstream approvals accounted for at least 20% of all approved mainstream households in 31 of these agencies. This suggests that they were actively recruiting during the year. ↩
-
Although there was a net gain of 1,045 households, of any type, in 2016 to 2017, according to the data collected on approvals and de-registrations in year, there were 610 fewer fostering households reported at 31 March 2017 than at the same time last year. The reason for this difference can be accounted for by the change in the cohort of the agencies completing the survey this year: a number of agencies de-registered during the year therefore they did not complete the data collection; the other reasons are changes in the household types (for example mainstream households becoming short breaks only) as well as inconsistencies in data recording. ↩
-
This analysis only looks at mainstream fostering households; family and friends, and short break households were excluded as these are single choice placements. ↩
-
The numbers of households offering long term placements and those offering permanent placements were combined together as those 2 types of placements are very similar on a practical level. However, it should be noted that slightly more IFA households indicated long term fostering as a primary offer, than LA households. ↩
-
The ethnicity of 8% of family and friends foster carers approved as at 31 March 2017 was recorded as ‘unknown’. ↩
-
The ethnicity of 1% of short breaks foster carers approved as at 31 March 2017 was recorded as ‘unknown’. ↩
-
One percent of all mainstream foster carers approved at 31 March 2017 had an ethnicity of ‘unknown’ recorded. As such, the percentages relating to ethnic groups do not always add up to 100%. ↩
-
Blackpool, North East Lincolnshire, Redcar and Cleveland, Shropshire and St Helens. In addition, Knowsley reported 13% of carers with ethnicity marked as ‘unknown’. However, it should be noted that the proportion of minority ethnic residents in the adult (aged 25 and older) population in those LAs does not exceed 5%. ↩
-
It may sometimes be suitable or desirable to match placements along ethnic, religious or cultural lines. Fostering, Commons Education Select Committee, (Fostering, Valuing Care, Recruitment, paragraph 109), 2017. ↩
-
Two percent of new carers were reported, the majority by LA agencies, with ethnicity marked as ‘unknown’. ↩
-
The 2016 to 2017 fostering dataset collection asked for data on all children still in placement on 31 March 2017, looking back at the 12 months before this date (or whatever portion of the year the child was in placement with the agency). ↩
-
The DfE reported that there were 72,670 children in care in total as at 31 March 2017; 74% (53,420) were fostered. Of the remainder: 11% (7,890) were in secure units, children’s homes or hostels; 6% (4,370) were placed with parents; 4% (3,090) were in other community placements; 3% (2,520) were placed for adoption; and 1% were in residential schools, other residential settings, or other placements not specified. Children looked after in England including adoption: 2016 to 2017, DfE, Table A2, 2017. ↩
-
The DfE reported a slightly higher figure for 2017: 53,420. ’Children looked after in England including adoption 2016 to 2017’ DfE, Table A2, 2017; ↩
-
As not all agencies provided matching data for their numbers of fostered children and numbers of fostering places, the overall number of fostered children and number of fostering places does not match. ↩
-
Unplanned endings are only counted here if the child remains placed with the same agency e.g. they move from one fostering household to another, both approved by the same agency. ↩
-
Please refer to the glossary for a full definition of the Staying Put scheme. ↩
-
The last data collected on school aged children in 2014 to 2015 showed that 63% (53,985) of all placed children in that year (85,890) were school aged. ↩
-
The data collected includes school aged as well as non-school aged children. ↩
-
Restraint data has been collected at child and fostering household level in 2017, rather than at aggregated level as in previous years, which may partially explain such an increase. ↩
-
An RHI is designed to give the child and the placing LA a chance to discuss why the child went missing and agree actions to try and prevent further instances of going missing. ↩
-
The 16 LAs were: Essex, Norfolk, Bexley, Harrow, Hillingdon, Lewisham, Darlington, St Helens, Tameside, Brighton and Hove, Milton Keynes, West Berkshire, Cornwall, Telford & Wrekin, Wolverhampton, Doncaster. ↩
-
This was slightly lower than the 10% for children in care reported by the DfE; however, their figure is likely to be impacted by including all types of placements. DfE data on children missing from foster placements is ‘not available’. The DfE also reported a higher average number of incidents per missing child (5.7). ‘Children looked after in England including adoption: 2016 to 2017, DfE, Table G1, 2017; ↩
-
These 5 LAs were: Buckinghamshire, Haringey, Kingston upon Thames, Lambeth, and Plymouth. ↩
-
Data on complaints received, including source and whether they were upheld, is available in the underlying data tables. ↩
-
Children might have returned to live with their parents or other family member, or become subject to a Special Guardianship Order, or been adopted. ↩