Statistics on Ethnicity and the Criminal Justice System, 2024 (HTML)
Published 27 November 2025
Applies to England and Wales

© Crown copyright 2025
This publication is licensed under the terms of the Open Government Licence v3.0 except where otherwise stated. To view this licence, visit nationalarchives.gov.uk/doc/open-government-licence/version/3 or write to the Information Policy Team, The National Archives, Kew, London TW9 4DU, or email: psi@nationalarchives.gov.uk.
Where we have identified any third party copyright information you will need to obtain permission from the copyright holders concerned.
This publication is available at https://www.gov.uk/government/statistics/ethnicity-and-the-criminal-justice-system-2024/statistics-on-ethnicity-and-the-criminal-justice-system-2024-html
We are trialling the publication of this statistical bulletin in HTML format alongside the usual PDF version and we are seeking user feedback on the use of HTML for the publication of statistical bulletins. Please send any comments to: datausers@justice.gov.uk.
1. Introduction
This publication compiles statistics from data sources across the Criminal Justice System (CJS), to provide a combined perspective of the typical experiences of different ethnic groups, how outcomes vary between groups and how this has changed over time. The areas of focus include: Victimisation; Police Activity; Defendants and Court Outcomes; Offender Management; Offender Characteristics; Offence Analysis; and Practitioners. The publication aims to help practitioners, policy makers, academics and members of the public understand outcomes and trends for different ethnic groups in the CJS in England and Wales. This is the latest biennial compendium of Statistics on Ethnicity and the Criminal Justice System and follows on from its sister publication Statistics on Women and the Criminal Justice System published last year.
Limitations of conclusions
Although we explore differences between ethnic groups, it is important that inferences are not made about individuals from group-level data as we consider averaged outcomes that do not take into consideration the individual circumstances which differ in each case. Therefore, the statistics presented in this report provide a combined perspective on the typical experiences of different ethnic groups, but it can highlight areas where further investigation or research may be warranted when looking at differences between ethnic groups.
It is important to note that for the majority of the report, no controls have been applied for other characteristics of ethnic groups (such as average income, geography, offence mix or offender history), so it is not possible to determine what proportion of differences identified in this report are directly attributable to ethnicity. It is not possible to make any causal links between ethnicity and CJS outcomes. The identification of differences should not be taken as evidence of bias or as direct effects of ethnicity.
Ethnicity classifications
Ethnicity is recorded by either self-reporting or as identified by a police officer or other third-party[footnote 1] depending on the manner in which it is recorded from the collection of sources used. When ethnicity is self-reported, it is based on five broad categories: Asian, Black, Mixed, White and Other. When ethnicity is officer identified[footnote 2], it has four broad ethnicity categories: White, Black, Asian and Other[footnote 3].
In acknowledgement of the subjective, multifaceted and changing nature of ethnic identification, we use self-identified ethnicity where this data is available[footnote 4]. The ethnicity classification used in each section is referenced throughout.
Generally, we discuss the broad categories individually, to reflect their different experiences, but given the much greater volume of White individuals in the population it is sometimes necessary or appropriate to consider the ethnic minorities (excluding White minorities) together. Whilst there is a need to focus on these aggregated ethnic groups to provide consistency and comparisons across the publication, this does not allow the disaggregation of more detailed ethnic groups across all data sources, restricting the ability to pinpoint disparity for ethnic groups within the 5+1 categories (e.g. White – Gypsy or Irish Traveller). The Offence Analysis chapter uses a regression analysis which has explored both 5+1 and 18+1 ethnicity classifications.
Unknown ethnicities in data sources
The recording of ethnicity data varies across sources and will reflect the operational nature of these systems, as data comes from multiple administrative databases or survey data. Where ethnicity information is unavailable with an unknown or not stated ethnicity, this information is not included in the analysis. High levels of missing ethnicity data limit the ability to provide conclusive results and findings may differ from experiences.
To allow users to assess the confidence they have in the data we are using, levels of missing or unreported ethnicity are reported throughout. The overall proportion of unknown within each data source can be found below.
Proportion of unknown ethnicity for key data sources
| Source | Percent of unknown ethnicity |
| Homicide in England and Wales | 3% |
| Police Powers and Procedures | 15%-18% |
| Out of Court disposals | 27% |
| Magistrates Courts | 33% |
| Crown Courts | 36% |
| Legal Aid Statistics | 47% |
| Offender Management Statistics Quarterly | 1% |
| HMI Prisons | 0% |
| Parole Board | <1% |
| Police National Computer | 7% |
| Judicial Diversity Statistics | 9%-14% |
- Court proceedings database
This publication focuses on the most serious offences occurring at criminal courts in England and Wales because less serious offences contain higher levels of unknown ethnicity. Around three quarters of ethnicity information for all offences at the magistrates’ court is not available - the majority of these are less serious offences dealt with via the Single Justice Procedure. The defendant does not have to be present and therefore ethnicity will not be recorded by prosecutors in these cases.
Despite refining the type of offence heard at courts, 33% of defendants at the magistrates’ court, and 36% of defendants at the Crown courts had an unknown ethnicity. Data extracted from administrative court systems relies on ethnicity information recorded at earlier stages of an individual’s journey through the criminal justice system and the recording of this information is not mandatory. There are some specific issues with self-defined ethnicity as outlined by the Home Office here.
We are working with HMCTS and partners across the criminal justice system to improve the availability of ethnicity data from underlying administrative systems to ensure that findings from this report are reliable and robust.
- Legal Aid Statistics
Since the introduction of a new web-based service Apply for Criminal Legal Aid in August 2024, information on ethnicity has no longer been collected, resulting in an increase in records marked as “unknown”.
Labelling of the tables (impacting some graphs) are consistent with that of the source data, whilst references to ethnic groups within the text have been adjusted to be as consistent across sources as possible. For more information on ethnicity classifications and data sources, please see the technical guide.
Data
Every effort is made to ensure that the figures presented are accurate and complete. However, these data have been extracted from large administrative data systems and surveys generated by the courts, police forces and other agencies, so some care should be taken, in particular when considering small differences and or sample sizes.
In most instances data are presented by calendar years (up to 2024) and financial years (up to year ending March 2025) for England and Wales unless otherwise stated, reflecting the reporting cycles and data collection of the agencies contributing information for this publication. Five-year time series have been presented wherever possible. Where changes to data systems or data quality issues do not allow for this, trends have been presented for the longest periods possible. The latest data available during the compilation of this report have been included.
Measures in this bulletin for 2020 and 2021 have been impacted by actions taken in response to the COVID-19 pandemic. For example, in April 2020, the Judiciary published guidance on the prioritisation of listings. During the reporting period, all offences likely to result in custody were prioritised which impacted outcomes such as custody rate and average custodial sentences. This should be taken into consideration when interpreting trends that incorporate affected figures.
The statistics reported in this bulletin are primarily Accredited Official Statistics[footnote 5], as drawn from either other published Accredited Official Statistics bulletins or the data underpinning them. Accredited Official Statistics have been reviewed by the Office for Statistics Regulation and found to comply with the standards of trustworthiness, quality and value in the Code of Practice for Statistics. Official statistics are established series which are released on behalf of the government in line with the Code of the Practice for Statistics, however they have not been independently reviewed and accredited.
As in previous reports, these have been included to present as full a picture as possible. The following table details the source and status of data used within each chapter of the report.
| Source | Percent of unknown ethnicity |
| Crime Survey for England and Wales | Accredited Official Statistics |
| Homicide in England and Wales | Accredited Official Statistics |
| Police Powers and Procedures | Accredited Official Statistics |
| Criminal Justice System Statistics | Accredited Official Statistics |
| Criminal Court Statistics | Accredited Official Statistics |
| Legal Aid Statistics | Accredited Official Statistics |
| Offender Management Statistics Quarterly | Accredited Official Statistics |
| His Majesty’s Inspectorate of Prisons Annual Report | Official Statistics |
| Parole Board | Official Statistics |
| Proven Reoffending Statistics | Accredited Official Statistics |
| Judicial Diversity Statistics | Official Statistics |
| MoJ/DfE data share - Understanding Educational background of young people who had been cautioned or sentenced for an offence | Official Statistics |
| Regression Analysis | Official Statistics |
Information provided
Within the latest release on Ethnicity and the Criminal Justice System 2024, additional information includes:
-
Supplementary spreadsheet tables accompany the chapters, providing additional data where the figures have not previously been published (or not published in that form). Where figures have already been published, links are provided as part of the text and tables.
-
A technical guide titled ‘A Technical Guide to Statistics on Ethnicity and the Criminal Justice System’ is available alongside this report, which provides users with information on the concepts and terminology used within the report, as well as information about data sources, data quality and references.
-
A user guide titled ‘A User Guide to Statistics on Ethnicity and the Criminal Justice System’.
-
A dashboard (PowerBi) to allow users to have more interactivity with visualising trends, with additional breakdowns where possible.
We welcome any feedback on the content, presentation, or on any other aspect of this bulletin. To contact us, please email CJS_Statistics@justice.gov.uk.
2. Main Points
| Victims: The rate of personal crime victimisation increased significantly to 10.8% of the population - up from 9.7% the previous year, due to increases in fraud. | There were statistically significant increases in the prevalence of personal crime victimisation in the Black (9.2% to 12.1%) and White (9.9% to 10.9%) ethnic groups. |
| Victims: A greater proportion of Black homicide victims were under 21. | In the last three years around a third Black victims were aged under 21, compared to 14% of White victims and 25% of Asian victims. |
| Police Activity: The proportion of stop and searches by ethnic group saw little change. | In the last three years there was a slight decrease in the proportions accounted for by Black individuals (14% to 13%) while the proportion for Asian (11%) and Mixed ethnicity individuals (4%) remained the same. |
| Defendants: Drug offences were the most common conviction offence for all ethnic groups except for White and Other, where theft was most common. | Drug offences accounted for 29% of convictions for Black offenders, 28% for Asian offenders, 25% for Mixed ethnicity offenders – compared to 22% for the Other ethnic group offenders and 15% for White offenders. |
| Defendants: The average custodial sentence length (ACSL) continued to be lower for White defendants. | The ACSL was 18.4 months for White defendants, compared to 32.2 months for Asian defendants, 28.6 months for Black defendants, 22.9 months for Mixed ethnic group defendants and 22.2 months for the Other ethnic group. |
| Offender Management: A greater proportion of children in prison were from minority ethnic groups. | The ethnicity of prisoners varied by age groups - a higher proportion of young prisoners were from minority ethnic groups. In contrast, 84% of prisoners aged 50+ were White. |
| Offender Management: Black prisoners served the greatest proportion of their original sentence in custody. | In line with previous years, Black defendants continued to serve a greater proportion of their original determinate sentence in custody (62% in 2024). |
| Offender Characteristics: A higher proportion of prosecutions for Black and Mixed defendants were against children. | Children from the Black and Mixed ethnic groups accounted for 13% and 8% of all prosecutions, respectively - compared to 3% for White defendants. |
| Offender Characteristics: The educational attainment of young people who were cautioned or sentenced for an offence was lowest for the White ethnic group, across all three measures. | Young people cautioned or sentence for an offence showed a higher incidence of eligibility for free school meals, having special educational needs and being absent from school (persistent, suspended or excluded) when compared to the wider pupil population. |
| Practitioners: The ethnic profile of practitioners in the Criminal Justice System (CJS) has become slightly more diverse over the last 5 years. | The proportion of staff from White backgrounds has decreased between 1 and 3 % across all CJS organisations over the last 5 years. |
| Offender analysis: Offenders from Black and Other ethnic groups had significantly higher odds of receiving a custodial sentence compared to White offenders, while those from Asian ethnic groups had significantly lower odds, although the magnitude of these differences was small. | Over the past five years, there is no consistent pattern of significant differences in the odds of receiving a custodial sentence by ethnicity. However, in certain years there are individual differences that are significant and some groups displayed more stable associations than others. |
| Offender analysis: There was no statistically significant association between an offender’s ethnicity and the length of custodial sentences for indictable offences. | When analysed by offence group, some significant disparities were evident – most notably for drug offences, where offenders from Asian, Black and Mixed ethnic groups received longer median custodial sentences than White offenders. |
Statistician’s comment
In general, minority ethnic groups appear to be over-represented at many stages throughout the CJS compared with the White ethnic group. This is especially apparent when comparing to the ethnic breakdown of the population of England and Wales. The greatest disparity appears at the point of stop and search, custodial remands and prison population.
Statistical analysis to investigate the association between ethnicity and custodial sentences has been conducted and additional analysis has been done to explore the association between ethnicity and sentence lengths for the first time.
Results show that over the past five years, there is no consistent pattern of significant differences in the odds of receiving a custodial sentence by ethnicity. In certain years there are individual differences that are significant, and some groups displayed more stable associations than others – in the latest year there was a statistically significant association for offenders of Black and Other ethnic groups with increased odds of receiving a custodial sentence, compared to White offenders.
Analysis on sentence lengths showed no significant differences in sentence length for indictable offences but some disparities were evident when analysed by offence groups, particularly for drug offences.
Changes and revisions in this publication
Crown Court data development (“One Crown”)
MoJ and HMCTS have worked together on the “One Crown” data project to create a single, consistent and flexible dataset that meets both MoJ and HMCTS needs. This has brought greater transparency, clarity and coherence for all users of the published Criminal Court Statistics series.
Historically the two MoJ published series concerning criminal courts have been produced independently from distinct pipelines which is inefficient and risks undermining transparency. Moving to the same data model will improve the coherence across MoJ, provide a clear set of shared definitions across the topic for users and ensure the data best reflects operational reality of the underlying administrative systems.
Data presented from Criminal Courts Statistics Quarterly uses the new pipeline. Data from Criminal Justice Statistics Quarterly is in line with the historical data pipelines. Good progress has been made, and we are continuing to quality assure the data and refine definitions to ensure that the new CJS data series are robust before we adopt the change.
We hope to move to the One Crown pipeline from January 2026 – we will set out and quantify the impact of changes to the data pipeline alongside clear reasons for any observed change in the Criminal Justice Statistics Quarterly publication.
Statistical analysis on sentence lengths
Following feedback from user engagement exercises carried with internal and external stakeholders, new statistical analysis to investigate the association an offender’s ethnicity and the likelihood of receiving a longer custodial sentence has been conducted and can be found within ‘Offence Analysis’.
3. Victims
In 2024/25 the estimated rate of personal crime victimisation increased significantly to 10.8% of the population aged 16 and over, from 9.7% the previous year, driven by increases in fraud.
There were statistically significant increases in the prevalence of personal crime victimisation (including fraud) in the Black (from 9.2% to 12.1% in 2024/25) and White (from 9.9% to 10.9% in 2024/25) ethnic groups.
Between 2021/22 and 2023/24, a third of Black homicide victims were aged 20 or younger.
This compares to 14% of White victims and 25% of Asian victims.
This chapter explores the nature, extent and risk of victimisation, in relation to ethnicity, from Crime Survey for England and Wales (CSEW): year ending March 2023 and Homicide in England and Wales[footnote 6].
3.1 Crime Survey for England and Wales
The Crime Survey in England and Wales (CSEW) is a large nationally representative survey that asks people about their experience as a victim of a crime in the previous 12 months. It offers insights into the experience of victims which other sources of data, such as police records, may not capture[footnote 7]. In this section, where there are statistically significant differences between groups, this will be stated. Where differences are not referred to as being statistically significant these are either not significantly different, or differences have not been tested.
Personal crime against people aged 16 and over (including fraud and computer misuse)[footnote 8]
In 2024/25, the CSEW estimated that 10.8% of people aged 16 and over were a victim of a personal crime on one or more occasions, this has been driven by increases in fraud.
-
There was a statistically significant increase in the percentage of people aged 16 and over who were victims of a personal crime once or more, increasing from 9.7% in 2023/24
-
This reflects a statistically significant increase in the Black ethnic group (from 9.2% to 12.1%) and the White ethnic group (9.9% to 10.9%).
-
The Asian ethnic group (8.8%) were significantly less likely than the White ethnic group (10.9%) to be victims of a personal crime.
-
This reflects the statistically significant increase in the proportion of people who were aged 16 and over who were victims over the same period for the Black ethnic group (from 9.2% to 12.1%) and the White ethnic group (9.9% to 10.9%).
Figure 3.01: Percentage of people aged 16 and over who reported being victims of a CSEW personal crime by ethnic group, England and Wales 2023/24 and 2024/25[footnote 9]
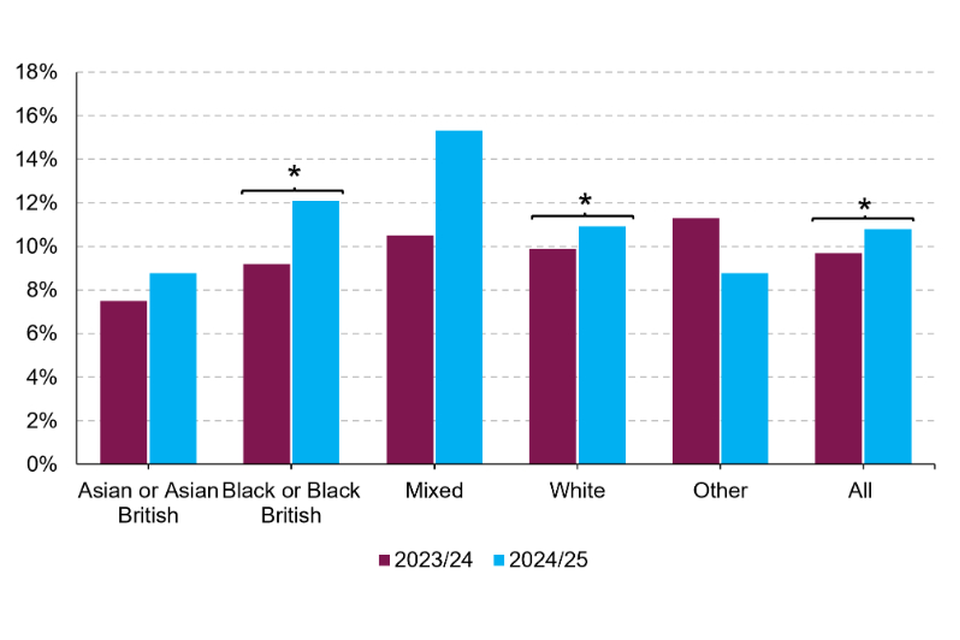
(Source: Ministry of Justice – Ethnicity and the Criminal Justice System: Chapter 3: Victims - Table 3_01a [derived from ONS – CSEW])
Personal crime against children[footnote 10]
In 2024/25, an estimated 11.9% of children were a victim of a personal crime once or more.
-
Children from the Black ethnic group presented the lowest proportion (at 9.2%) whilst those from the Asian ethnic group presented the highest (11.6%). An estimated 11.2% of White children reported being a victim of personal crime in 2024/25, and 9.5% for Mixed children[footnote 11].
-
The percentage of children who reported victimisation in 2024/25 has significantly increased from 2023/24 in the Asian ethnic group, increasing from 3.4% to 11.6%.
Racially motivated incidents[footnote 12]
There were an estimated 145,000 racially motivated incidents of crime in 2024/25. Personal crime that was racially motivated increased from 44,000 to 113,000 over this period and was the only statistically significant increase, whilst household crime that was racially motivated increased from 19,000 to 31,000. Despite the increases, these make up a small proportion of total crimes that victims report and is prone to larger variation in estimates.
Confidence in the effectiveness of the CJS
The overall percentage of people aged 16 and over who are confident that the CJS is effective in 2024/25 was 46%, a statistically significant decrease of 2 percentage points from the previous year. A decrease of 2 percentage points was also seen across the Mixed ethnic group (from 50% to 48% in 2024/25), though was not statistically significant, and the White ethnic group (decrease of 3 percentage points from 47% to 44%).
In 2024/25, a higher percentage of Asian (67%), Black (67%) and those in the Other ethnic group (73%) were confident that the CJS was effective, compared to the White ethnic group (44%).
3.2 Homicide
As homicide is a relatively low-volume offence, figures are subject to volatility. This is especially true where data have been broken down further for analysis. Therefore, figures have been collated over a three-year period to represent trends over time.
In 2023/24, there were 554 homicides in the Home Office Homicide Index where the ethnicity of the victim was recorded[footnote 13]. This represents a fall of 14% compared to 2019/20 (647) but is above levels seen a decade ago (489 in 2014/15).
-
Two-thirds (67%) of victims in the latest year were from the White ethnic group, with 17% involving Black victims and 16% from the Other ethnic group[footnote 14]. The long-term trend has shown a decrease in the percentage of White victims (from 79% in 2014/15), although this has fluctuated over the last 10 years, with corresponding increases in proportions of Black (from 11%) and Other ethnic group (from 10%) victims.
-
Although the 10 year time period from 2014/15 to 2023/24 shows an increase of 13% (from 489 to 554) where the ethnicity was known (13% overall), over the past 5 years, between 2019/20 and 2023/24, there has been an overall decrease of 14% (647 to 554) where victim ethnicity was known (16% overall).
Although the majority of homicide victims were White, accounting for different population sizes shows that Black people had higher rates of victimisation.
-
In the three years to March 2024, average rates per million population were over four times higher for Black victims (39.8) than White victims (8.5) or victims of other ethnicities (9.4).
-
Homicide rates across all ethnic groups over the last three years are similar compared with the three-year period to year ending March 2021. For further information on disparity rates, please visit Homicide in England and Wales - Office for National Statistics (See Appendix table 7).
Sex and age
Over the three-year period between 2021/22 and 2023/24, there were a greater number of male than female homicide victims across all ethnic groups. The proportion of male victims was highest in the Black ethnic group (85%), followed by the Other ethnic group (74%), with Mixed ethnic victims presenting the lowest proportion that were male (67%).
-
Over the same period, where ethnicity was known, 82% of all homicide victims were over 21 years old, with 6% between 18 and 20 and 12% under 18.
-
This trend varies across intersections between ethnicity, sex, and age. Female victims were aged over 21 in 86% of homicides, rising to 89% where victims were White and falling to 84% and 83% when victims were from the Black and Other ethnic groups, respectively.
-
Around 80% of male homicide victims were aged over 21, rising to 86% where victims were White and falling to 69% and 67% when victims were from the Other and Black ethnic groups, respectively. As such non-White ethnic groups reported a higher proportion of victims aged under 21, specifically around a third of Black homicide victims were aged under 21.
These differences will partly reflect the different age distributions of ethnic groups in the population, for further information see Ethnic group by age and sex, England and Wales: Census 2021
Geography
There were 355 homicides where ethnicity of the victim was recorded in London[footnote 15] in the latest year, accounting for 20% of all homicides recorded. This was the only region in which homicide victims were more likely to be from the Black ethnic group (42%), with only 10% of homicides involving Black victims throughout the rest of England and Wales. This may partly reflect the different distributions of ethnic groups in the population in different locations, as some areas are more ethnically diverse than England and Wales as a whole.
Method of killing
A sharp instrument was the most frequent apparent method of killing across most ethnic groups, accounting for 43% of all homicides where ethnicity was known. This method accounted for 66% of homicides involving Black victims, compared to 36% of those involving White victims.
-
A higher proportion of homicides involving Black victims had shooting as the apparent method of killing at 12% (0-6% for other groups).
-
A higher proportion of homicides involving White victims had hitting (kicking, etc.) as the apparent method of killing at 22% (6-13% for other groups).
Location
The location in which a homicide was committed showed distinct differences between ethnic groups. Homicides involving victims from the Black and Mixed ethnic groups were most often located in public places (60% and 52%, respectively), whilst those involving White victims took place most often in residential locations (58%). The most frequent location for homicides involving White victims was in and around the house (or dwelling) whereas those involving victims from the Black ethnic group more often took place on the street (including footpaths and alleyways).
Figure 3.02: Proportion of homicides currently recorded by location of homicide and ethnic appearance of victim, England and Wales, combined data for 2021/22 to 2023/24
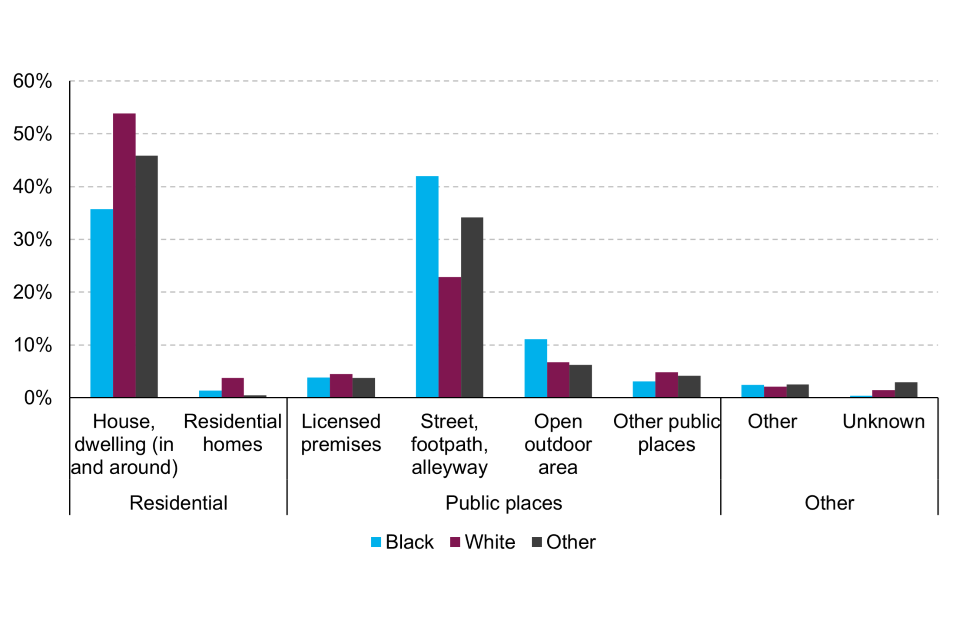
(Source: Ministry of Justice – Ethnicity and the Criminal Justice System: Chapter 3: Victims - Table 3_09 [derived from Home Office Homicide Index])
Principal suspects and circumstances
In the latest year, 65% of principal suspects convicted of homicide were from the White ethnic group, followed by 20% from the Black ethnic group and 9% from the Asian ethnic group. For each ethnic group, victims were most often associated with a principal suspect of the same ethnic group (White: 89%, Black: 60%, Asian: 56%).
The relationship between White homicide victims and associated principal suspect was most often a friend or acquaintance (20%). The relationship between homicide victims from a Black ethnic group and the principal suspect was most often not known (22%)[footnote 16].
4. Police Activity
In 2024/25, 70% of stop and searches were for those from the White ethnic group.
In the 2021 Census, 82% of individuals declared themselves as being part of the White ethnic group, suggesting that those from minority ethnic groups are more likely to be stopped and searched[footnote 17].
In 2024/25, 13% of stop and searches were for Black individuals, 11% for Asian individuals and 4% for Mixed ethnicity individuals.
The total number of all arrests (where ethnicity is known) increased by 10% between 2022/23 and 2024/25.
In 2024/25, 79% of suspects were from the White ethnic group with 8% from the Asian ethnic group, 7% from the Black ethnic group, 4% from the Mixed ethnic group and 2% from the Other ethnic group.
When compared to the proportions in the ONS Census[footnote 18], these are broadly in line with the proportions for the general population (9% Asian / 4% Black / 3% Mixed and 2% Other).
In 2024/25, 70% of children arrested in London were from minority ethnic groups.
Across all ages, a larger proportion of arrests in London were for suspects from minority ethnic groups, at 59%, compared to 18% across the rest of England and Wales.
This chapter explores police activity by ethnicity of persons stopped and searched and/or arrested. It covers statistics on stop and searches and arrests, which are published by the Home Office in the Police powers and procedures: Stop and search and arrests and mental health detentions, England and Wales, year ending 31 March 2025. It also covers trends in Penalty Notices for Disorder and cautions issued, published in Criminal Justice Statistics Quarterly: June 2025.
4.1 Stop and searches[footnote 19]
Police officers have the power to stop and search individuals under different pieces of legislation. In this chapter, those conducted under section 1 of the Police and Criminal Evidence Act 1984 (PACE) and section 60 of the Criminal Justice and Public Order Act 1994 have been combined[footnote 20].
Over the last year, the total number of stop and searches has fallen by 1% from 405,000 in 2023/24 to 403,000 in 2024/25. Throughout this period, the proportion of stop and searches for those from the White ethnic group (70%), Black (13%), Asian (11%) and Mixed (4%) groups remained unchanged. There was a marginal increase for Other ethnic group individuals (2% to 3%).
In terms of absolute volumes of stop and searches, there was a 15% increase across the period for individuals from the Other ethnic group whereas the volume decreased 11% for black individuals.
Figure 4.01: Numbers and proportions of stop and searches by ethnicity, England and Wales, 2022/23 to 2024/25
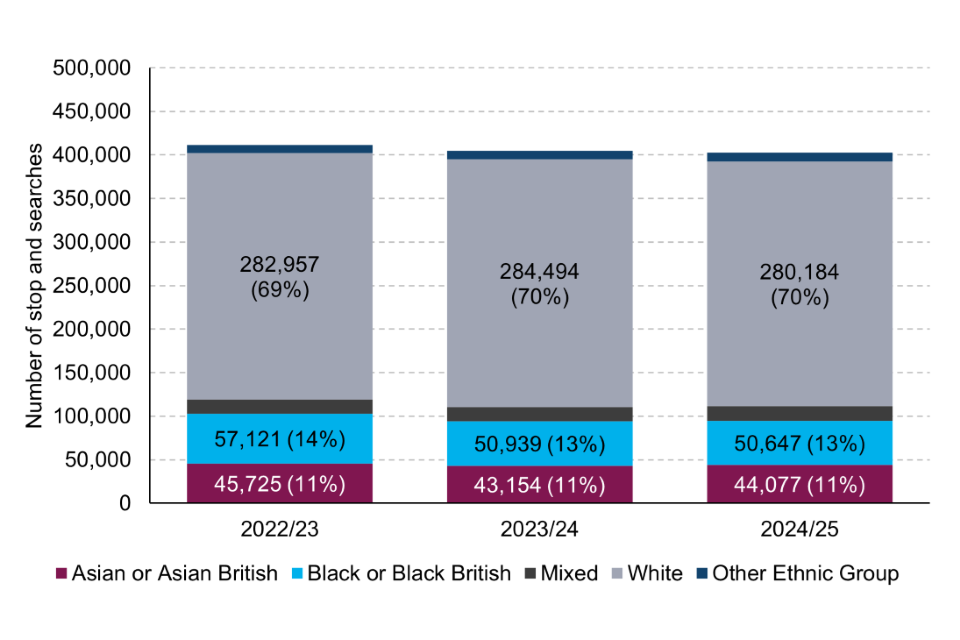
(Source: Home Office Stop and search open data tables)
Reasons for Stop and Search
When conducting a stop and search, police record the reason for the stop and search as well as the ethnicity of the person searched. There are various reasons why the police may carry out a stop and search, for example they may suspect an individual is carrying drugs or a weapon.
In the latest year, suspicion of drugs was the most common reason for stops across all ethnic groups. In 2024/25, 69% of stop and searches conducted on individuals from the Asian ethnic group were for drugs, compared to 59% - 61% for all other ethnic groups. Black suspects had the highest proportion of stop and searches for offensive weapons (including firearms) at 20%, compared to 14% - 18% for other ethnic groups.
Geography
The overall ethnicity trends for stop and searches are influenced by those conducted in London. This is due to London’s ethnic composition compared with the rest of England and Wales.
-
In 2024/25, 21% of all stop and searches (where ethnicity is known) were conducted in London; this proportion has decreased from 30% in 2022/23.
-
Of those conducted in London (where ethnicity is known), 62% involved suspects from minority ethnic groups (35% Black, 15% Asian, 7% Mixed and 6% Other). This still remains markedly higher than the rest of England and Wales, at 22% in 2024/25 (7% Black, 10% Asian, 4% Mixed and 2% Other).
Figure 4.02: Proportions of stop and searches in London and England and Wales, by ethnicity, 2024/25
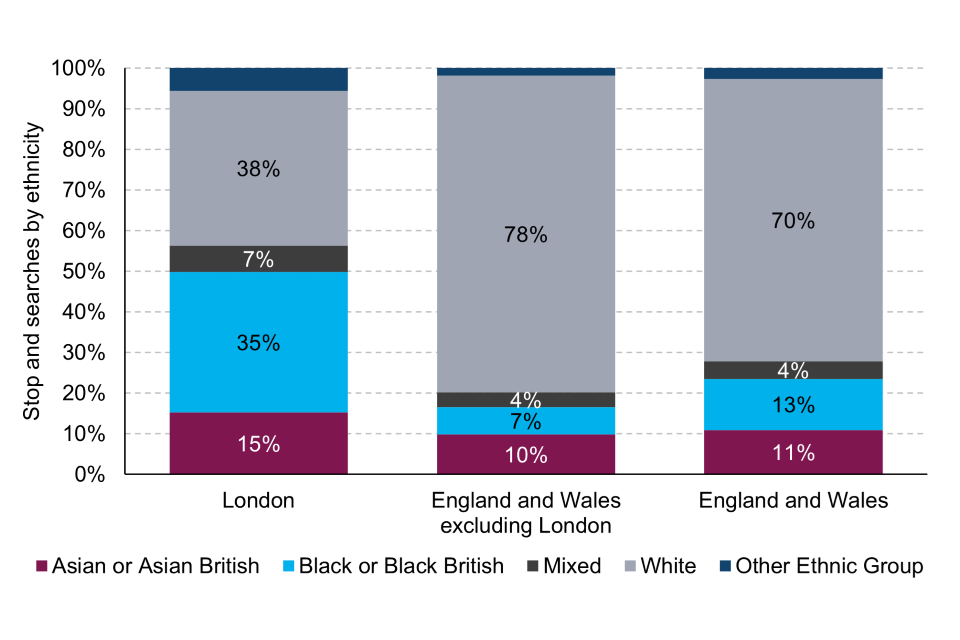
(Source: Home Office Stop and search open data tables)
Stop and Search outcomes
This section focusses on disaggregating the outcomes that are a result of a professional judgement (i.e., the officer found what they were searching for), and those where the item found was not what the officer was searching for, or where nothing was found.
In 2024/25, 25% of all stop and searches (where ethnicity is known) resulted in an outcome that was linked to the reason for the search, i.e., the officer found what they were searching for. Breaking this down further, 15% of stop and searches resulted in an arrest and 10% in a community resolution.
-
Mixed ethnicity individuals had the highest proportion of stop and searches in which the outcome was linked to the reason for search at 27% compared to white individuals at 23%.
-
Individuals from the White ethnic group had the highest proportion of stop and searches where nothing was found (72%), followed by Asian and Other ethnic group individuals (69%).
-
A higher proportion of Black and Other ethnic group individuals received the principal outcome of arrest at 19%, followed by 18% of Mixed ethnicity individuals, 15% of White individuals and 14% of Asian individuals.
-
Since 2022/23, the proportion of stop and searches that resulted in no further action has decreased across all ethnic groups (from 69% to 66% overall), with corresponding increases for other outcomes (including arrest and Community Resolution)[footnote 21].
Reasons for searches that resulted in arrest[footnote 22]
Across all ethnic groups for 24/25, drugs were the most common reason for searches that resulted in an arrest after a stop and search, accounting for 61% of resultant arrests for Asian individuals, 51% for White, 51% for Black, 50% for Mixed ethnicity and 48% for individuals from the Other ethnic group.
The proportion of arrests due to drugs has remained broadly similar for each ethnic group when compared to 2022/23.
Stop and Search arrests
In 2024/25, stop and searches which resulted in arrests accounted for 10% of total arrests made in England and Wales (where ethnicity is known). Black individuals had the highest proportion of arrests that resulted from stop and search, accounting for 20% of total arrests, which remained the same as 2022/23. This proportion varied between 8% and 16% for all other ethnic groups in 2024/25.
London is a key contributor to stop and search arrests, with these accounting for 40% of total arrests compared to stop and search arrests accounting for 8% of all arrests in other parts of England and Wales.
4.2 Arrests
The total number of all arrests (where ethnicity is known) increased by 7% between 2023/24 and 2024/25.
The volume of arrests of black individuals increased by 17%. The volume increased for all other groups, ranging from 5% for White individuals to 16% for Other ethnic group individuals.
In 2024/25, White individuals accounted for 79% of arrests with 7% being Black individuals, 8% Asian, 4% Mixed ethnicity and 2% of Other ethnicities. These proportions have remained relatively stable between 2022/23 and 2024/25.
Figure 4.03: Number and proportions of arrests in England and Wales by ethnicity, 2022/23 to 2024/25
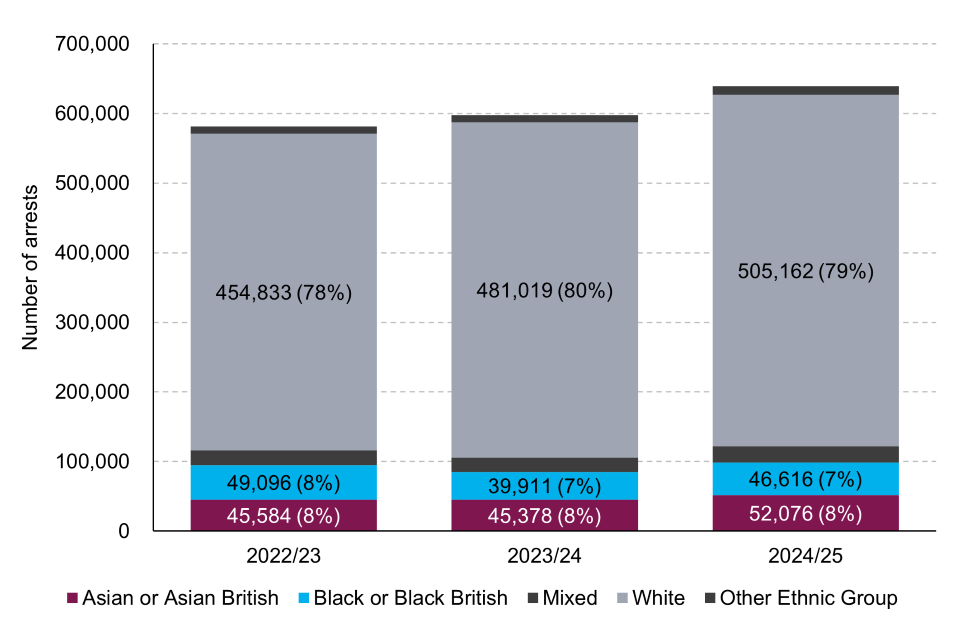
(Source: Home Office Arrests open data tables)
Offence groups[footnote 23]
Violence against the person offences have accounted for the largest proportion of total arrests (where ethnicity is known) since 2022/23, at 47% in 2022/23 and 2024/25[footnote 24]. The proportion of total arrests accounted for by theft offences and sexual offences increased over this period (14% to 15% and 6% to 7% respectively) and drug offences and public order offences decreased (9% to 8% and 7% to 6% respectively). This trend was broadly consistent across ethnic groups.
In 2024/25, a higher proportion of arrests for drugs offences were from the Black ethnic group (13%) when compared to other ethnic groups (7%-11%). Whilst drug offences accounted for the second most frequent reason for arrest for non-white ethnic groups, white suspects were more often arrested for theft offences, with these accounting for 16% of all arrests.
Age groups[footnote 25]
Between 2022/23 and 2024/25, arrests decreased 3% for children while increasing 11% for adults. In 2024/25, youth arrests accounted for 8% of all arrests across England and Wales.
-
This decrease in arrests for children was not consistent across ethnic groups, with decreases in volume of 20% for Black, 7% for Mixed and 1% for White groups and increases of 9% for Asian and 15% for Other ethnic groups.
-
Adult arrest volumes increased across all ethnic groups (11-16%) except for Black individuals, which decreased by 3%.
Geography
In 2024/25, 6% of all arrests (where ethnicity is known)[footnote 26] were in London.
-
A larger proportion of arrests in London were for suspects from minority ethnic groups, at 59%, compared to 18% across the rest of England and Wales. This is expected given the more diverse population of London.
-
Children from minority ethnic groups accounted for 70% of arrests of children made in London in 2024/25, in comparison to 22% in the rest of England and Wales. Over the last 3 years, the proportion of children arrested in London from each ethnic group has remained broadly stable.
4.3 Out of Court Disposals[footnote 27]
In the latest year, around three-quarters of the total Out of Court Disposals issued were community resolutions – this has increased markedly over the last decade, as the volumes of Penalty Notices for Disorder and cautions have fallen. Currently it is not possible to breakdown community resolutions data by ethnicity – we will look to expand the available evidence and seek to develop our understanding of their use across ethnic groups.
Penalty Notices for Disorder (PNDS)[footnote 28]
The number of PNDs issued has continued to decline over the last 5 years, falling by 75% from 16,000 in 2020 to 4,000 in 2024[footnote 29], whilst community resolutions have increased. Community resolutions accounted for 74% of Out of Court disposals in 2024. Information on community resolutions by ethnicity is currently unavailable but inclusion of this data is being considered for future publications.
In 2024, 47% of PNDs were paid in full, whilst 37% resulted in a fine for late payment. Defendants from the Asian ethnic group had the highest proportion of PNDs paid in full consistently each year (at 58% in 2024) and those from the Black ethnic group had the lowest (at 34% in 2024).
Cautions[footnote 30][footnote 31]
The volume of cautions issued has continued to decline over the last 5 years, falling 23% to 40,000[footnote 32] in 2024 and is the lowest seen in the series.
Drug offences and violence against the person were the two largest offence groups for which 31% of cautions were issued, across all ethnic groups.
Around half (53%) of all cautions issued in 2024 were Adult Conditional cautions, with the remainder accounted for by Adult Simple cautions (38%), Youth Simple (4%) and Youth Conditional (5%) cautions.
- A higher proportion of Black defendants received either a Simple or Conditional Youth caution (14%) when compared to other ethnic groups (7-9%).
5. Defendants
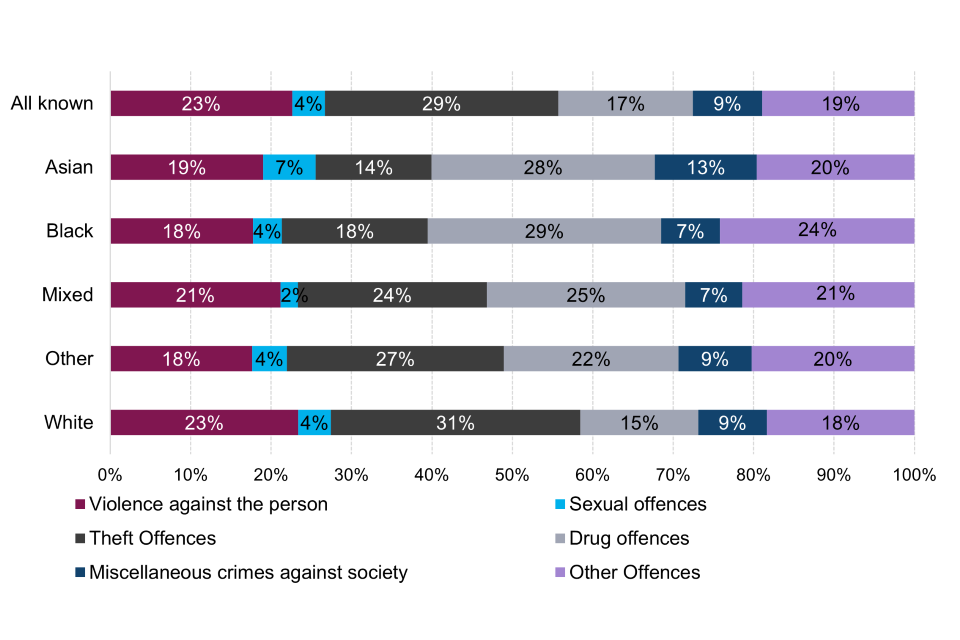
Convictions for drug offences account for the largest proportion of convictions for all ethnic groups apart from for White and Other offenders, where the highest proportion was for theft offences.
In 2024 drug offences accounted for 29% of convictions for Black offenders, 28% for Asian offenders, 25% for Mixed ethnicity offenders, 22% for the Other ethnic group offenders, and 15% for White offenders.
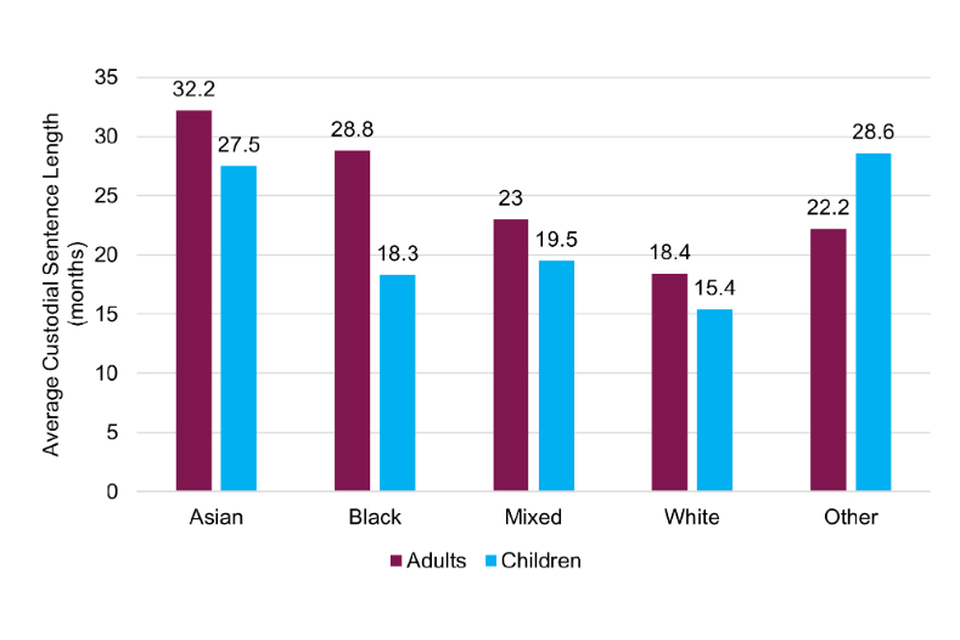
Since 2020, ACSL was consistently lower for White defendants compared to all other ethnic groups combined.
In 2024, the ACSL was 18.4 months for White defendants, compared to 32.2 months for Asian defendants, 28.6 months for Black defendants, 22.9 months for Mixed ethnic group defendants and 22.2 months for the Other ethnic group.
This chapter explores outcomes for defendants in the Criminal Justice System (CJS) predominantly drawing on indictable offence[footnote 33] data from the Criminal Justice Statistics quarterly: December 2024 publication. Whilst ethnicity coverage is more complete for triable either way and indictable only offences in courts data, 33% of defendants had an unknown ethnicity in 2024. Sections of this chapter that use this data are limited to these offences (referred to as indictable) and to defendants aged 10 or over unless explicitly stated otherwise.
Other sources in this chapter include Criminal Courts Statistics, Legal Aid Statistics and Offender Management Statistics Quarterly.
When a suspect is formally charged, they are brought before a magistrates’ court (as a defendant) as soon as possible. Following prosecution (which can include being sent to Crown Court), defendants found guilty are subsequently convicted and sentenced.
This chapter also uses Relative Rate Index (RRI), a statistical measure used to quantify the relative difference in event rates between two fixed populations and was recommended for use in the Lammy Review, 2017.
The RRI compares the outcome rate for one group (the ‘at risk’ group) to that of another (the ‘baseline’ group). In this analysis, the White ethnic group is used as the baseline. The results of RRI can be statistically and practically significant, showing the size of disparity between groups.
RRI analysis does not tend to control for additional confounding variables which may impact differences such as offence mix, plea and other contributing factors. Please see chapter 9 Offence Analysis and technical guide for more details on how to interpret RRI.
5.1 Prosecutions and Convictions[footnote 34]
Of the defendants prosecuted for indictable offences in 2024, where ethnicity is known, 83% were White, 7% were Black, 6% were Asian, 3% were of Mixed ethnicity and 1% were of the Other ethnic group - with similar proportions seen in convictions.
Offence groups
Convictions across indictable offence groups varied between ethnic groups in 2024, with drug offences accounting for the highest proportion within each ethnic group except for White and Other offenders, where the highest proportion of convictions was for theft offences (31% and 27%).
-
Drug offences accounted for 29% of convictions for Black offenders, 28% for Asian offenders, 25% for Mixed ethnicity offenders, 22% for the Other ethnic group offenders, and 15% for White offenders.
-
Throughout the past 5 years, drug offences convictions accounted for the highest proportion of offenders for Asian, Black, and Mixed ethnic groups, while the highest proportion of White and Other offenders were convicted for theft offences in 2023 and 2024 and violence against person in 2021 and 2022.
Figure 5.01: Proportions of indictable offences convictions for all ethnicities, by offence groups, 2024, England and Wales
(Source: Ministry of Justice - Criminal Justice Statistics Quarterly: year ending December 2024 - Outcomes by Offence data tool)
5.2 Remands
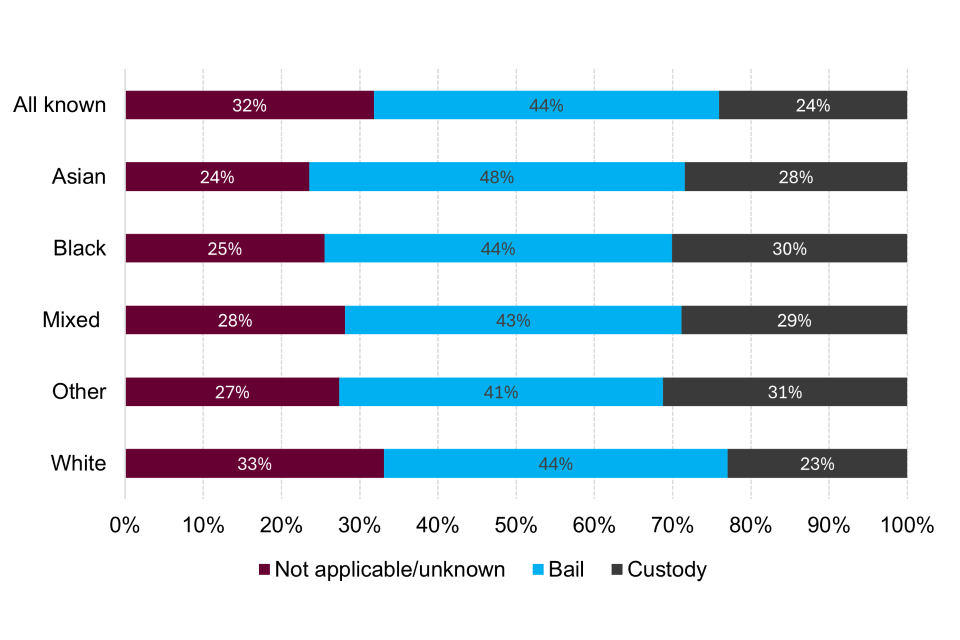
Magistrates’ courts[footnote 35]
Figure 5.02a: Proportions of remand status by ethnic groups at magistrates’ courts, for indictable offences, 2024, England and Wales
(Source: Ministry of Justice - Criminal Justice Statistics Quarterly: year ending December 2024 - Remands data tool)
The proportion of defendants remanded in custody for indictable offences at magistrates’ courts was lowest for the White ethnic group, at 23%.
- The highest proportion of custodial remand was for the Other ethnic group at 31%, followed by the Black ethnic group (30%), Mixed ethnic group (29%) and the Asian ethnic group (28%).
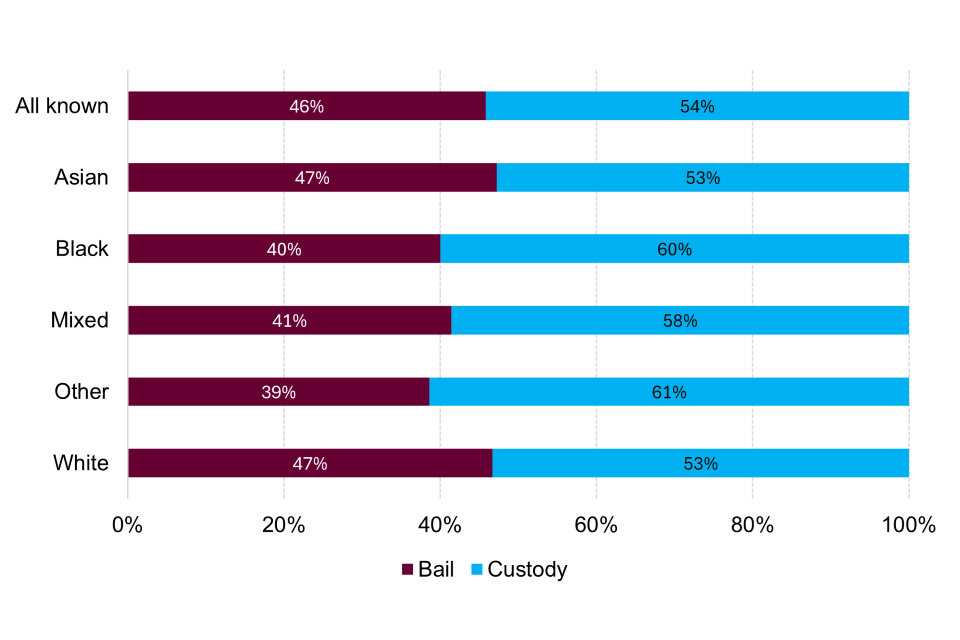
Crown Court[footnote 36]
Figure 5.02b: Proportions of remand status by ethnic groups at the Crown Court, for indictable offences, 2024, England and Wales
(Source: Ministry of Justice - Criminal Justice Statistics Quarterly: year ending December 2024 - Remands data tool)
In 2024, all ethnic groups were more likely to be remanded in custody than bailed for indictable offences, with the Other ethnic group having the highest proportion of defendants remanded in custody at 61%, followed by the Black ethnic group at 60%.
- Overall, larger proportions of defendants are remanded in custody at Crown Court, compared to magistrates’ courts, which is expected due to only the most serious cases being dealt with by the Crown Court.
In 2024, of all defendants remanded in custody for indictable offences at Crown Court, 70% were sentenced to immediate custody.
-
Similar proportions were seen across ethnic groups, ranging from 67% for Black and Asian defendants to 71% for White and Other defendants.
-
Larger proportions of defendants from Black, Asian, Mixed and the Other ethnic group who were remanded in custody had their case discontinued, were given other disposals without conviction or were acquitted (ranging from 15% to 18%) compared to White defendants at 12%.
Relative Rate Index
Figure 5.03: RRI for ethnic groups compared to the White group, of defendants remanded in custody per all remand decisions at all courts[footnote 37], for indictable offences, 2020 - 2024, England and Wales
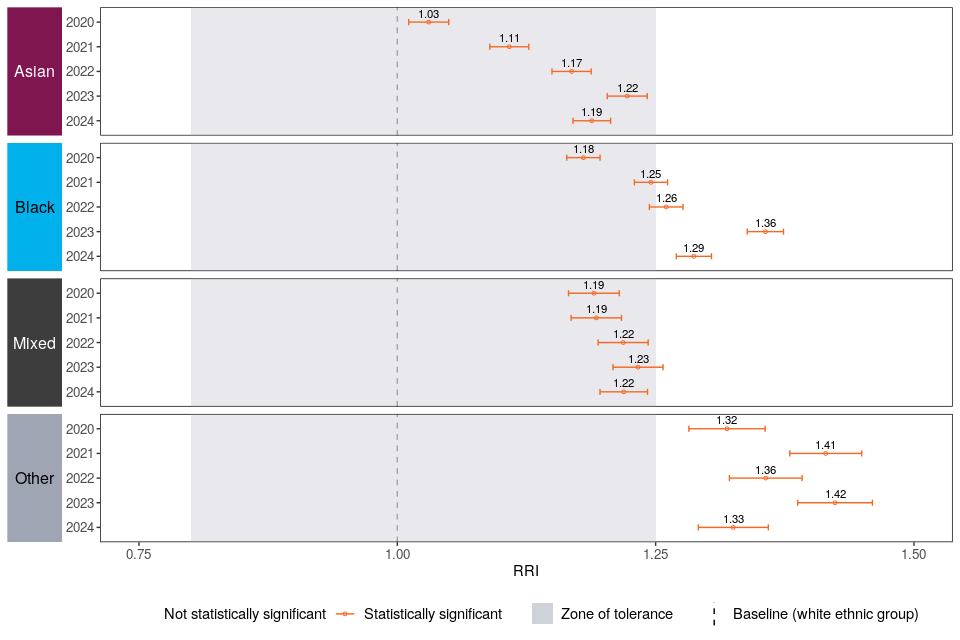
(Source: Ministry of Justice – Ethnicity and the Criminal Justice System: Chapter 5: Defendants – Table 5_17 [derived from MoJ, CJSQ])
Relative Rate Index (RRI)[footnote 38] analysis for individuals dealt with at all courts in 2024 showed that all defendants from non-White ethnic groups were more likely to be remanded in custody.
- The Other ethnic group were 33%, Black defendants 29%, Mixed ethnic group 22% and Asian defendants 19% more likely to be remanded in custody than White defendants.
5.3 Pre-sentence Reports[footnote 39]
Pre-sentence reports (PSRs) are prepared by the Probation Service to provide information to the court about the offender and any circumstances surrounding the offence, to help decide on a suitable sentence. Data on PSRs relates to those aged 18 or older and all offence types. Statistics on PSRs are published in the probation tables within Offender Management Statistics.
This section looks at the pre-sentence reports received and the agreement (concordance) between recommendations made in PSRs, and sentences issued at court, and whether they differ between ethnic groups.
There were 84,380 PSR’s prepared in 2024 where ethnicity is known, up by 16% from the previous year. 80% of the total PSRs prepared were for White defendants which has remained consistent in the last five years (80% to 83%).
Figure 5.04: The level of concordance between sentences proposed and outcomes for ethnic groups, by sentence type, 2024, England and Wales
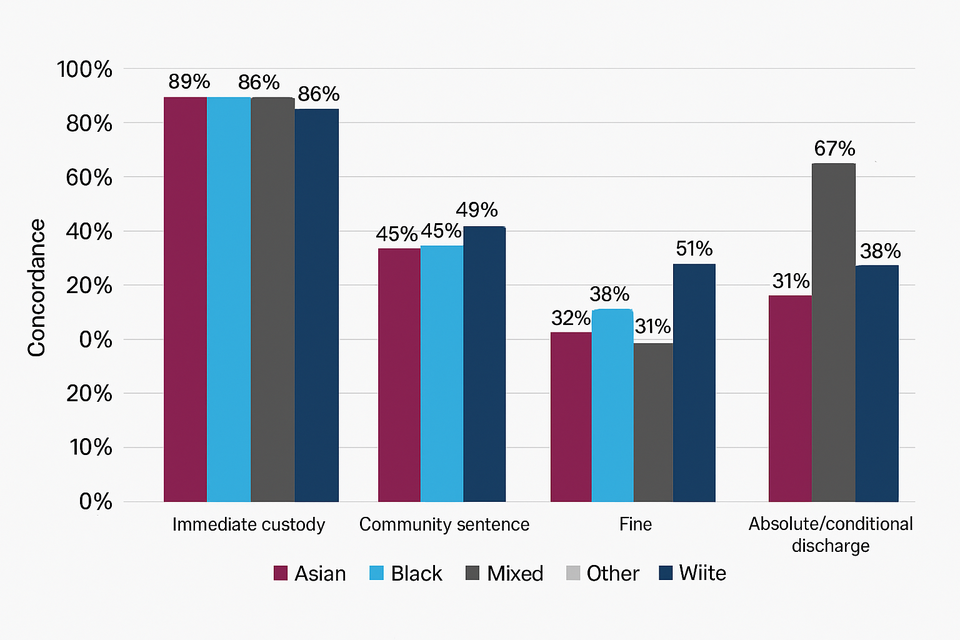
(Source: Ministry of Justice – Ethnicity and the Criminal Justice System: Chapter 5: Defendants – Table 5.16b [derived from MOJ, OMSQ])
In 2024, concordance rates[footnote 40] for immediate custodial sentences were the highest for Black ethnic groups, at 89%, followed closely by Mixed and White ethnic groups at 86%, and Other and Asian ethnic groups at 83%.
- Over the past 5 years, concordance rates have been fairly consistent for all defendants, with immediate custodial sentences ranging from 82% to 93% and community sentences ranging from 44% to 54%.
5.4 Sentencing Outcomes[footnote 41]
In 2024 the proportion of sentencing outcomes was similar across all ethnic groups with immediate custody accounting for 34% of all offenders sentenced (where ethnicity is known). Immediate custody continues to be the most common sentence given for indictable offences and the custody rate ranged from 33% for White defendants to 29% for defendants from the Other ethnic group.
Sentencing outcomes are dependent on various factors, such as previous offending history, offence motivations, stage of plea or any other associated mitigating and aggravating factors. Whilst there are minimal differences observed between ethnicities, further analysis using logistic regression highlights disparities when these factors are controlled (for more information, see the ‘Offence Analysis’ chapter).
Figure 5.05a: Percentages of sentencing outcomes for all ethnicities, indictable offences, 2024, England and Wales
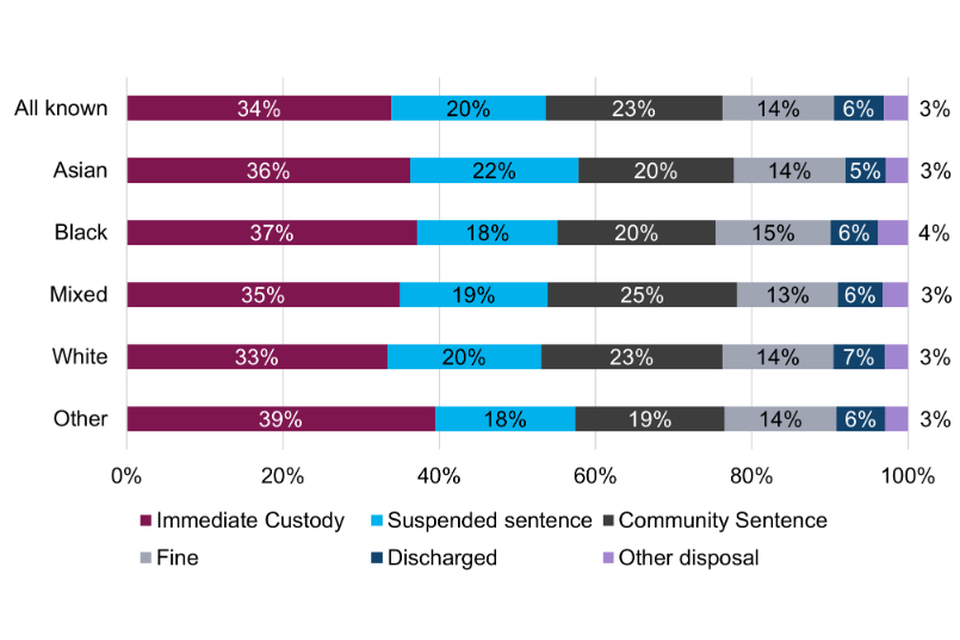
(Source: Ministry of Justice - Criminal Justice Statistics Quarterly: year ending December 2024 – Outcomes by Offence data tool)
Over the past 5 years, the overall custody rate for indictable offences remained stable between 33% and 35%, where ethnicity was known. The greatest increase in custody rate was seen for the Asian ethnic group, increasing by 5 percentage points to 37% in 2024 whilst the custody rate for White offenders decreased from 34% in 2020 to 33% in 2024.
Average Custodial Sentence Length (ACSL)
The ACSL for indictable offences[footnote 42] increased from 19.3 months in 2020 to 20.1 months in 2024[footnote 43]. However, this increase has not been consistent, with ACSL peaking in 2021 at 23.4 months.
Over the past 5 years, the ACSL was consistently lower for White defendants compared to each other ethnic group.
-
In 2024, the ACSL was 18.4 months for White defendants, compared to 32.2 months for Asian defendants (75% longer), 28.6 months for Black defendants (55% longer), 22.9 months for Mixed ethnic group defendants (24% longer) and 22.2 months for the Other ethnic group (21% longer).
-
The differences in ACSL can be attributed to a range of factors, including the varying offence mix across ethnic groups (see Chapter 9: Offence Analysis). The lower ACSL for White defendants may be a result of a higher guilty plea rate for this ethnic group, resulting in reduced sentences.
5.5 Guilty plea
The guilty plea rate[footnote 44] is the number of defendants pleading guilty as a proportion of all defendants with a plea entered.
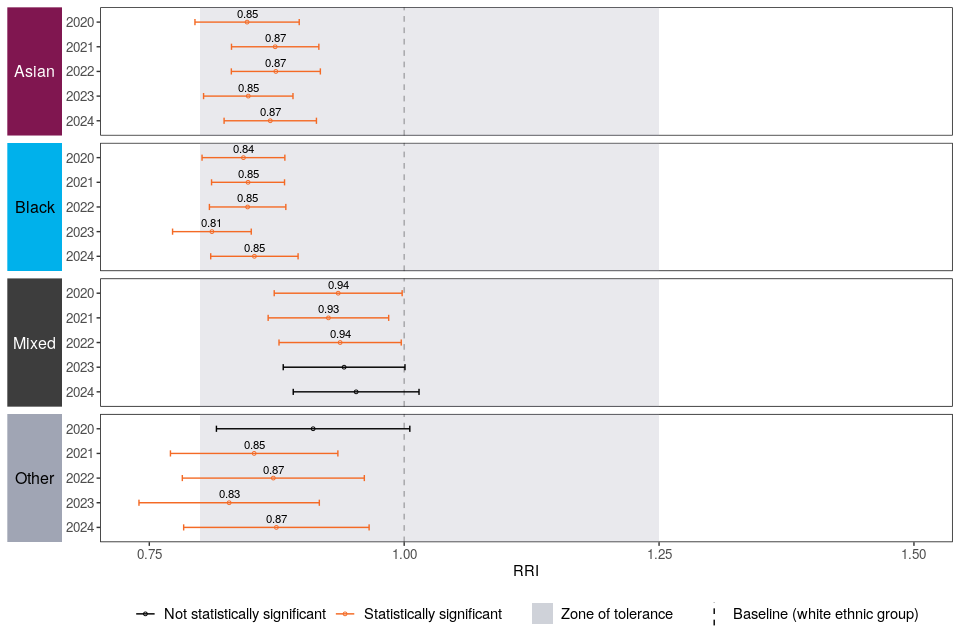
Figure 5.06: RRI for ethnic groups relative to the White group: proportion of defendants who entered a guilty plea (of all pleas entered), for indictable offences, at the Crown Court, 2020-2024, England and Wales
(Source: Ministry of Justice – Ethnicity and the Criminal Justice System: Chapter 5: Defendants – Table 5_17 [derived from MoJ, CJSQ])
The guilty plea rate of defendants who were committed for trial at Crown Court for indictable offences in 2024 remained consistent with the previous year. Over the past 5 years, White defendants consistently had the highest guilty plea rate, ranging between 63%-77%.
- In 2024, the White ethnic group had the highest guilty plea rate, at 63%, followed by defendants of Mixed ethnic group at 61%, Other ethnic group at 56%, Asian ethnic group at 55% and Black ethnic groups at 54%.
Relative Rate Index analysis shows that White defendants were more likely than all other ethnic groups to plead guilty for indictable offences (not controlling for other factors).
- In 2024, defendants from Black ethnic groups were 15% less likely to enter a guilty plea than White defendants. Similarly, Asian and Other ethnic groups were 13% less likely.
5.6 Case Management[footnote 45]
Effectiveness of Crown Court trials
Since 2023, the effective trial rate across ethnic groups has fluctuated between 43% and 46% with a value of 43% in March 2025. In 2024, the effective trial rate was highest for cases involving defendants from the Black ethnic group at 45%, and lowest for defendants from the Mixed ethnic groups at 40%.
Waiting times at the Crown Court[footnote 46]
Across all ethnic groups, the median waiting time decreased for 2024 when compared to 2023.
-
In 2024, the median waiting time ranged from 17.0 weeks for the White ethnic group to 24.9 weeks for the Black and Asian ethnic groups, which reflects the lower guilty plea rates amongst Black and Asian groups, which increases waiting times as more time is taken to prepare for trial.
-
For those remanded in custody, the median waiting time was between 14.4 for White and 23.3 weeks for Black ethnic groups.
-
For those bailed, the median waiting time ranged between 22.3 and 43.3 weeks, with those from the Black ethnic group experiencing the longest median waiting times at 43.3 weeks, compared to 22.3 weeks for White defendants.
Crown Court timeliness
The average number of days from charge to completion for defendants dealt with in Crown Court cases varied across ethnic groups. In 2024, White defendants had the lowest median at 150 days, while defendants from the Black ethnic group had the highest median at 243 days.
This trend of lower timeliness for White defendants was seen across multiple offence groups, including violence against the person, sexual offences and drug offences.
5.7 Criminal legal aid
Criminal legal aid consists of legal advice and representation provided to people being investigated or charged with a criminal offence, covering police stations, prisons, and the courts. Criminal legal aid can be split into two categories, crime higher and crime lower. Crime higher concerns legal representation in the Crown Court and above. Crime lower work is carried out by legal aid providers at police stations, in magistrates’ courts and prison. Crime lower work tends to be relatively high volume, lower cost units of criminal legal aid work.
Crime lower[footnote 47]
Figure 5.07: Crime lower legal aid workload, by ethnicity and legal aid category, 2024, England and Wales
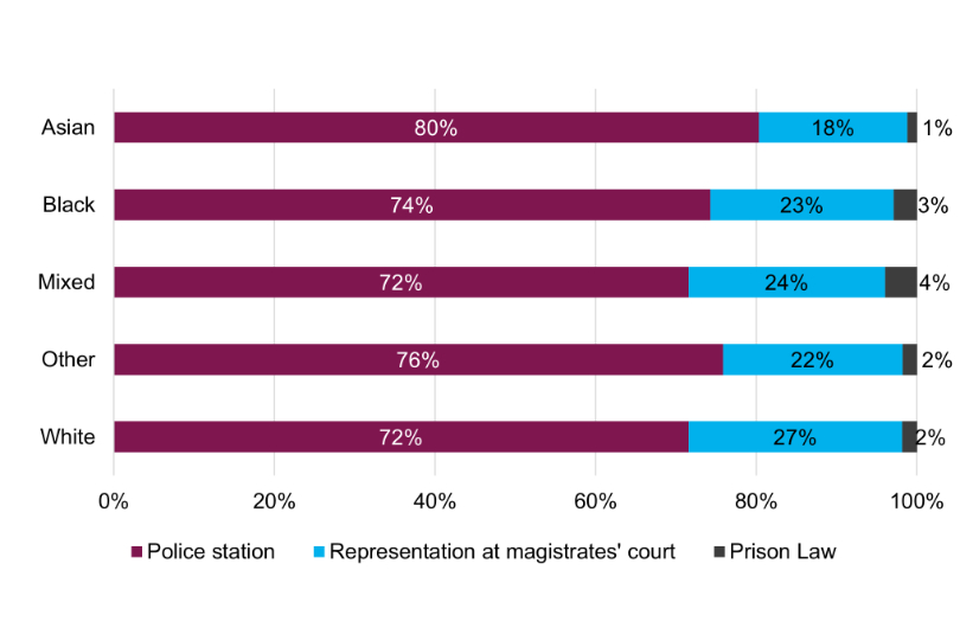
(Source: Ministry of Justice – Ethnicity and the Criminal Justice System: Chapter 5: Defendants – Table 5.01)
In 2024, 77% of crime lower legal aid workload was for White clients, with 8% for clients from Asian, 7% from Black, 6% from Other and 3% from Mixed ethnic groups. These proportions have remained relatively stable over the past 5 years.
Police station advice and magistrates’ court representation constitute most of the total crime lower workload (98%) - with police station advice making up 73% of the workload in 2024. Prison law comprised only 2% of the workload, which has remained stable over the past 5 years.
Of those who received legal aid, a larger proportion of White defendants (27%) received representation at magistrates’ court compared to each ethnic group, with Mixed ethnic groups at 24%, Black and Asian at 18%, and the Other ethnic group at 22%. Conversely, higher proportions of clients from all other ethnic groups combined received pre-charge advice.
Crime higher[footnote 48]
In 2024, 80% of crime higher legal aid workload was for White clients, with 9% for Asian, 8% for Black and 3% for Mixed ethnic group clients. These proportions have remained stable over the last 5 years.
Half of the crime higher workload was for offences which can be tried before either the magistrates’ court or the Crown Court, ranging between 49% and 55% by ethnic group.
White clients had a higher proportion of representation at committals for sentence at 21%, compared to all other ethnic groups (13-17%), whilst higher proportions of clients from ethnic minorities (excluding White minorities) received representation for indictable trials at 36% for Black, 33% for Mixed ethnic group and 31% for Asian compared to 28% for White clients, reflecting variation seen in plea rates.
Prison representation[footnote 49]
In 2024, 74% of the legally aided prison law workload related to White defendants, 10% to Black, 6% to Other, and 5% to Asian and Mixed ethnic groups. Over the past 5 years, these numbers remained stable with White defendants having the highest proportions of the legally aided prison law workload.
6. Offender Management
A greater proportion of children in prison were from minority ethnic groups when comparing to the proportion across all age groups.
The ethnicity of prisoners varied across age groups, with a higher proportion of younger prisoners being from minority ethnic groups (59% of under 18-year-olds). In contrast, 84% of prisoners aged 50 or over were White.
Black prisoners served the greatest proportion of their original sentence in custody.
In line with previous years, Black defendants continued to serve a greater proportion of their original determinate sentence in custody (62% in 2024) but this has fallen from a series peak of 68% in 2022.
In the 2024/25 HM Inspectorate of Prisons survey, prisoners from ethnic minority groups reported more negative results across the survey.
A higher proportion of White prisoners generally reported more positive experiences within prisons, including feeling respected by and receiving less abuse/victimisation from staff, spending less nights in segregation, feeling safe, prompt handling of complaints, food and canteen services and having enough cleaning facilities.
This chapter provides statistics relating to offenders in custody or under supervision in the community. Much of this information has previously been published in the Offender Management statistics quarterly publication, where statistics on adjudications, Home Detention Curfew, Release on Temporary Licence and Licence Recalls can also be found.
Further information on the following topics related to offender management are available online: Safety in Custody, Substance Misuse Treatment Programmes.
The HMPPS Offender Equalities report 2023/24 also includes information on: Mother and Baby units, Sexual Orientation in the Prison Population, Transgender Prisoners, Accredited Programmes, Incentives and Earned Privileges.
6.1 Prison Population
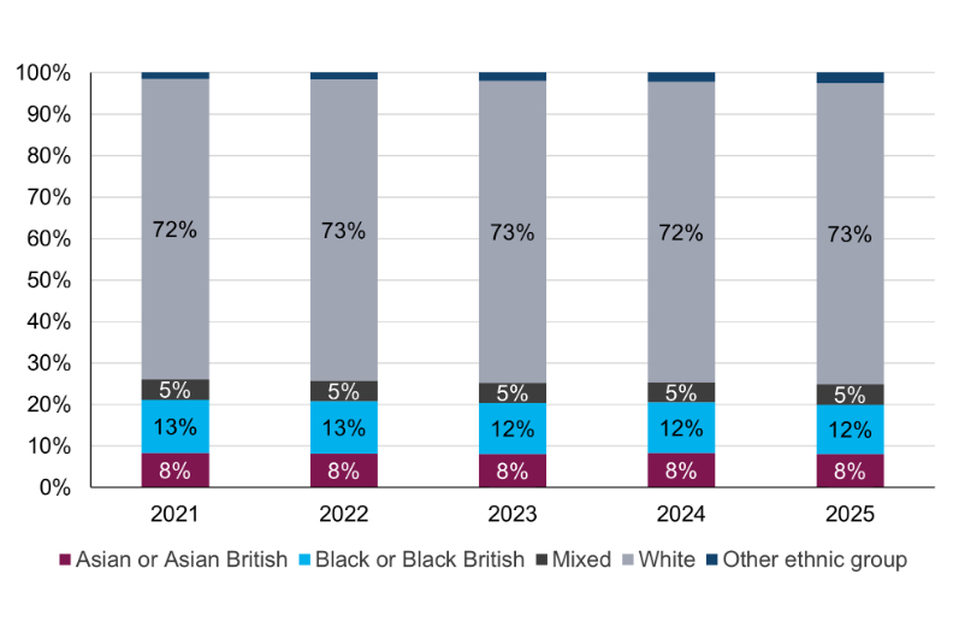
The total prison population in England and Wales was 87,334 on 30th June 2025. The proportions of ethnic groups in the prison population have remained stable across the past 5 years. In June 2025, of prisoners whose ethnicity was known[footnote 50], 73% were White, 12% Black, 8% Asian, 5% Mixed ethnic group and 3% from Other ethnic groups.
Figure 6.01: Number and proportion of prisoners by ethnicity, England and Wales, years ending June 2021 to 2025
(Source: Ministry of Justice – Ethnicity and the Criminal Justice System: Chapter 6: Offender Management – Table 6_01 [derived from MoJ, OMSQ])
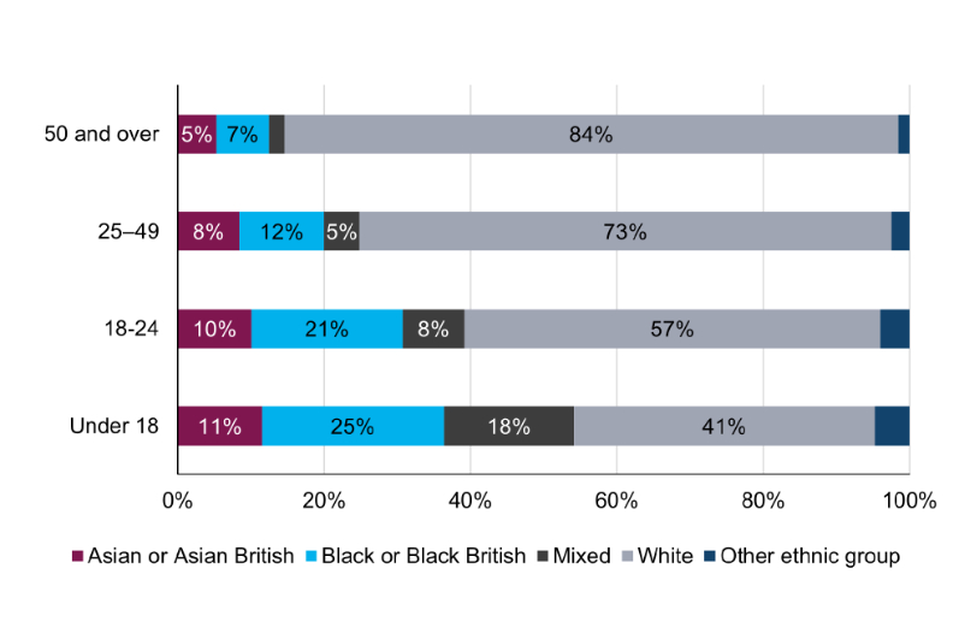
The ethnicity of prisoners varied across age groups, with a higher proportion of younger prisoners being from minority ethnic groups.
- This is continuing to grow with 59% of under 18-year-olds from minority ethnic groups in year ending June 2025 compared with 53% in year ending June 2021.
- In contrast, 84% of prisoners aged 50 or over were White in 2024, similar to levels in year ending June 2021.
Black and Mixed ethnicity prisoners were disproportionately represented across all younger age groups.
- In year ending June 2025, Black offenders made up 25% of the prison population for under 18-year-olds and 21% of those aged 18 – 24 years old, despite Black offenders accounting for only 12% of the whole prison population.
- Similarly, prisoners of Mixed ethnic groups made up 18% of all prisoners under 18 years old and 8% of those aged 18 -24 years old, yet only account for 5% of the whole prison population.
Figure 6.02: Proportion of prisoners by ethnicity and age group, England and Wales, 30th June 2025
(Source: Ministry of Justice – Ethnicity and the Criminal Justice System: Chapter 6: Offender Management – Table 6_01 [derived from MoJ, OMSQ])
6.2 Proportion of custodial determinate sentence served
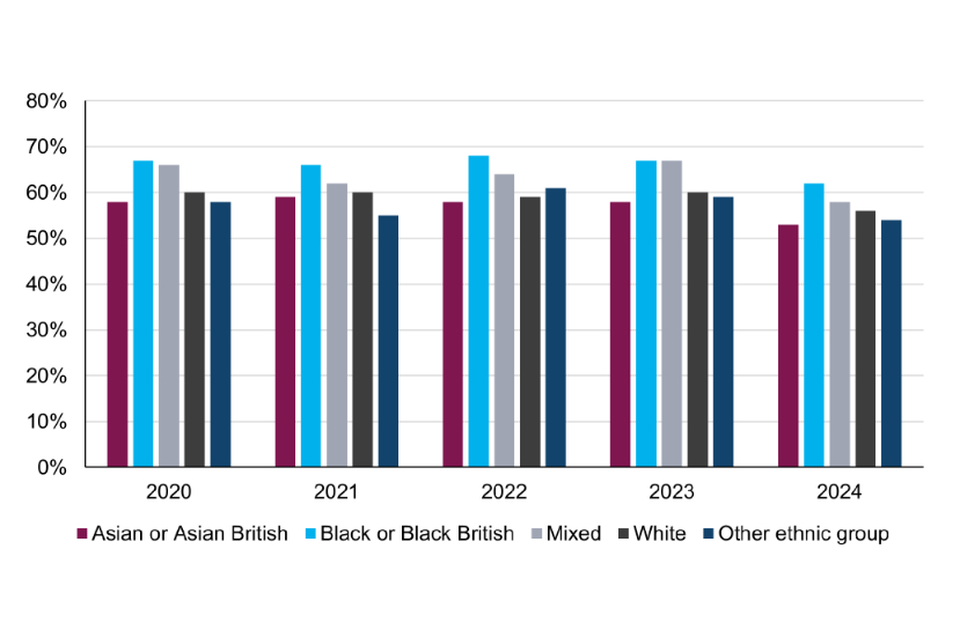
White prisoners have consistently received the shortest average sentence length in comparison to other ethnic groups. This section looks at the proportion of determinate[footnote 51] sentences served[footnote 52].
Asian prisoners, on average, served the smallest proportion of their original sentence across the series, serving 53% of their determinate sentence in custody in 2024 (the lowest in the series). Since 2020, Black prisoners have consistently served a higher proportion of their determinate sentence, at 62% in 2024.
The proportion of determinate sentences served is affected by factors such as offence mix and behaviour in prison. In addition to this, the government announced a reduction in the proportion of certain custodial sentences served in prison (from a 50% conditional release point to 40% for certain groups), enforced from September 2024.
Figure 6.03: Average proportion of determinate sentence served in custody by ethnicity, England and Wales, 2020 to 2024
(Source: Ministry of Justice – Ethnicity and the Criminal Justice System: Chapter 6: Offender Management – Table 6_02 [derived from MoJ, OMSQ])
6.3 Prison Experience
His Majesty’s Inspectorate of Prisons for England and Wales (HMI Prisons) is an independent inspectorate that scrutinises the conditions and treatment of prisoners and other detainees, assessing whether detention is humane, safe, respectful and helps to prepare people for release. HMI Prisons conducts a detainee survey as part of each inspection. Detainee surveys from the HMI Prisons 2024-25 annual reporting year have been broken down by ethnic groups for this report. Differences between groups have not been tested for statistical significance.
- Female White and Asian prisoners reported more positive experiences on their wing/houseblock compared to others, reporting having much greater availability of clean clothing and bedding and more prompt answers to cell bell calls than those of other ethnicities.
- White male prisoners reported more positive relationships with staff, with 75% reporting feeling that they were treated with respect by staff, in comparison to a range of 64-67% of male prisoners from ethnic minority groups. Within female prisons, 93% of Asian, and 62% of White prisoners felt encouraged to support each other, compared to only 29% and 40% of Black and Mixed ethnicity female prisoners, respectively.
- A higher proportion of male prisoners from ethnic minority groups reported experiencing a form of verbal abuse/intimidation, physical or sexual assault, theft, and other types of victimisation from prison staff; 45% for Black prisoners, 43% for Other ethnicities, 40% for Mixed ethnic group, and 38% of prisoners of Asian ethnicity, compared to 30% of White prisoners. This is similar within female prisons, with 60% of Mixed ethnic group reported experiencing bullying by staff compared to the other ethnicities, which fell between 25%-32%.
- Reports from male prisoners of verbal abuse, intimidation, physical or sexual assault, theft, and other forms of victimisation by other prisoners ranged between 21% and 39%. Prisoners from ‘Other’ ethnicities reported the highest levels (39%), while Black prisoners reported the lowest (21%).
- In female prisons, prisoners from Mixed ethnic backgrounds (70%) and Asian backgrounds (54%) reported the highest levels of victimisation by other prisoners, whereas Black prisoners reported the lowest (29%).
6.4 Parole board[footnote 53]
The parole board carry out risk assessments on prisoners to determine whether they can be safely released into the community. Recommendations can also be made for a prisoner to remain in the open prison estate.
In the year ending March 2025, there were 6,606 oral parole board hearings where ethnicity was recorded[footnote 54]. Of these, 80% were White, 11% Black, 5% Asian, 4% Mixed ethnicity, and 1% Chinese or Other ethnicities. These proportions have remained stable since year ending March 2020.
The proportion of White, Black, Asian, and Mixed ethnic group offenders that received an oral parole hearing in the year ending March 2025 remained relatively stable with a range of 39%-51% receiving a release result, 6%-8% remaining in open prison estate, and 42%-47% receiving a refusal of release.
6.5 Probation
The Probation Service supervises offenders living in the community under a court order[footnote 55], including those starting supervision because of a community or suspended sentence and those who have been released from prison on licence.
In 2024, where ethnicity was known, the number of requirements started under community orders rose to 101,477[footnote 56]; an increase of 10% since 2022. In addition, a 23% increase was seen in requirements started under suspended sentence orders since 2022.
- Of offenders receiving either type of order, 81% were White, 6% Black, 6% Asian, 4% Mixed ethnic group and 2% Other ethnic groups. These proportions have remained relatively stable when compared to 2022.
Of those who received either a community or suspended sentence order, rehabilitation requirements were fairly consistent across all ethnicities.
- Higher proportions of Other (43%), Asian (40%), Black (35%) and Mixed (31%) offenders received unpaid work requirements than White offenders (26%).
Figure 6.04: Requirements commenced under community orders and suspended sentence orders by ethnicity and requirement, England and Wales, 2024
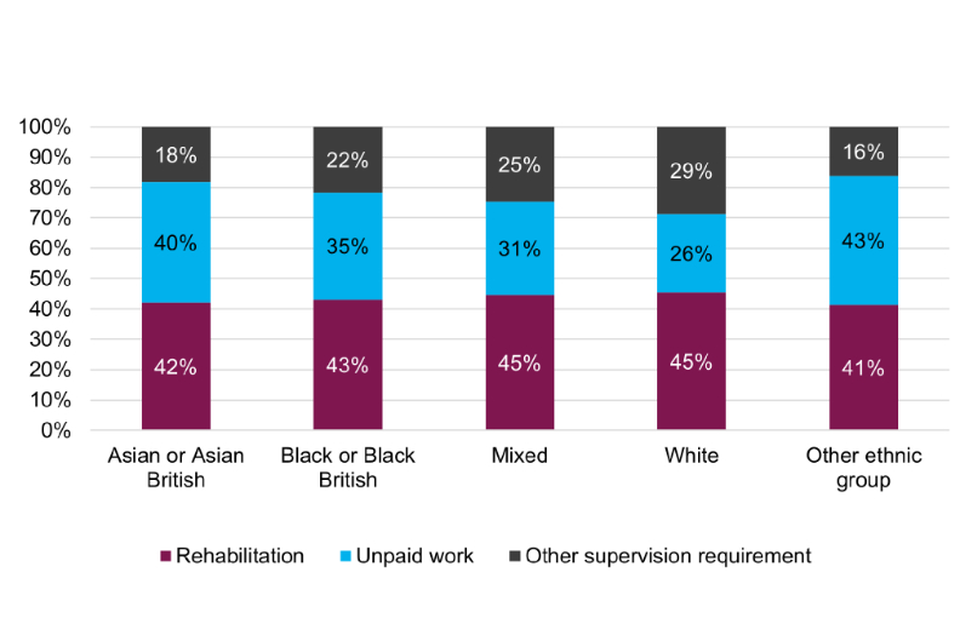
(Source: Ministry of Justice – Ethnicity and the Criminal Justice System: Chapter 6: Offender Management – Table 6_03 [derived from MoJ, OMSQ])
Of the 63,156 offenders supervised on post release licence in 2024, the proportions across ethnic groups remained in line with that of the previous five years - 73% were White, 11% Black, 8% Asian, 5% Mixed ethnic group and 2% Other ethnicities. All ethnic groups have seen increases in the volume of offenders supervised on post release licence.
7. Offender characteristics
A higher proportion of prosecutions for Black and Mixed ethnic groups were against children, 13% and 8%, respectively, compared to 3% for defendants from the White ethnic group.
In 2024, children from the ‘Other’ ethnic group received longer custodial sentences, at 28.6 months on average, an increase of 5.9 months compared to 2019 (22.7 months).
The reoffending rate of adults was highest for those aged 18-20 for most ethnic minority groups.
The reoffending rate for offenders from the Black and ‘Other’ ethnic groups was highest for those aged 18-20. For offenders from the White ethnic group, those aged 35-39 presented the highest reoffending rate.
The educational attainment of young people who were cautioned or sentenced for an offence was lowest for the White ethnic group, across all three measures.
Young people cautioned or sentence for an offence showed a higher incidence of eligibility for free school meals, having special educational needs and being absent from school (persistent, suspended or excluded) when compared to the wider pupil population.
This chapter looks at the interaction between ethnicity and other key characteristics, including sex and age, within the criminal court system, using data from Criminal Justice System statistics: year ending December 2024.
To note, we refer only to the most serious (indictable) offences[footnote 57] throughout the court statistics portion of this chapter, due to ethnicity being largely unknown for less serious (summary) offences.
This chapter also includes analysis on:
-
Educational attainment, and overall educational background of offenders through a data sharing exercise between Ministry of Justice (MoJ) and Department for Education (DfE).
7.1 Sex and Ethnicity[footnote 58][footnote 59]
Prosecutions and Convictions
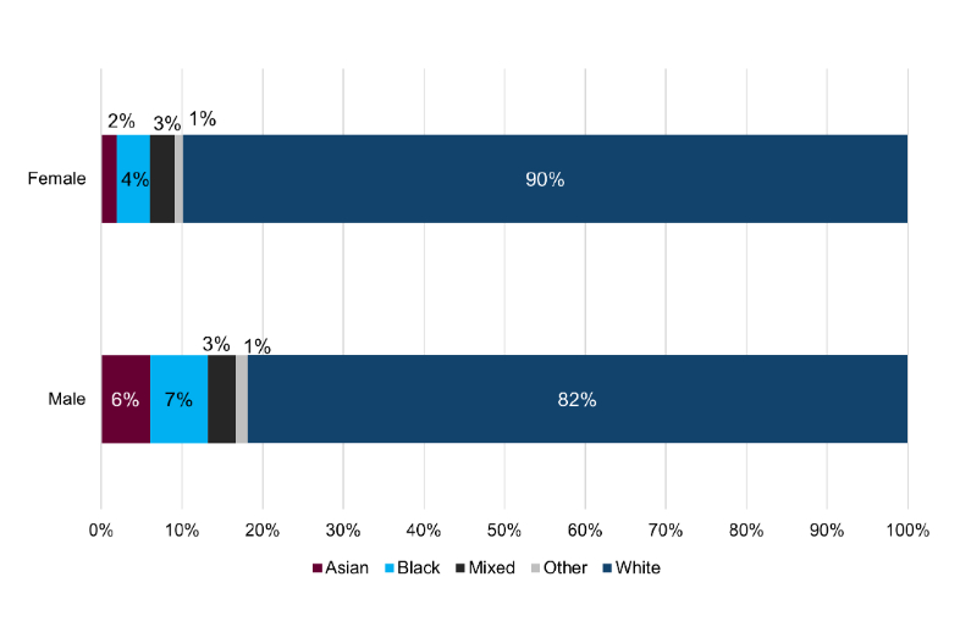
Ethnic minority groups accounted for a higher proportion of male prosecutions and convictions compared to females for indictable offences.
Male offenders from the White ethnic group represented 82% of prosecutions and 67% of convictions, while females from the White ethnic group accounted for 90% and 77%, respectively.
-
The proportions have increased for both males and females for prosecutions across the last 5 years, the White ethnic group represented 75% of male prosecutions and 87% female prosecutions in 2020.
-
The proportions for both male and female convictions have decreased across the last 5 years, the White ethnic group represented 78% of male convictions and 88% of female convictions in 2020.
Figure 7.01: Proportion of prosecutions for indictable offences by sex and ethnicity, England and Wales, 2024
(Source: Ministry of Justice – Criminal Justice Statistics Quarterly: year ending December 2024 – Outcomes by Offence data tool)
Remands[footnote 60]
For indictable offences, females across all ethnic groups had lower proportions of defendants remanded in custody compared to males, both at magistrates’ courts and at the Crown Court.
-
The highest proportion of females remanded in custody at magistrates’ courts was across the Black ethnic group (18%), followed by the Mixed (17%), Asian (13%), Other (11%), and White (11%) ethnic groups.
-
In contrast, males from Other ethnic groups presented the highest proportion of defendants remanded in custody (33%), followed by the Black and Mixed (31% each), Asian (29%), and White (25%) ethnic groups.
Average Custodial Sentencing Length (ACSL)
In 2024, for indictable offences, both male and female offenders showed the same trend across ethnic groups:
-
Offenders from the Asian ethnic group had the longest ACSL, at 32.4 months for male and 22.6 months for female with Bangladeshi offenders having the longest ACSL, at 38.6 for male and 22.1 months for female.
-
Male and female offenders from the Other ethnic group had the shortest ACSL, at 19.1 months and 9.6 months, respectively. Differences in offence mix seen across both sex and ethnicity will contribute to the observed disparity between groups when comparing ACSL.
Differences in offence mix seen across both sex and ethnicity will contribute to the observed disparity between groups when comparing ACSL.
Figure 7.02: Average custodial sentence lengths (ACSL) for indictable offences, by sex and ethnicity, England and Wales, 2024
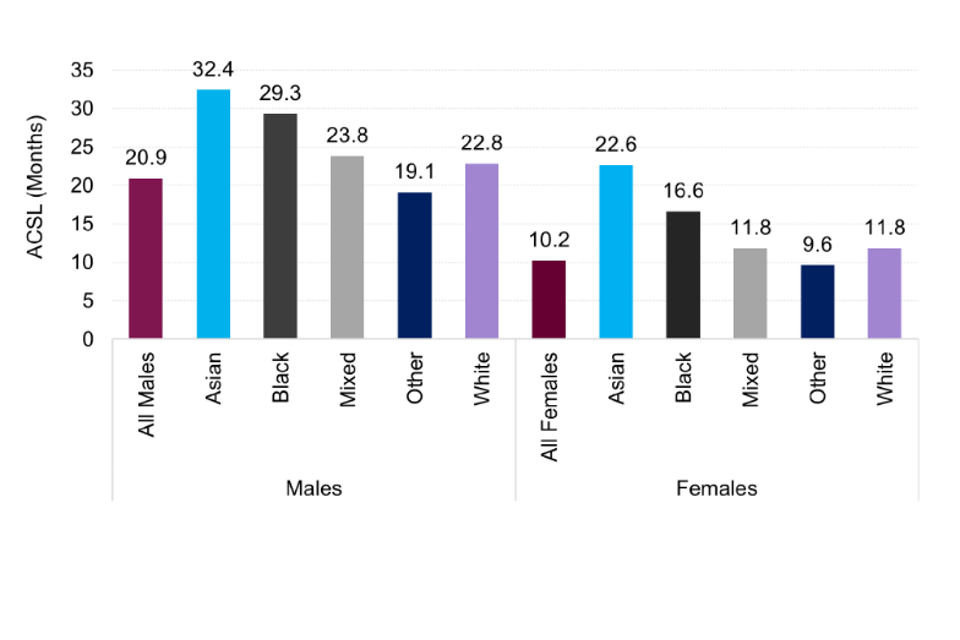
(Source: Ministry of Justice – Criminal Justice Statistics Quarterly: year ending December 2024 – Outcomes by Offence data tool)
7.2 Age[footnote 61]
Prosecutions
In 2024, over 80% of White defendants proceeded against were aged over 25 and just 3% under 18. The proportion of defendants proceeded against who were under 18 was higher in all other ethnic groups, particular in the Other (13%) and Mixed (9%) ethnic groups.
Figure 7.03: Age of defendants proceeded against at court for indictable offences by ethnicity, England and Wales, 2024
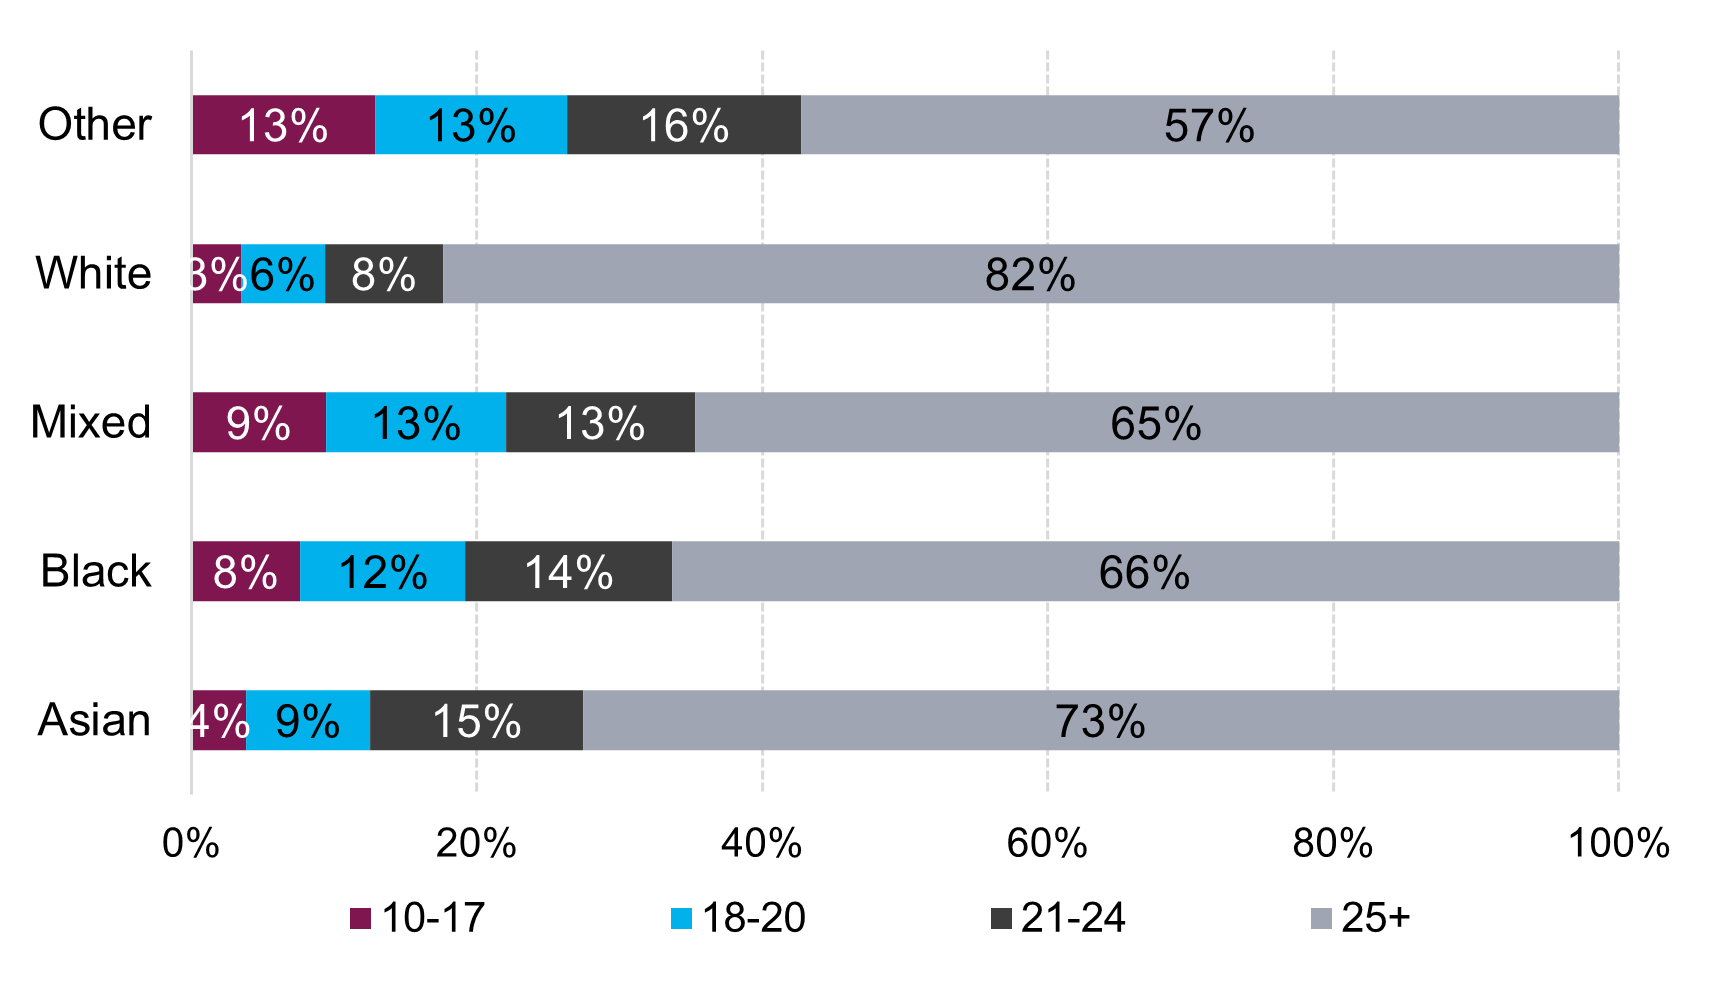
(Source: Ministry of Justice – Criminal Justice Statistics Quarterly: year ending December 2024 – Outcomes by Offence data tool)
Remands
In 2024, 7% of White defendants aged under 18 were remanded in custody at magistrates’ courts. This was the lowest percentage seen by ethnicity for child defendants - Asian ethnic group at 13%, Black ethnic group at 11% and Mixed ethnic group at 10%.
The remand rate for child defendants at the Crown Court was broadly similar across Black (50%) and White (49%) ethnic groups. This follows falls seen since 2020 and a convergence in observed rates. Due to the small population of children from the Asian, mixed, and other ethnic groups, these are subject to greater variance across the years and have therefore been omitted from this comparison.
Custody Rate[footnote 62] and Average Custodial Sentence Length (ACSL)
The overall custody rate for children has decreased in the last five years, from 8% in 2020 to 6% in 2024. In comparison, the custody rate for adult offenders is unchanged at 35%.
- The custody rate for children from the Black ethnic group had the largest decrease of 4 percentage points, from 10% in 2020 to 6% in 2024.
Of all children sentenced to immediate custody in 2024, those from the White ethnic group had the lowest ACSL at 14.7 months, this is in line with adult offenders. Children from Other ethnic groups had the longest ACSL, at 28.6 months.
Figure 7.04: Average custodial sentence length (ACSL) for indictable offences, by age group and ethnicity, England and Wales, 2024
(Source: Ministry of Justice – Criminal Justice Statistics Quarterly: year ending December 2024 – Outcomes by Offence data tool)
7.3 Offender Histories
A first-time offender is an offender who has been arrested by police in England or Wales; and who has received a first conviction, caution, or youth caution for any offence[footnote 63] recorded on the Police National Computer. For example, an offender who had a conviction or caution outside England and Wales and was arrested by a police force in England and Wales would be counted as a first-time offender.
-
For indictable offences in 2024, Middle Eastern[footnote 64] offenders had the highest proportion of first-time offenders, at 44%, followed by the Asian[footnote 65] (32%) and Black ethnic groups (19%).
-
The lowest proportion of first-time offenders was seen in the White[footnote 66] ethnic group (18%). The White ethnic group had a higher proportion of offenders with a long history of offending, at 34% with 15 or more previous convictions or cautions.
-
The proportion of child offenders with 15 or more previous cautions and convictions was 1%. The Middle Eastern ethnic group and Asian had higher rates of first-time offenders, at 68% and 63%, respectively, compared to the White ethnic group at 55%, and the Black ethnic group at 53%.
-
For child offenders all ethnic groups present a higher number of first-time offenders compared to offenders with previous offending history.
7.4 Proven reoffending
An offender is included in this cohort if they were released from custody, received a non-custodial conviction at court, or received a reprimand, warning, or caution in the 12 months to March 2023.
A proven reoffence is defined as any offence committed in a one-year follow-up period following that resulted in a court conviction, caution, reprimand or warning in this timeframe, or a further six-month waiting period to allow the offence to be proven in court.
Adults
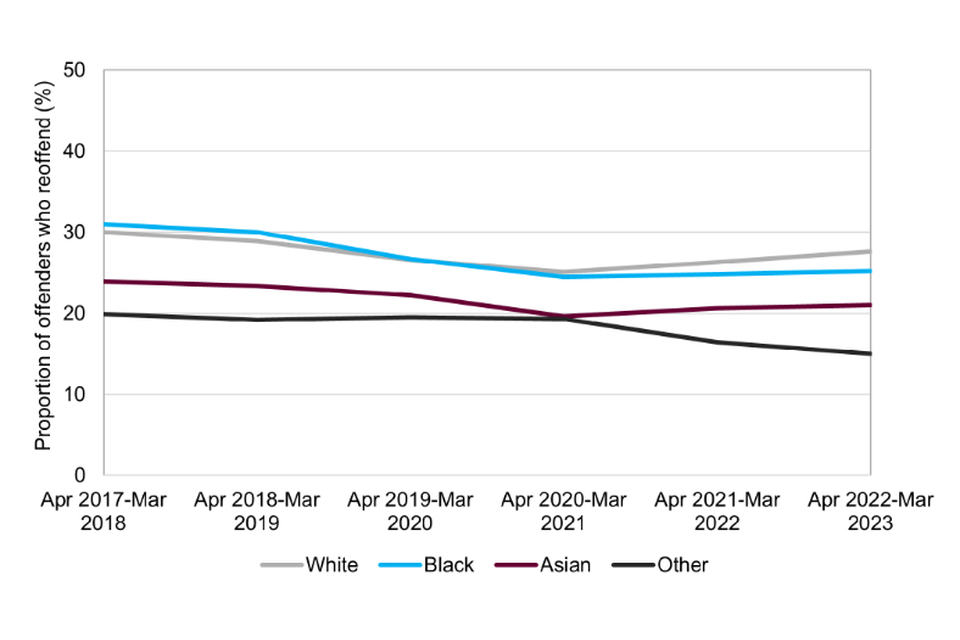
In the 2022/23 cohort[footnote 67] , the reoffending rate for adults was highest for offenders from the White ethnic group at 28%, closely followed by the Black ethnic group at 25%. The White ethnic group also had the highest average number of reoffences per reoffender, at 4.1 reoffences.
Figure 7.05: Adults proven reoffending rate, by ethnicity, annual averages (2017/18 to 2022/23), England and Wales
(Source: Ministry of Justice – Proven Reoffending Statistics: Apr 2022 to March 2023)
The reoffending rate for adult offenders from Black and Other ethnic groups was highest for those aged between 18 to 20. In contrast, the proportion of reoffending for adult offenders from the White ethnic group was highest for those aged 35 to 39.
Figure 7.06: Adult reoffending rate, by age group and ethnicity, April 2022 to March 2023 offender cohort, England and Wales
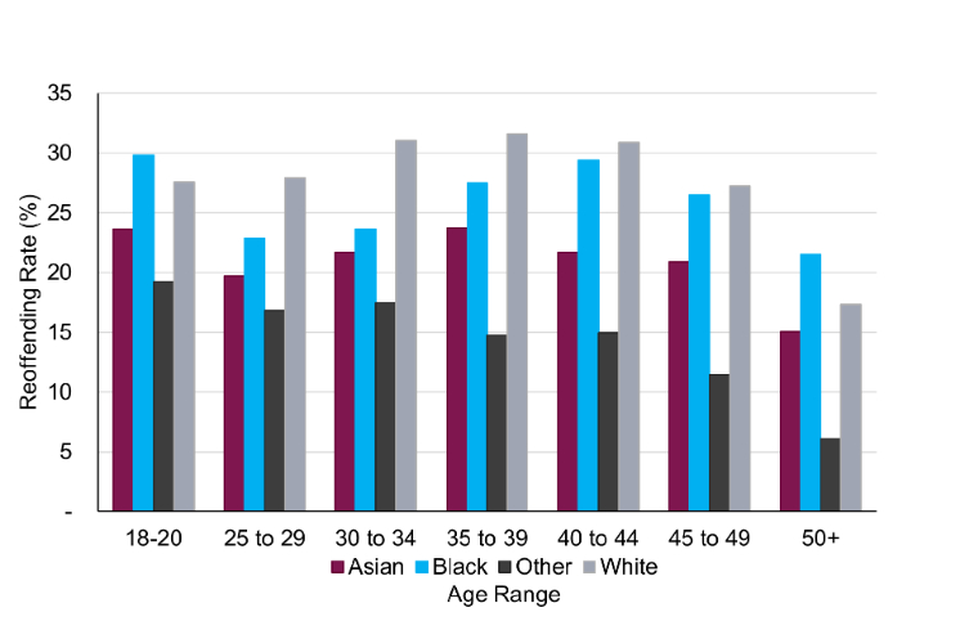
(Source: Ministry of Justice – Proven Reoffending Statistics: Apr 2022 to March 2023)
The reoffending rate for children was higher across all ethnic groups compared to adults. The proportion of child offenders who reoffend was higher across the Black ethnic group, at 38.0% in the 2022/23 cohort, and has been consistently higher over the last five years, compared to other ethnicities.
The reoffending rate has tended to fall compared to 2017/18 across all ethnic group, with the largest reduction seen in the Black ethnic group, decreasing 9.0 percentage points.
7.5 Educational background of young people who had been cautioned or sentenced for an offence[footnote 68]
Findings from a data sharing exercise between MoJ and the Department for Education (DfE) are presented here, with analysis on a matched cohort of those who were in year 6 in either 2008/09 or 2009/10 and who were aged ten at the start of those academic years and were in year 11 at the end of Key Stage 4 (KS4)[footnote 69]. These findings are for England only.
To avoid inconsistency in the length of their offending histories, for those with a KS2 academic year of 2008/09 their offending data has been considered up to 31 December 2020 and for those with a KS2 academic year of 2009/10 it has been considered up to 31 December 2021.
This analysis compares the police identified ethnicities in the matched cohort of young people cautioned or sentenced for an offence, broken down by disposal type, educational attainment, pupil characteristics, persistent absence and exclusion. Results are provided for the all-pupil cohort for comparison purposes[footnote 70].
Educational Attainment at Key Stage 4 (KS4)[footnote 71]
Across all three attainment measures, the educational attainment of young people who had been cautioned or sentenced for an offence was lowest for the White ethnic group. This was also largely consistent across all disposal types.
-
Attainment varied amongst the different ethnic groups across the three attainment measures and disposal types, though attainment tended to be highest for the Asian and Other[footnote 72] ethnic group.
-
The proportion of young people who had been cautioned or sentenced for an offence who achieved 5 or more GCSEs (or equivalents) graded A* to C, including English and Maths, was highest among those in receipt of a fine. This was higher for the Asian (29%) and Other (22%) ethnic groups than it was for White and Black (both 20%) ethnic groups.
-
The wider attainment measure of 5 or more GCSEs (or equivalents) graded A* to G, including English and Maths, was achieved by a greater proportion of pupils but followed a similar pattern. Achievement was lower than the proportion of the all-pupil population achieving this attainment level (89%).
Figure 7.08: Proportion of young people cautioned or sentenced for an offence who matched to a Key Stage 4 attainment record in academic years 2013/14 and 2014/15, and all-pupil population, by ethnicity, in England
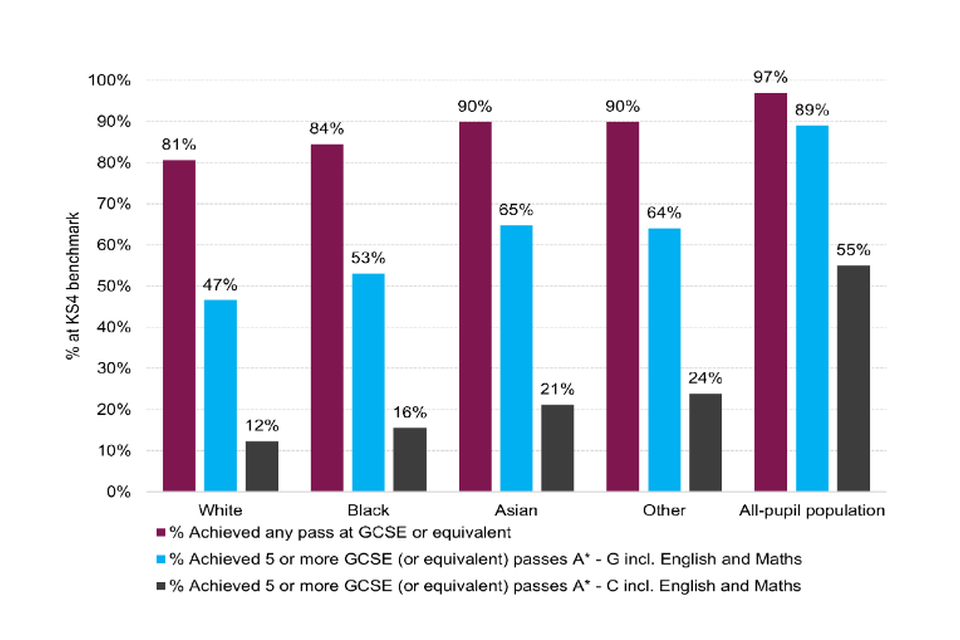
(Source: Ministry of Justice – Ethnicity and the Criminal Justice System: Chapter 7: Offender Characteristics – Table 7.01 [derived from MoJ/DfE Data Share])
Free School Meals[footnote 73]
Where ethnicity was recorded in the data, more than half of young people who had been cautioned or sentenced for an offence were eligible for FSM: White (52%), Black (63%), Asian (56%), and Other (66%). This contrasts with the proportion of pupils in the all-pupil population where 24% were eligible for FSM.
-
The FSM eligibility of young people who had been cautioned or sentenced for an offence was higher for the Black and Other ethnic groups across all disposal types compared to the White and Asian Ethnic groups.
-
The largest difference in FSM eligibility across the ethnic groups was among those who had received a fine, where 59% of the Black ethnic group where eligible for FSM compared to 41% of the White ethnic group.
Figure 7.09: Proportion of young people who had been cautioned or sentenced for an offence matched to a Key Stage 4 academic year of 2013/14 or 2014/15, known to be eligible for free school meals, by ethnicity, in England
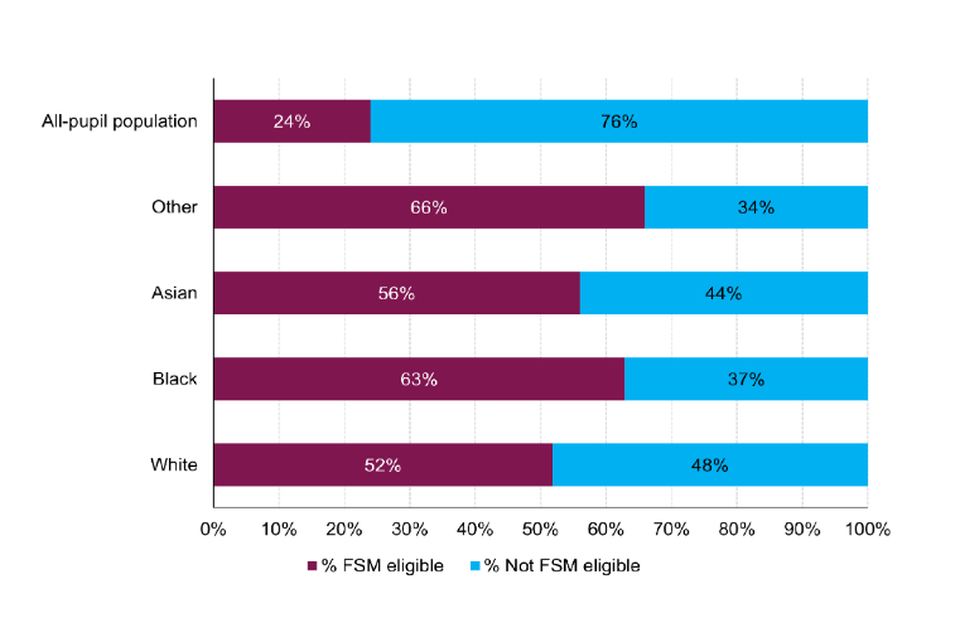
(Source: Ministry of Justice – Ethnicity and the Criminal Justice System: Chapter 7: Offender Characteristics – Table 7.02 [derived from MoJ/DfE Data Share])
Special Educational Needs(SEN)[footnote 74]
Overall, more than half of young people cautioned or sentenced for an offence had been recorded as having SEN support[footnote 75]. Across almost all disposal types there was a larger proportion of young people within the Black and Other ethnic groups recorded as having SEN support compared to the White and Asian ethnic groups.
- Of the young people cautioned or sentenced for an offence, a greater proportion of the White (15%) and Black (11%) ethnic groups were recorded as having SEN with an Education, Health and Care (EHC) plan[footnote 76] compared to the other ethnic groups and much higher than the all-pupil population (4%).
Figure 7.10: Proportion of young people cautioned or sentenced for an offence matched to a Key Stage 4 academic year of 2013/14 or 2014/15, and all-pupil population, with Special Educational Needs, by ethnicity, in England[footnote 77]
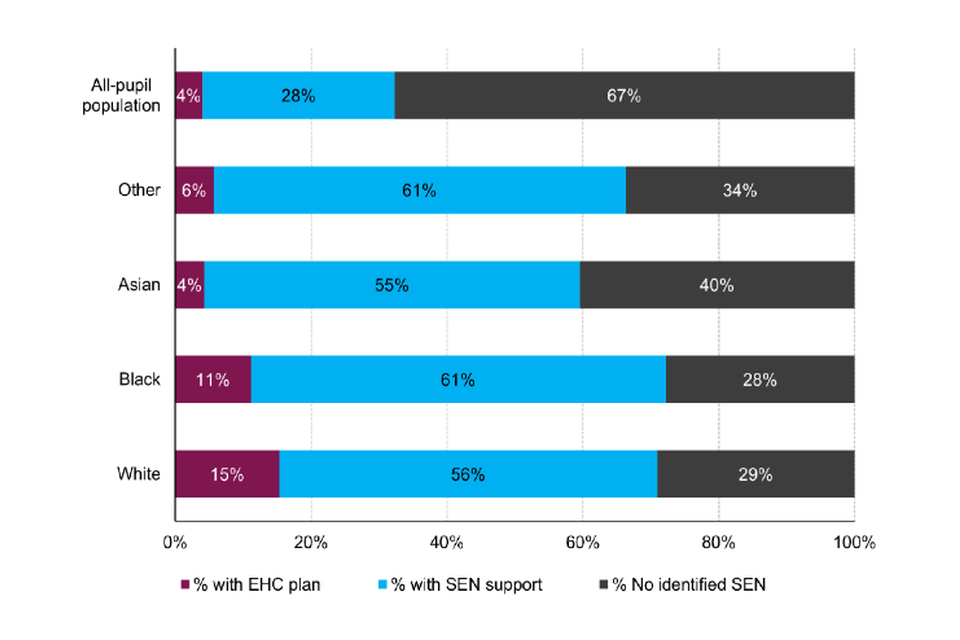
(Source: Ministry of Justice – Ethnicity and the Criminal Justice System: Chapter 7: Offender Characteristics – Table 7.03 [derived from MoJ/DfE Data Share])
Persistent absence and exclusion
Of those children cautioned or sentenced for an offence, a greater proportion of the White ethnic group had been persistently absent (78%) than the Black (69%), Asian (69%) and Other (65%) ethnic groups. This was consistent across every disposal type.
- White children given custodial sentences of less than 12 months were most likely to be persistently absent (87%). In contrast, the proportion of pupils in the all-pupil population who had been persistently absent was 39%.
A larger proportion of the Black ethnic group cautioned or sentenced for an offence received either a suspension (76%), or a permanent exclusion[footnote 78] (14%) compared with the White (70% suspension and 10% permanent exclusion), Asian (63% suspension and 7% permanent exclusion) and Other ethnic groups (65% suspension and 8% permanent exclusion).
-
Amongst nearly all ethnic groups, those receiving an immediate custodial sentence of less than 12 months were more likely to have been suspended or permanently excluded compared to other disposal types.
-
The proportion of pupils in the all-pupil population who had received a suspension or permanent exclusion was 14% and 1% respectively.
8. Practitioners
The ethnic profile of practitioners in the Criminal Justice System (CJS) has become slightly more diverse over the last 5 years
The proportion of staff from White backgrounds has decreased between 1 and 3 % across all CJS organisations over the last 5 years, driven by increases in the proportion of staff from ethnic minority backgrounds.
This chapter reports on the trends in the composition of staff and practitioners throughout the Criminal Justice System (CJS) by ethnicity. It draws upon published extracts of human resources records for the police, Ministry of Justice, Crown Prosecution Service and His Majesty’s Prison and Probation Service. To allow for variable changes in headcount throughout the period considered, the ethnicities are best considered in terms of proportions of staff rather than absolute numbers[footnote 79].
8.1 Trends in CJS organisations
Ministry of Justice:Between year ending March 2020 and year ending March 2024, there has been a 2.6pp decrease in the proportion of staff from the White ethnic group from 77.8% to 75.3%, offset by increases in in the proportion of staff from Asian (2.1pp)[footnote 80] , Black (0.3pp) and Mixed (0.6pp) ethnic groups[footnote 81].
Crown Prosecution Service (CPS):The proportion of CPS staff from a White ethnic background was 77% in 2024 a decrease of 2.5pp compared to 2020, offset by a 1.9pp increase in the proportion of staff from the Asian ethnic group[footnote 82][footnote 83].
Police officers:Of all CJS organisations the proportion of White practitioners is highest for police officers at 91.5% in year ending March 2025. The proportion of police officers belonging to all other ethnic groups combined has increased slightly from 7.6% to 8.5% between year ending March 2021 and year ending March 2025[footnote 84].
His Majesty’s Prison and Probation Service (HMPPS): Between year ending March 2021 and year ending March 2025, the proportion of staff from a White ethnic background has decreased, from 89.1% to 83.9%, offset by an increase in the proportion of staff from Black (3.2pp), Asian (1.3pp) and Mixed (0.7pp) ethnic groups[footnote 85].
Judiciary: The proportion of judges from a White ethnic background has fallen by 2.3pp (from 90.4% in 2020/21 to 88.1% in 2024/25), offset by an increase in the proportion of practitioners from Asian (1.3pp) and Mixed (1.0pp) ethnic groups[footnote 86].
Magistrates: The ethnic background of serving magistrates has remained broadly similar between 2020/21 and 2024/25. The largest change in the proportion of in-post magistrates was a 0.5% increase in the Mixed ethnic group practitioners[footnote 87].
Figure 8.01: Proportion of practitioners in organisations involved in the CJS of each ethnicity, by organisation, most recent year available and five years prior, England and Wales
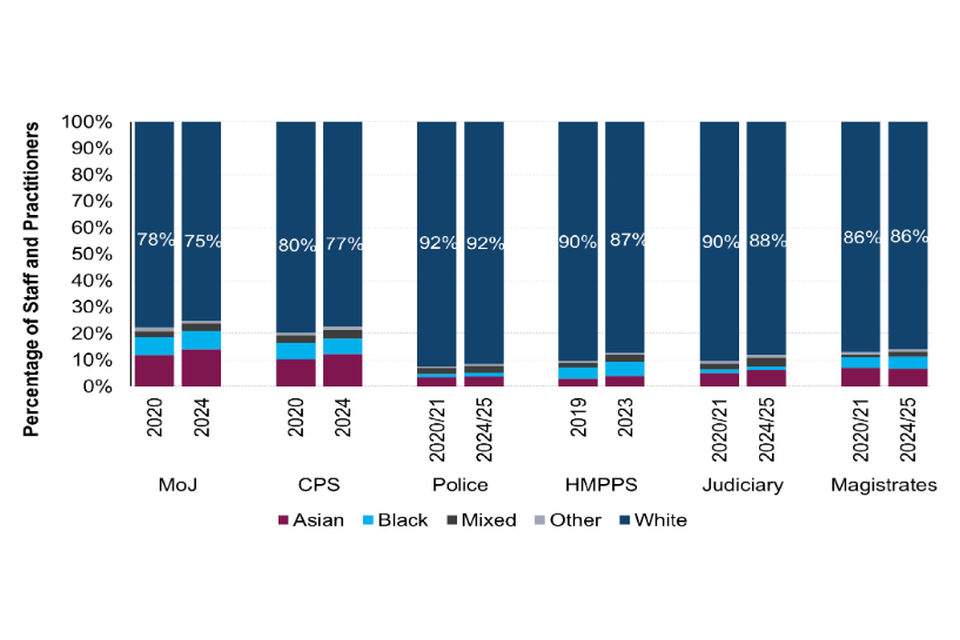
(Source: Ministry of Justice – Ethnicity and the Criminal Justice System: Chapter 8: Practitioners – 8.01, 8.03, 8.05, 8.10 and Judicial Diversity Statistics [2025])
9. Offence Analysis
All ethnic groups were significantly more likely to be sentenced to immediate custody for indictable offences compared to White offenders, with rates being statistically significant but not practically significant.
The most pronounced disparities were seen in sentencing for drug offences where all ethnic groups were both practically and significantly more likely to receive custody in comparison to White offenders.
There was an association between an offender’s ethnicity and the odds of receiving a custodial sentence for indictable offences.
When controlling for various offender and case characteristics there was a statistically significant association for offenders of Black and Other ethnic groups with increased odds of receiving a custodial sentence, compared to White offenders. In contrast, Asian offenders had statistically significant decreased odds of receiving custody.
There was no statistically significant association between an offender’s ethnicity and the length of custodial sentences for indictable offences.
When analysed by offence group, some significant disparities were evident – most notably for drug offences, where offenders from Asian, Black and Mixed ethnic groups received longer median custodial sentences than White offenders.
Investigating the association between an offender’s ethnicity and receiving a custodial sentence
This chapter analyses the association between an offender’s ethnicity and receiving a custodial sentence[footnote 88] for indictable offences[footnote 89], as opposed to an alternative non-custodial sentence[footnote 90], for sentences issued between 2020 and 2024.
A Relative Rate Index (RRI) analysis was first used to compare the unadjusted custody rates of ethnic minority groups with the White ethnic group. This approach provides a straightforward measure of disproportionality by examining differences in outcomes without accounting for other influencing factors.
To expand on these findings a logistic regression analysis was conducted to investigate the relationship between ethnicity and sentence outcomes while controlling for a range of available offender demographics and case characteristics. A quantile regression analysis was also carried out to explore differences in determinate custodial sentence lengths. These allowed for more robust assessments on disparities within custodial sentence outcomes and lengths of sentences after accounting for other relevant factors.
This analysis examined the relationship between ethnicity and sentencing outcomes for offenders sentenced for indictable offences in England and Wales between 2020 and 2024. Using both aggregated (5+1) and detailed (18+1) ethnicity classifications, and applying logistic and quantile regression models, the study explored ethnic disparities in the likelihood of receiving a custodial sentence and, where custody was imposed, differences in sentence length.
The findings highlight the importance of considering detailed ethnic groupings when analysing sentencing outcomes, as aggregated categories can mask meaningful variation within broader groups. While some disparities were observed, these were generally small and inconsistent over time. The analysis controlled for key offender and case characteristics but did not include all factors that may influence sentencing, such as prior offending or mitigating circumstances. As such, the results should be interpreted as indicative of broad patterns rather than definitive measures of disparity.
9.1 Relative Rate Index
Relative Rate Index (RRI) is a statistical measure used to quantify the relative difference in event rates between two fixed populations and was recommended for use in the Lammy Review, 2017.
This section uses the RRI analysis methodology to compare the rate at which ethnic groups receive immediate custody sentences relative to White offenders across all indictable offences. It uses the RRI analysis to focus on specific offence groups (violence against the person, sexual offences and drug offences) in line with previously published analysis, to investigate whether ethnic disparity in sentencing decisions is more, less or similarly prominent for particular types of offending, and if any disparities have remained consistent over a five-year time period between 2020 and 2024.
For context:
-
A rate is the proportion of individuals who experienced an outcome out of the total number who could have experienced it.
-
The RRI compares the outcome rate for one group (the ‘at risk’ group) to that of another (the ‘baseline’ group). In this analysis, the White ethnic group is used as the baseline.
To interpret the results:
-
The RRI value of 1 indicates no disparity between groups.
-
The RRI value greater than 1 indicates that the group of interest is more likely than the baseline group to experience the outcome.
-
For example, the RRI of 1.17 for Asian offenders indicates that Asian offenders were 1.17 times as likely (or 17% more likely) to be given a custodial sentence than White offenders.
-
The RRI value less than 1 indicates that the group of interest is less likely than the baseline group to experience the outcome.
-
Statistical significance assesses whether the observed difference is unlikely to have occurred by chance alone. It helps assess if the RRI is genuinely different from 1, especially in cases where small sample sizes can cause fluctuations.
-
Practical significance: RRIs between 0.8 and 1.25 are considered to fall within a zone of tolerance — a range where differences are unlikely to indicate meaningful or practically important disparities. In charts, this appears as a shaded zone, helping readers see which RRIs fall inside or outside this range. Values outside the zone may indicate meaningful differences but should be interpreted with caution when based on small numbers.
-
Confidence intervals show the range in which the true RRI likely lies with 95% confidence. In charts, the dot represents the estimated RRI, and the horizontal line shows the confidence interval around it.
In summary:
-
Statistical significance is the more important measure of reliability.
-
If an RRI is statistically significant but within the zone of tolerance, the difference is significant (unlikely due to chance alone) but small.
-
If an RRI is outside the zone of tolerance but not statistically significant, the apparently meaningful difference is not reliable and may be due to chance.
-
Only when an RRI is both statistically and practically significant can we be confident that there is a real and meaningful disparity between groups.
RRI Analysis Results
Overall, all ethnic groups were more likely to receive custodial sentence compared to White offenders in 2024. However, the findings vary across specific offence groups. For example, while all ethnic groups were both practically and statistically more likely to be sentenced to custody for drug offences, there were no practically significant rates for violence against the person offences in 2024.
It is important to note that sentencing decisions are dependent on various factors, such as previous offending history, offence motivations, stage of plea or any other associated mitigating and aggravating factors, and within this RRI analysis, no controls have been applied. Even within specific offence groups, there can be a wide range of offence seriousness and therefore, these findings could potentially reflect variations in the mix of offences across ethnic groups.
Figure 9.01: RRI for ethnic groups relative to the White group: offenders sentenced to immediate custody per all offenders sentenced for indictable offences, 2020 – 2024, England and Wales
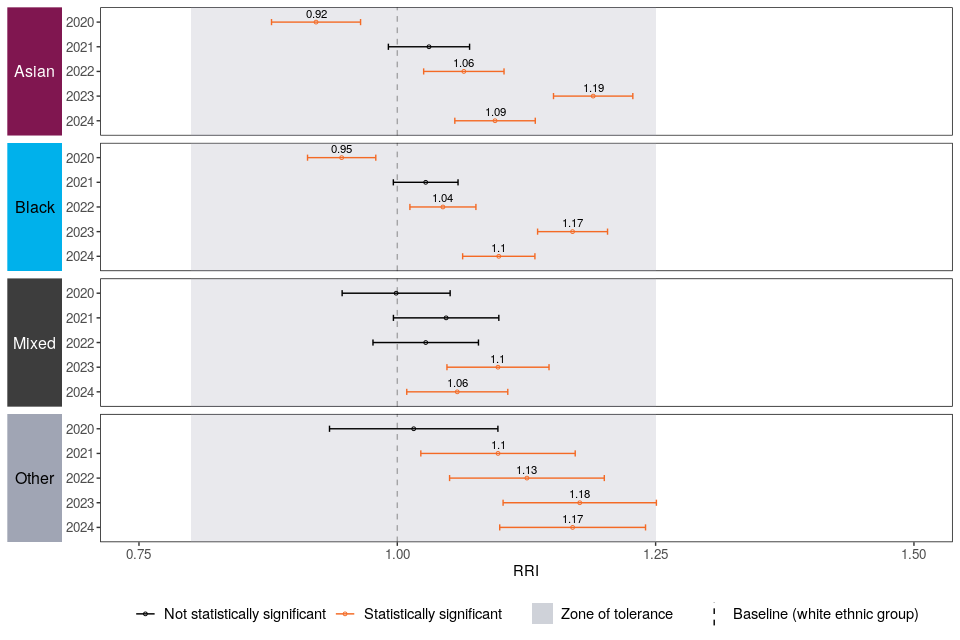
As outlined in Chapter 5, in 2024, the custody rate for indictable offences was lowest for the White ethnic group, at 33%, with the highest being for the Other ethnic group at 39%.
The RRI analysis showed that in 2024 all ethnic groups were more likely to be sentenced to immediate custody for indictable offences, with rates being statistically significant but within the zone of tolerance. Compared to White defendants, Other ethnic group were 17%, Black ethnic group 10%, and Asian ethnic group defendants 9% more likely to receive custodial sentence.
Violence against the person
Asian, Black and Mixed ethnic groups were significantly[footnote 91] more likely to receive a custodial sentence across all years from 2020-2024 compared to White defendants, however these have tended to be within the zone of tolerance and not considered practically significant. Asian and Black offenders reported differences at a level considered practically significant in 2023.
Figure 9.02: RRI for ethnic groups relative to the White group: offenders sentenced to immediate custody per all offenders sentenced for violence against the person offences, 2020-2024, England and Wales
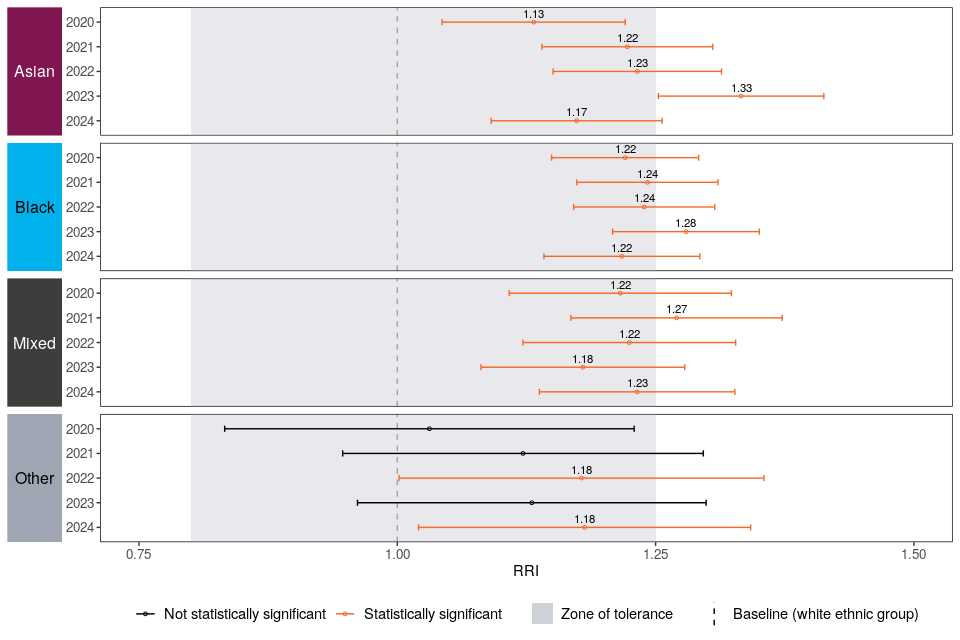
Sexual offences
Amongst offenders sentenced for sexual offences, no ethnic groups were significantly more or less likely to be sentenced to custody relative to the White ethnic group between 2020 and 2023.
In 2024, Asian and Black offenders were significantly more likely to receive a custodial sentence, at 13% and 22% respectively, however this was not considered practically significant. However, offenders from the Mixed and Other ethnic groups were both practically and statistically more likely to receive a custodial sentence at 25% and 30% respectively.
Figure 9.03: RRI for ethnic groups relative to White group: offenders sentenced to immediate custody per all offenders sentenced for sexual offences, 2020-2024, England and Wales
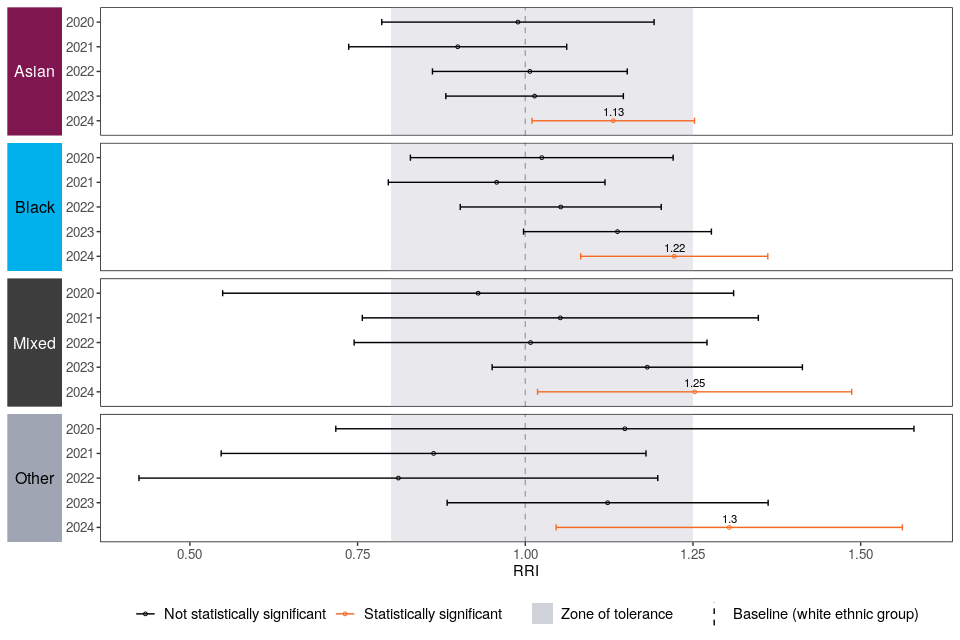
Drug offences
All ethnic groups show a significantly higher likelihood of receiving a custodial sentence for drug offences compared to White offenders in the latest year. The Other ethnic group was 89% more likely compared to White ethnic group, followed by Asian (58%), Black (44%) and Mixed (26%). All reported differences were outside the zone of tolerance and are therefore considered to be practically significant.
Figure 9.04: RRI for ethnic groups relative to White group: offenders sentenced to immediate custody per all offenders sentenced for drug offences, 2020-2024, England and Wales.
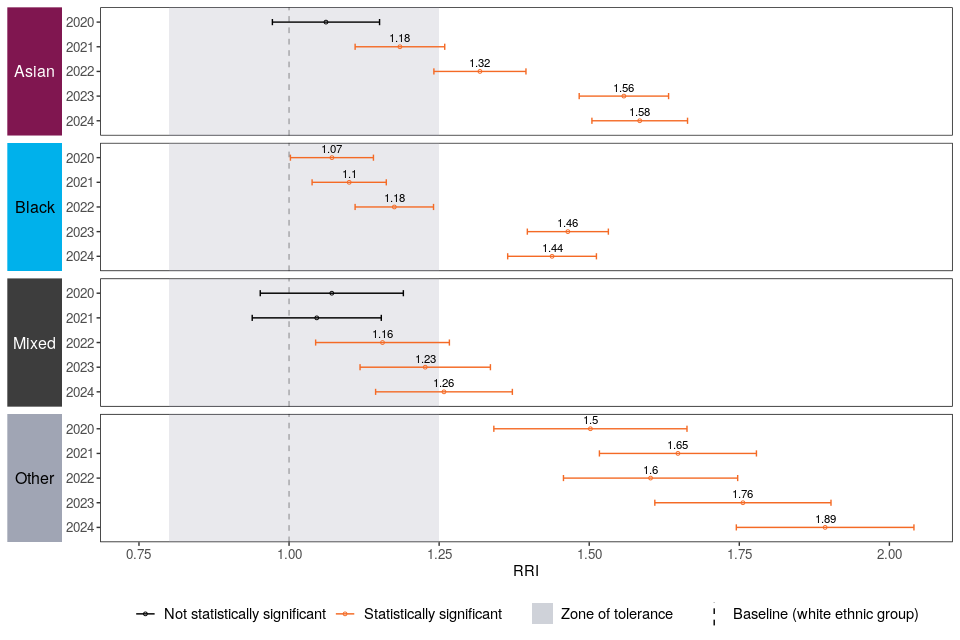
9.2 Regression Analysis
This section builds on the RRI analysis to investigate the association between ethnicity and receiving a custodial sentence. The RRI analysis does not control for any factors that may influence sentencing decisions. The regression analysis allows for control of various offender and case characteristics. Similar analysis was first produced in the Ethnicity and the Criminal Justice System 2022.
Regression is a widely used and well established method for investigating relationships between different factors and understanding the association between individual factors and an outcome, when holding other factors constant. This analysis also examines these relationships within specific offence groups (violence against the person, sexual offences, and drug offences) over the 2020-2024 time period collectively.
Furthermore, we expanded the analysis to investigate the association between ethnicity and sentence length using quantile regression, focusing on the median (50th percentile) of the sentence length distribution. This approach allows us to estimate how ethnicity is associated with typical sentence lengths, providing a measure that is less affected by extremely short or long sentences than the mean.
Approach
The dataset used in this analysis was derived from the Court Proceedings Database (CPD) and includes all offenders[footnote 92] sentenced at magistrates’ court or the Crown Court for indictable only or triable-either-way offences between 2020 and 2024, giving an initial sample size of 893,050.
The data are recorded on both a principal offence and a principal disposal basis — meaning that each record relates to the most serious offence for which the defendant was dealt with and the most severe sentence imposed for that offence.
Records with missing information on the court where the offender was sentenced, or on key demographic information (ethnicity, sex or age), were excluded from the analysis, resulting in a sample of 640,416. Overall, 28% of the original sample had an unknown ethnicity. Due to these exclusions, the findings are only generalisable to offenders sentenced for indictable offences in England and Wales between 2020 and 2024 where ethnicity, sex and age were known.
Ethnicity information included within the analysis is self-identified ethnicity. The coverage of ethnicity data available for individuals tried for summary offences is insufficient to justify inclusion, and therefore, this analysis is limited to those sentenced for indictable only or triable-either-way offences (collectively referred to as indictable offences[footnote 93]). The analysis was conducted using ethnicity categories based on both the most granular 2021 Census classification (referred to throughout as the 18+1 classification) and the aggregated ethnic groupings (referred to throughout as the 5+1 classification).
Ethnic groups with a volume of records deemed too small to remain as a standalone category were grouped appropriately.
Table 1 summarises the subset of data used for this analysis, showing that offenders of White ethnicity accounted for 81% of the sample, with White British offenders specifically accounting for 74%.
Table 1. Descriptive statistics of the sample by ethnicity, year and offence group
| Variable | Value | Offenders sentenced | % of sample | % sentenced to custody |
| Ethnicity | Asian | 37,001 | 5.8% | 36% |
| Bangladeshi | 5,516 | 0.9% | 35% | |
| Chinese | 510 | 0.1% | 38% | |
| Indian | 5,654 | 0.9% | 32% | |
| Pakistani | 14,353 | 2.2% | 38% | |
| Any other Asian background | 10,968 | 1.7% | 34% | |
| Black | 56,130 | 8.8% | 35% | |
| African | 19,121 | 3.0% | 35% | |
| Caribbean | 17,522 | 2.7% | 36% | |
| Any other Black, Black British or Caribbean background | 19,487 | 3.0% | 35% | |
| Mixed | 22,431 | 3.5% | 35% | |
| White and Asian | 2,286 | 0.4% | 35% | |
| White and Black African | 2,705 | 0.4% | 33% | |
| White and Black Caribbean | 10,660 | 1.7% | 36% | |
| Any other mixed or multiple ethnic background | 6,780 | 1.1% | 34% | |
| White | 515,572 | 80.5% | 34% | |
| White British | 471,683 | 73.7% | 33% | |
| White Irish | 5,961 | 0.9% | 35% | |
| Any other White background* | 37,928 | 5.9% | 36% | |
| Other | 9,282 | 1.4% | 37% | |
| Any other ethnic group** | 9,282 | 1.4% | 37% | |
| Year | 2020 | 119,709 | 18.7% | 34% |
| 2021 | 128,814 | 20.1% | 33% | |
| 2022 | 124,641 | 19.5% | 34% | |
| 2023 | 126,058 | 19.7% | 35% | |
| 2024 | 141,194 | 22.0% | 34% | |
| Offence Group | Criminal damage and arson | 5,781 | 0.9% | 33% |
| Drug offences | 128,361 | 20.0% | 25% | |
| Fraud offences | 9,291 | 1.5% | 31% | |
| Miscellaneous crimes against society | 58,887 | 9.2% | 32% | |
| Possession of weapons | 48,098 | 7.5% | 31% | |
| Public order offences | 56,416 | 8.8% | 33% | |
| Robbery | 11,298 | 1.8% | 63% | |
| Sexual offences | 22,746 | 3.6% | 57% | |
| Theft offences | 153,643 | 24.0% | 34% | |
| Violence against the person | 145,895 | 22.8% | 37% |
*Includes offenders identifying as ‘Gypsy or Irish Traveller’.
**Includes offenders identifying as ‘Arab’.
A series of multivariate regression models were developed to examine the association between ethnicity and sentencing outcomes. Three types of models were created:
-
Ethnicity and custodial sentencing over time: Logistic regression models were produced for each year between 2020 and 2024 to examine trends in ethnic disparities in custodial sentencing across all indictable offences.
-
Ethnicity and custodial sentencing by offence group: Separate logistic regression models were developed for specific offence categories — violence against the person, sexual offences, and drug offences — combining all sentences for each offence type across the 2020–2024 period.
-
Ethnicity and sentence length: A quantile regression model (focusing on the median sentence length) was used to explore whether the relationship between ethnicity and sentence length differed across ethnic groups. As with the time-series logistic models, the quantile regression was conducted separately for each year between 2020 and 2024, allowing trends over time to be examined. This model was run only using the 5+1 ethnicity classification due to smaller sample sizes within detailed ethnic breakdowns.
Each logistic regression model was run separately using both 5+1 and 18+1 ethnicity groupings, allowing results to be analysed at both aggregated and detailed levels. This dual approach enabled identification of variation within broader ethnic categories that might otherwise be obscured in the aggregated 5+1 analysis. The 18+1 models also allowed for comparisons between White British, White Irish, and Any other White background groups.
The following variables were used within the models to ensure that the associations between ethnicity and sentencing outcomes (receiving a custodial sentence or sentence length) were examined under similar criminal and demographic circumstances:
-
Sentence Outcome: binary outcome variable, with the value of either 0 for non-custodial sentence or 1 for custodial sentence.
-
Custodial Sentence Length: Continuous variable representing the length of custodial sentences (measured in days). Only used in the sentence length models.
-
Year: Year in which the sentence was imposed. Included as a control variable in the offence group models; time-series models were instead estimated separately for each year.
-
Sex: Offender characteristic recorded as either Male or Female. Records for non-persons (e.g., companies) or where sex was unknown were excluded.
-
Age: Offender characteristic. Individuals aged under 18 were grouped together, as were those aged 65 or above; all other ages were retained as their original values.
-
Ethnicity: Offender characteristic using the 5+1 ethnic grouping (as discussed above)
-
Detailed Ethnicity: Offender characteristic using the 18+1 ethnic grouping (as discussed above)
-
Offence: Principal offence committed by the offender. Offences with small sample sizes were grouped into broader categories within the main offence groups (e.g., Drug offences – Other).
-
Court: The court where the offender was sentenced
-
Plea: The plea entered by the offender. For trial cases, this was either ‘guilty’, ‘not guilty’ or ‘not known’, whereas for sentence cases, plea is ‘not applicable’[footnote 94].
However, these models have not considered all factors which could influence sentencing decisions, such as previous offending history, offence motivations, stage of plea or any other associated mitigating and aggravating factors. These variables are not available in the Court Proceedings Database and as such cannot currently be included as part of the analysis.
Logistic regression
The logistic regression results are expressed as odds ratios, calculated to quantify the strength of association between the factor and the outcome. An odds ratio greater than 1 indicates increased odds of being sentenced to custody, whereas an odds ratio of less than 1 indicates decreased odds of being sentenced to custody, compared to the reference category[footnote 95]. However, these associations should only be considered and interpreted where statistical significance is met. Statistical significance was assessed at the 0.05 level, expressed as ‘p<0.05’, which means there is at most a five percent likelihood that the result was due to chance alone. Generally, only results which are statistically significant are reported in this commentary, however, there are instances where a non-significant result is mentioned (for example, where the 18+1 ethnicity model results contrast that of the aggregated 5+1 grouping results).
Although odds ratios are related to probability, it is important not to misinterpret these figures. For example, if an ethnic group has a statistically significant odds ratio of 1.92, this suggests that the odds of receiving a custodial sentence for this ethnic group are approximately 1.92 times higher than the odds for the White ethnic group. This does not mean that the probability of this ethnic group receiving a custodial sentence is 92% higher than for the White ethnic group.
To aid interpretation of odds ratios, they were converted into Cohen’s d, a measure of magnitude, and classified as Small (d < 0.2), Medium (0.2 ≤ d < 0.5), or Large (d ≥ 0.5). An odds ratio of 1.35 for example, would be considered medium, whereas 5.42 would be considered large.
To add further context to the findings, the logistic regression models are used to calculate a selection of specific predicted probabilities, comparing the probability of offenders from each ethnic group receiving a custodial sentence in a specific scenario, when all other factors included in the analysis are the same, referred to as the ‘reference offender’.
-
This probability of receiving a custodial sentence is calculated for an offender of the same age and sex, convicted of the same offence, entering the same plea and being sentenced at the same court, in the same year for each ethnic group.
-
The reference offender characteristics were broadly selected based upon the most common factors found in the dataset.
Association between an offender’s ethnicity and receiving a custodial sentence, 2020-2024[footnote 96]
In 2024, offenders from Black and Other ethnic groups had significantly higher odds of receiving a custodial sentence compared to White offenders, while those from Asian ethnic groups had significantly lower odds, although the magnitude of these differences was small. These patterns, however, were not consistent across the five-year period.
-
Over the past five years, there is no consistent pattern of significant differences in the odds of receiving a custodial sentence by ethnicity. However, in certain years there are individual differences that are significant and some groups displayed more stable associations than others
-
Offenders from Black ethnic groups had significantly higher odds in all years except 2023, while Mixed ethnic groups showed higher odds in most years except 2024. Asian ethnic groups had significantly lower odds in 2020, 2021, and 2024, whereas offenders from Other ethnic groups showed higher odds only in 2022 and 2024.
-
In 2024, offenders from Black ethnic group had 8% higher odds and offenders from Other ethnic group had 18% higher odds of receiving a custodial sentence than White offenders.
-
Conversely, offenders from Asian ethnic group had 12% lower odds of receiving a custodial sentence compared to White offenders.
At the more detailed 18+1 ethnicity level, differences between ethnic groups in the odds of receiving a custodial sentence were generally small in 2024, with only a few groups showing statistically significant associations compared to White British offenders at small magnitude.
-
Over the past five years, only offenders from the Any other White background and Any other Black, Black British or Caribbean background showed consistent associations with higher odds of receiving a custodial sentence. Caribbean offenders were significantly more likely to receive custody in every year except 2023, and White and Black Caribbean offenders showed the same pattern, with significance in all years except 2024.
-
In 2024, offenders from Caribbean ethnic group had 22% higher odds and offenders from Any other Black, Black British or Caribbean background had 22% higher odds of receiving a custodial sentence than White British offenders.
-
Offenders from Indian and Pakistani ethnic groups had 27% and 15% respectively lower odds of receiving a custodial sentence compared to White British offenders in 2024.
-
Offenders from Any other White background had 5% higher odds of receiving a custodial sentence compared to White British in 2024.
Predicted probabilities of receiving a custodial sentence for the different ethnic groups were calculated as compared to a reference offender being male, aged 30, White (for 5+1), White British (for 18+1), pleading guilty, committing the offence of ‘Theft from Shops’ and sentenced at a specific Crown Court in 2024.
- The highest predicted probabilities for this scenario were for offenders of Chinese, Caribbean and Any Other ethnic group at 77%. Followed by White and Black African (76%), Any other Black, Black British or Caribbean background (75%), White and Black Caribbean (75%) and Any other mixed or multiple ethnic background (75%). In contrast, the predicted probability for the Indian ethnic group was lowest at 67%. White defendants had a predicted probability of 74%.
Association between an offender’s ethnicity and receiving a custodial sentence, by offence group (model for each offence group, offenders sentenced 2020-2024 collectively)
Violence against the person
Black and Mixed ethnic groups were associated with a statistically significant increase in odds of receiving a custodial sentence for violence against the person compared to White offenders, though this was of small magnitude. However, this varied within the detailed ethnic groups.
-
Offenders of Black Caribbean and Any other Black, Black British or Caribbean ethnic groups were associated with increased odds, at 30% and 27% respectively. There was no statistically significant difference in the odds for the Black African ethnic group.
-
Similarly, there was a statistically significant association with increased odds for offenders of mixed White and Black Caribbean (33%) and Any other mixed or multiple ethnic background (23%). There was no significant association for the mixed White and Asian and mixed White and Black African ethnic groups.
-
The White Irish ethnic group were also associated with increased odds of small effect (26%).
-
The Chinese ethnic group were associated with 46% decreased odds of being sentenced to custody for violence against the person offences, compared to the White British group.
In the violence against the person example scenario, the characteristics of the reference offender were: male, aged 30, White (for 5+1), White British (for 18+1), pleading guilty, committing the offence of ‘Assault of an emergency worker’ and sentenced at a specific Crown Court in 2024.
- The highest predicted probabilities for this scenario were for offenders of mixed White and Black Caribbean (70%), Black Caribbean (70%), any other Black, Black British or Caribbean background (69%), Any other mixed or multiple background (69%) and White Irish (69%). In contrast, the predicted probability for the Chinese ethnic group was 49%. White defendants had predicted probability of 64%.
Sexual offences
For offenders sentenced for sexual offences, the Black ethnic group were associated with increased odds of receiving a custodial sentence when compared to the White ethnic group.
-
Furthermore, within the aggregated Black ethnic group, the Black African group were associated with increased odds of small magnitude, whereas offenders of Black Caribbean and any other Black, Black British or Caribbean background were associated with increased odds of medium magnitude.
-
The aggregated mixed ethnic group were also associated with increased odds overall; however, this varied within the granular 18+1 ethnic groups. Offenders of mixed White and Black Caribbean, or any other mixed or multiple ethnic background were associated with increased odds of medium magnitude, whereas the mixed White and Asian, and mixed White and Black African ethnic groups, were not significantly associated with increased odds.
-
Offenders of ‘Any other White’ background were also associated with increased odds of receiving a custodial sentence for sexual offences, compared to the White British cohort.
In the sexual offences example scenario, the characteristics of the reference offender were: male, aged 30, White (for 5+1), White British (for 18+1), pleading guilty, committing the offence of ‘Sexual assault on a female’ and sentenced at a specific Crown Court in 2024.
- Similar to the findings for the assault of an emergency worker scenario, the highest predicted probability for this example were also for offenders of mixed White and Black Caribbean ethnicity (70%). Offenders of White and Black African also had predicted probability of 70%, and Caribbean and any other mixed or multiple ethnic background had a predicted probability of 68%. In contrast, the predicted probability for the Bangladeshi ethnic group was 54%. White defendants had predicted probability of 58%.
Drug offences
Of the three offence groups analysed, drug offences highlighted the largest disparity between the odds of different ethnic groups receiving a custodial sentence. With the exception of the Indian ethnic group offenders from all ethnic groups were associated with significantly increased odds compared to the White British group.
- The magnitude of these increased odds was large for offenders of Chinese, ‘Any other White background’, and ‘Any other ethnic group’. The effect was medium for all remaining ethnic groups where statistical significance was observed, except for the Pakistani, mixed White and Black African and mixed White and Black Caribbean ethnic groups where the increased odds was of small magnitude.
In the drug offences example scenario, the characteristics of the reference offender were: male, aged 30, White (for 5+1), White British (for 18+1), pleading guilty, committing the offence of ‘Possession of a controlled drug - Class B (cannabis)’ and sentenced at a specific Crown Court in 2024.
-
Offenders of Chinese ethnicity were most likely to receive a custodial sentence in the scenario (62%), contrasting the findings for the assault of an emergency worker scenario, where the Chinese ethnic group were least likely.
-
Offenders of Any other White background and Any Other ethnic group were, 55% and 44% respectively, likely to receive a custodial sentence in this situation.
-
The White British ethnic group were least likely (18%), closely followed by the Indian (20%) and Pakistani (23%) ethnic groups.
9.3 Quantile regression
Association between an offender’s ethnicity and the likelihood of receiving a longer custodial sentence in median days, 2020-2024[footnote 97]
In 2024, no statistically significant differences in sentence length were observed between ethnic groups. Although offenders from Black and Asian ethnic groups had slightly longer median custodial sentences than White offenders, these differences were small and not statistically significant.
-
In 2020, offenders from both the Black and Other ethnic groups received significantly longer median custodial sentences than White offenders. The difference was around 7.7 months longer for Black offenders and 18.7 months longer for those in the Other ethnic group.
-
Between 2021 and 2024, differences in sentence length across ethnic groups were small and not statistically significant, with no consistent trend over time.
Association between an offender’s ethnicity and the likelihood of receiving a longer custodial sentence in median days, by offence group, 2020 – 2024
Across the 2020–2024 period, differences in median custodial sentence length by ethnicity varied slightly between offence types, but only a few statistically significant associations were observed.
-
Violence against the person: Offenders from the Other ethnic group received significantly shorter median custodial sentences than White offenders (around 23 months shorter). For Asian, Black, and Mixed ethnic groups, differences were small and not statistically significant.
-
Sexual offences: There were no statistically significant differences in median sentence length between any ethnic group and White offenders.
-
Drug offences: Offenders from Asian, Black, and Mixed ethnic groups received significantly longer median custodial sentences than White offenders, by approximately 33, 45, and 34 months, respectively. Offenders from the Other ethnic group did not differ significantly.
10. Dashboard
A web-based data visualisation tool has been created alongside the report, allowing users to view and customise charts based on the published statistics. The dashboard should be used as way to discover the data available from the Criminal Justice System and be used a launching point for further investigation.
11. Further Information
Accredited official statistics status
National Statistics are accredited official statistics that meet the highest standards of trustworthiness, quality and public value. Proven reoffending and criminal justice statistics accredited official statistics were independently reviewed by the Office for Statistics Regulation in May 2020. They comply with the standards of trustworthiness, quality and value in the Code of Practice for Statistics and should be labelled as accredited official statistics. It is the Ministry of Justice’s responsibility to maintain compliance with the standards expected for accredited official statistics. If we become concerned about whether these statistics are still meeting the appropriate standards, we will discuss any concerns with the Authority promptly. Accredited official statistics status can be removed at any point when the highest standards are not maintained and reinstated when standards are restored.
Future publications
Our statisticians regularly review the content of publications. Development of new and improved statistical outputs is dependent on reallocating existing resources. As part of our continual review and prioritisation, we welcome user feedback on existing outputs including content, breadth, frequency, and methodology and in particular on the specific issues identified in the introduction. Please send any comments you have on this publication.
Contacts
Press enquiries should be directed to the Ministry of Justice press office:
Tel: 020 3334 3536
Email: newsdesk@justice.gov.uk
Other enquiries about these statistics should be directed to the Criminal Courts & Sentencing Data and Statistics team in the Data and Analysis unit of the Ministry of Justice:
Email: CJS_Statistics@justice.gov.uk
-
More information of ethnic group classifications can be found in the technical guide ↩
-
Officer identified ethnicity can refer to ethnicity recorded by any third party, such as a police officer, clerk or a member of the data entry team. ↩
-
See technical guide for further details of how detailed ethnicity categorisations are aggregated. ↩
-
See technical guide for concordance in ethnicity reporting between these sources ↩
-
Available at https://www.statisticsauthority.gov.uk/code-of-practice/ ↩
-
Data provided by the Home Office listing offences recorded as homicide as of 6th December 2024. ↩
-
As a survey that asks people whether they have experience as a victim of a crime, the CSEW does not cover homicides or crimes where there is no direct victim, such as possession of drugs or motoring offences. ↩
-
Personal crime includes violence, robbery, theft from the person and other theft of personal property, including fraud and computer misuse. ↩
-
Statistical significance between groups over the time series is represented with a ‘*’. ↩
-
Children refer to those aged 10 to 15. The unweighted base for children was similar (1,437) compared to years prior (1,309 in 2022/23, 1,528 in 2023/24). Low unweighted bases will increase the size of confidence intervals around the estimates presented and these figures should therefore be interpreted with caution. ↩
-
Due to sample sizes, the figures presented here are not statistically significant. ↩
-
The number of incidents remains relatively low which correspond to large percentage increases. Caution should be taken when interpreting these figures. ↩
-
All groups defined by officer-identified ethnicity classification – see the technical guide. ↩
-
From 1st April 2021, ethnicity categories were changed on the Homicide Index to be consistent with ONS Census groupings. To enable a time series, ‘Other’ has been grouped to include Asian (Indian sub-continent), Asian, mixed/multiple ethnicities and any other ethnic group. ↩
-
Includes police force areas City of London and Metropolitan Police ↩
-
Instances where there is no current suspect accounted for 24% of all homicides between year ending March 2022 and year ending March 2024, where ethnicity was known. ↩
-
Ethnic group, England and Wales - Office for National Statistics ↩
-
Ethnic group, England and Wales - Office for National Statistics ↩
-
Data for stop and searches is published by Home Office in Stop and search open data tables. Figures for British Transport Police are not included in the totals. ↩
-
Stop and searches under s60 Criminal Justice and Public Order Act 1994 accounted for approximately 1% of all stop and searches (s1 and s60) in the latest year. Since 2023/24, figures also include searches under section 342E of the Sentencing Act 2020 and section 11 of the Public Order Act 2023. For more information on stop and search legislation, please see the technical guide.. ↩
-
Data only includes those for whom ethnicity is known and excludes those where ethnicity is not stated. Commentary does not include outcomes other than arrest, community resolution and ‘no further action’ e.g. caution / other action / seizure of property.. ↩
-
When a suspect is stopped and searched under s60 it is so the police can search for offensive weapons or dangerous instruments. To account for the resultant arrests from stop and searches under s60, these have been added to the offensive weapons category of under s1 for the purposes of analysis. ↩
-
Offence groups from this chapter are not directly comparable to offence groups from the MoJ Court Proceedings database – see technical guide for further details. ↩
-
Data excludes those with an unstated ethnicity. ↩
-
Children includes individuals aged up to 17 and adults includes individuals aged 18 and over. ↩
-
Includes City of London and Metropolitan Police forces. It should be noted that 61% of arrests in London had a not stated ethnicity in 2024/25 ↩
-
Out of court disposals available to the police and CPS in 2024 included: simple and conditional cautions; cannabis and khat warnings; penalty notices for disorder (PNDs); and community resolutions. ↩
-
See technical guide for more information on PNDs. ↩
-
Figures on PNDs exclude cases where ethnicity is not known (27% of PNDs issued in 2024). ↩
-
Figures on cautions exclude cases where ethnicity is not known (8% of all cautions issued in 2024). ↩
-
Summary motoring offences are not considered in relation to cautions or cautioning rates as these tend to be addressed using Fixed Penalty Notices. There is no published data available on Fixed Penalty Notices by sex. ↩
-
Where ethnicity was known. ↩
-
Indictable offences include indictable-only and triable-either-way offences. Indictable only offences are the most serious and must be tried at the Crown Court; summary offences are the least serious and must be tried at magistrates’ courts; and triable-either-way offences are of intermediate severity and may be tried at either court based on the circumstances of the case. See accompanying technical guide for further details. ↩
-
Where ethnicity is known. 36% of defendants prosecuted had an unstated ethnicity in 2024. ↩
-
Where ethnicity is known. 36% of defendants with a remand status at magistrates’ courts had an unstated ethnicity in 2024. ↩
-
Where ethnicity is known. 37% of defendants with a remand status at the Crown Court in 2024 had an unstated ethnicity. ↩
-
Defendants proceeded against at magistrates’ courts and subsequently committed to the Crown Court will have separate remand decisions made in both courts and will therefore be included twice in the calculation of RRI. A defendant may have a different remand status at Crown Court compared to their status at magistrates’ court. ↩
-
For more information about RRI please see chapter 9 Offence Analysis and technical guide. ↩
-
Where ethnicity is known. 9% of defendants in 2024 had an unstated ethnicity. ↩
-
Concordance rates are calculated by dividing the number of those who were recommended to receive a sentence disposal and did receive it, by all those who were recommended to receive it. ↩
-
Where ethnicity is known. 34% of offenders sentenced in 2024 had a not stated ethnicity. ↩
-
Where ethnicity is known. 34% of offenders sentenced in 2024 had a not stated ethnicity. ↩
-
The overall increase in ACSL may be due to a change in sentencing guidelines. ↩
-
Where ethnicity is known. 39% of defendants committed for trial at Crown Court for indictable offences in 2024 had a not stated ethnicity. ↩
-
Where ethnicity is known. Not stated or unknown accounted for 33% of defendants in 2024. ↩
-
The waiting time estimates are a ‘lagged measure’, and defendants are counted at the point of their case being disposed of. As such the waiting time estimates provide a ‘backwards’ look at the durations spent between receipt and main hearing at the Crown Court. ↩
-
Where ethnicity is known. 33% of crime lower legal aid clients had an unstated ethnicity. ↩
-
Where ethnicity is known. Since the introduction of Crime Apply, information on ethnicity has not been collected. Therefore, 68% of crime higher legal aid clients had an unstated ethnicity. ↩
-
Where ethnicity is known. 38% of prison law legal aid clients had an unstated ethnicity. ↩
-
Ethnicity was known for 98.84% of prisoners in England and Wales on 30th June 2025. ↩
-
A determinate sentence is for a fixed period of time, and differs from indeterminate sentences that have a minimum fixed period, known as a tariff, that must be served before release is considered by the parole board. ↩
-
56,834 prisoners were released from determinate sentences in 2025, of whom 98.97% were of known ethnicity. ↩
-
See technical guide for information relating to the parole board. ↩
-
Ethnicity was known in 99.7% of oral parole board hearings in the year ending March 2025. Cases where ethnicity was not known have not been included in this commentary. ↩
-
Court orders can contain more than one requirement. ↩
-
Ethnicity was recorded for 96.6% of community orders and 97.1% of suspended sentence orders commenced in 2024. Those where ethnicity was not known/recorded are not included in this commentary. ↩
-
Indictable offences include indictable-only and triable either way offences. Indictable offences are more serious offences that may (if triable either-way) or must (if indictable only) be passed on to the Crown Court. ↩
-
Where ethnicity was known. Defendants with unknown or not stated ethnicity accounted for 33% of all indictable prosecutions in 2024. ↩
-
The analysis in this chapter excludes defendants where sex is unknown, unless stated otherwise. ↩
-
Remands data in this section are based on the magistrates’ courts’ and on the Crown Court’s decision on whether a defendant prosecuted for a criminal offence, should – during the court proceeding – go on to be placed in custody or released on bail. ↩
-
The analysis in this chapter excludes defendants where age is unknown, unless stated otherwise. ↩
-
The custody rate is the proportion of all offenders sentenced to immediate custody, out of all sentencing outcomes. ↩
-
Where there were multiple offences on the same occasion, only the primary offence as recorded on the PNC would be counted. ↩
-
The Police National Computer has a 6+1 ethnicity classification. ↩
-
Asian combines the following categories from the published criminal history pivot table for 2023 Q4: Chinese or Japanese or S E Asian, and Asian. ↩
-
White combines the following categories from the published criminal history pivot table for 2023 Q4: White - North European, and White - South European. ↩
-
Annual cohorts are based on financial years (April to March). ↩
-
The figures presented in this section include both indictable and summary offences. ↩
-
Pupils who do not have a KS4 record are not included. ↩
-
All-pupil population totals refers to the wider student population who had a KS4 academic year of 2013/14 or 2014/15. The all-pupil population includes both young people who have been cautioned or sentenced for an offence, and those who have not. Offender numbers and pupil population figures quoted in this analysis may differ when analysing different education variables, since the information on these variables may not be recorded for all offenders and pupils. ↩
-
Pupils at the end of Key Stage 4 are typically aged 15 and 16. ↩
-
Ethnicity ‘Other’ includes Chinese, Japanese, South East Asian and Middle Eastern. ↩
-
A young person may be eligible to claim for FSM if they or their family meet certain criteria related to their income and benefits received. ↩
-
From 2014 Education, Health and Care plans were introduced. Under previous legislation pupils could be eligible for Statements of SEN. The period for local authorities to transfer children and young people with Statements of SEN to EHC plans started in September 2014 and ended on 31 March 2018. For the purposes of this analysis, ‘EHC plan’ will be used to describe both Statements of SEN and EHC plans unless stated otherwise in the particular context. ↩
-
SEN support means support that is additional to, or different from, the support generally made for other children of the same age in a school. It is provided for pupils who are identified as having a learning difficulty or a disability that requires extra or different help to that normally provided as part of the school’s usual curriculum offer. A pupil on SEN support will not have an education, health and care plan. SEN support replaces school action and school action plus, but some pupils remain with these provision types in first year of transition. More detailed information on the reforms can be found at the following: SEND code of practice: 0 to 25 years. ↩
-
An EHC plan is a document which sets out a child’s SEN and any additional help that the child should receive. A local authority may issue an Education, health and care plan for a pupil who needs more support than is available through SEN support. This will follow a statutory assessment process whereby the local authority considers the pupil’s special educational needs and any relevant health and social care needs; sets out long term outcomes; and specifies provision which will deliver additional support to meet those needs. ↩
-
Percentages may not sum to 100% due to rounding. ↩
-
A permanent exclusion refers to a pupil who is excluded and who will not come back to that school (unless the exclusion is overturned). ↩
-
Due to a change in the data collection framework in 2021, practitioners who identify as Chinese are now counted under the “Asian” ethnic group, in line with the 2011 ONS Census classifications. For this reason, comparisons over time for the “Asian” and “Other” ethnic group should be made with caution. ↩
-
In part due to the reclassification of staff who identify as Chinese moving into the Asian ethnic category in 2021. ↩
-
Data are self-declared from HR records, as at 31 March 2024 where ethnicity was known; not including figures from HMPPS. Ethnicity was not stated in 20% of records in 2022. ↩
-
Data is self-declared from HR records, as at 31 December 2024 where ethnicity was stated. These data are based on the ONS headcount specification and may differ from other published figures due to differing specifications. Ethnicity was not stated in 11% of records as at 31 March 2024. ↩
-
Excludes declarations of ‘prefer not to say’. ↩
-
Data are self-declared from Home Office, as at March 2025 where ethnicity was known, some small discrepancies may result from revisions of data for previous years compared to figures here. Ethnicity was not stated in 3% of records in 2025. ↩
-
Data used in the HMPPS workforce quarterly statistics are self-declared from HR records where ethnicity was known, as at 31 March 2025. Ethnicity was not stated in 13% of records in 2025. ↩
-
Self-declared from HR records reported table ‘3_4_JO_Trends in the Judicial Diversity Statistics, 2025 publication, the quoted figure covers all courts and tribunal judges. ↩
-
Self-declared from HR records reported table ‘3_5_JO_Magistrates’’ in the Judicial Diversity Statistics, 2025 publication; table 3 in Judicial Diversity Statistics 2021. ↩
-
Custodial sentence outcomes include detention and training orders, extended determinate sentences, indeterminate sentences, non-life sentences s90-92PCC Act 2000, offenders of specific concern under s236A of CJA 2003 sentences, serious terrorism sentences, special custodial sentence for terrorist offender of particular concern and standard determinate sentences. ↩
-
Indictable offences include indictable-only and triable either way offences. Indictable only offences are the most serious and must be tried at the Crown Court; summary offences are the least serious and must be tried at magistrates’ courts; and triable-either-way offences are of intermediate severity and may be tried at either court based on the circumstances of the case. See accompanying technical guide for further details. ↩
-
Non-custodial sentence outcomes include community sentences, suspended sentences, compensation, fines, absolute discharge, conditional discharge and otherwise dealt with. ↩
-
Throughout this chapter, where the term ‘significantly’ is used in isolation, this should be interpreted as meaning statistically significant. ↩
-
All persons – Companies, public bodies, etc. and Not knowns, were excluded. ↩
-
Indictable offences include indictable-only and triable-either-way offences. Indictable only offences are the most serious and must be tried at the Crown Court; summary offences are the least serious and must be tried at magistrates’ courts; and triable-either-way offences are of intermediate severity and may be tried at either court based on the circumstances of the case. See accompanying technical guide for further details. ↩
-
A plea value of ‘not applicable’ is for sentence cases at Crown Court, where the plea would have been entered at magistrates’ court, prior to being committed to Crown Court for sentencing. ↩
-
In the aggregated ethnicity models (5+1 classification), the reference category is the White ethnic group. For models using detailed ethnicity (18+1 classification), the reference category is White British. In the results tables, the reference category is provided in parentheses (). ↩
-
Full regression results and detailed tables are available in the accompanying tables. ↩
-
Full regression results and detailed tables are available in the accompanying tables. ↩