ESA: Work Capability Assessments, Mandatory Reconsiderations and Appeals: March 2020
Published 12 March 2020
Applies to England, Scotland and Wales

© Crown copyright 2020
This publication is licensed under the terms of the Open Government Licence v3.0 except where otherwise stated. To view this licence, visit nationalarchives.gov.uk/doc/open-government-licence/version/3 or write to the Information Policy Team, The National Archives, Kew, London TW9 4DU, or email: psi@nationalarchives.gov.uk.
Where we have identified any third party copyright information you will need to obtain permission from the copyright holders concerned.
This publication is available at https://www.gov.uk/government/statistics/esa-outcomes-of-work-capability-assessments-including-mandatory-reconsiderations-and-appeals-march-2020/esa-work-capability-assessments-mandatory-reconsiderations-and-appeals-march-2020
The latest release of these statistics can be found in the collection of ESA: outcomes of Work Capability Assessments statistics.
This is a summary of the latest National Statistics on the outcomes of completed Employment and Support Allowance (ESA) Work Capability Assessments (WCA). The publication covers information on both initial and repeat ESA assessments in Great Britain.
This release also includes:
- Mandatory Reconsideration (MR) registrations and outcomes to January 2020
- MR clearance times to January 2020
- ESA clearance times to September 2019
- completed initial WCA appeal outcomes for ESA claims with a start date to December 2018
- WCA outcomes of completed Incapacity Benefit (IB) reassessments
Note: Information is only available for claims that began at least 6 months following the assessment date, or 9 months following the date of claim. This is because of the time required to complete and process claims.
Universal Credit (UC) was rolled out to every jobcentre across Great Britain by December 2018 and has now replaced income-related ESA for most new claimants. This has greatly changed the volume and composition of new claims to ESA.
1. Main stories
The statistics show:
-
in the quarter to September 2019, 11% fewer claimants completed their initial WCA while the volume of repeat assessments increased by 4%, when compared to the previous quarter
-
of the 22,500 claimants who completed an initial WCA in the quarter to September 2019, 62% were assigned to Support Group (SG), 16% to Work Related Activity Group (WRAG) and 22% to Fit for Work (FFW) status
-
the number of registered MRs decreased from 3,700 in October 2019 to 2,400 in January 2020; 52% of completed MRs were not revised in January 2020
-
MR monthly median clearance time has increased to 16 days in January 2020
-
the average end-to-end clearance time for claimants completing their initial WCA decreased from 19 weeks in June 2019 to 14 weeks in September 2019
-
the number of appeals completed on initial FFW outcomes has decreased to 430 in the quarter to December 2018 – of these decisions, 27% were upheld and 73% were overturned at appeal
2. What you need to know
The sources of the statistics are:
- DWP’s benefit administration datasets including MR data
- healthcare provider assessment data
- HM Courts and Tribunals Service (HMCTS) appeals data for completed appeals
Experimental cohort statistics enable us to publish information on the different stages of the ESA claim process and better understand the claimant’s end-to-end journey through claiming ESA, WCA, MR and appeal.
A typical customer journey for an ESA claimant is as follows:
- Claimant registers for ESA – payment issued at assessment rate.
- Claimant referred for WCA and issued the “Capability to Work” questionnaire.
- Claimant completes and returns questionnaire.
- Assessment Provider (AP) may conduct face-to-face assessment and provides recommendation to DWP.
- DWP makes a decision based on the AP recommendation. Those found eligible for ESA are either placed in the WRAG, which offers support in preparing for work, or the SG if they are unable to work or complete work-related activity. Those not eligible are found FFW.
- If the claimant disagrees with this decision they can go onto raise an MR and then go on to appeal.
3. Initial and repeat ESA WCAs for October 2013 to June 2019 (Experimental Statistics)
The following Sankey diagram is based on experimental data, which includes MRs. The diagram gives a visual representation of the proportion of claimants in each of the stages of the ESA WCA claim process. The relative thickness of each segment indicates the volume of cases flowing through each stage.
Of 4.6 million ESA WCAs started between October 2013 and June 2019:
- 65% had a completed assessment; WCAs for the remaining claims are either still in progress or were closed by the claimant
- 400,000 MRs have been registered in relation to the 3,000,000 completed WCAs
- 99.7% of these MRs have been completed, with the original decision revised 16% of the time
- 25% of assessments with a completed MR also went on to complete an appeal; of these 100,000 appeals, 34% of DWP decisions were upheld
Overview of the WCA, MR, appeals process for initial and repeat ESA WCA, October 2013 to June 2019
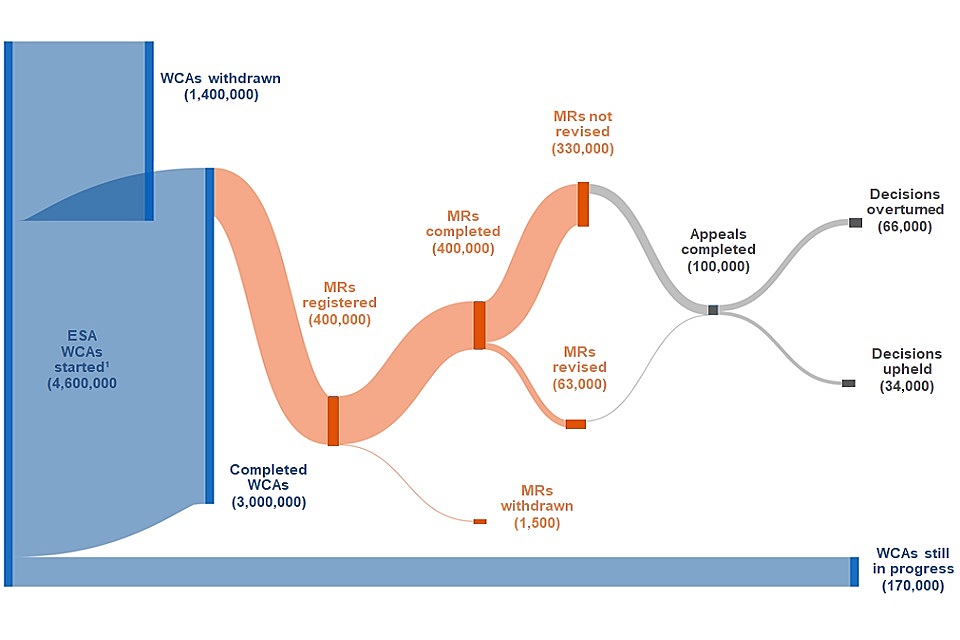
Most WCAs have been completed, few are still in progress. Of the completed assessments, only a small proportion proceed to the MR stage. Here, most of DWP decisions aren’t revised but very few claimants raise an appeal. The majority win in court.
Note: numbers may not sum to totals due to rounding. See the methodology note for further details
4. Assessment volumes and outcomes: ESA initial, repeat and Incapacity Benefit (IB) reassessments
Initial and repeat assessment volumes for all outcomes have increased this quarter.
Figure 1: All completed assessments by quarter, December 2008 to September 2019
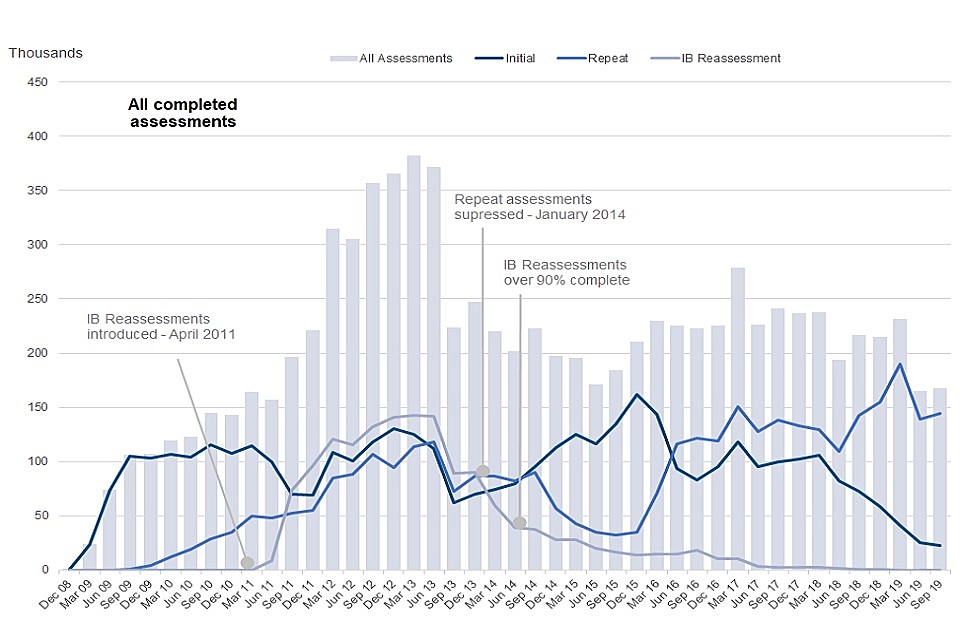
Initial WCAs continue decreasing and repeat assesments are increasing. IB reassessments are now almost fully complete, while initial and repeat assessments for ESA are still being processed
Source: Data tables: ESA outcomes of Work Capability Assessments.
The majority (87%) of ESA WCA assessments in the latest quarter were repeat assessments.
At the end of 2013, repeat ESA WCA assessment volumes dropped substantially as the focus moved to clearing new claims. During this period, claimants could still request a repeat assessment due to a change of circumstances, such as the development of a new condition or deterioration of the existing one.
After almost 2 years, processing was re-introduced for repeat assessments in December 2015. The numbers of repeat assessments have risen substantially from 35,000 in the quarter to December 2015 to 190,000 in the quarter to March 2019. Since then, numbers have fallen to stand at 140,000 in the latest quarter to September 2019.
In the quarter to September 2019, only 13% of completed assessments were initial ESA claims and less than 1% were IB reassessments.
After peaking in the quarter to December 2015, there was a downward trend in the number of completed initial ESA assessments, with initial assessments in the quarter to September 2019 reaching the lowest figure (22,000 initial assessments) since the introduction of ESA. This decrease is a result of the introduction of Universal Credit (UC) replacing most income-related new claims to ESA. The introduction of UC has greatly changed the volume and composition of new claims to ESA.
Figure 2: Initial and repeat assessment outcomes, December 2008 to September 2019
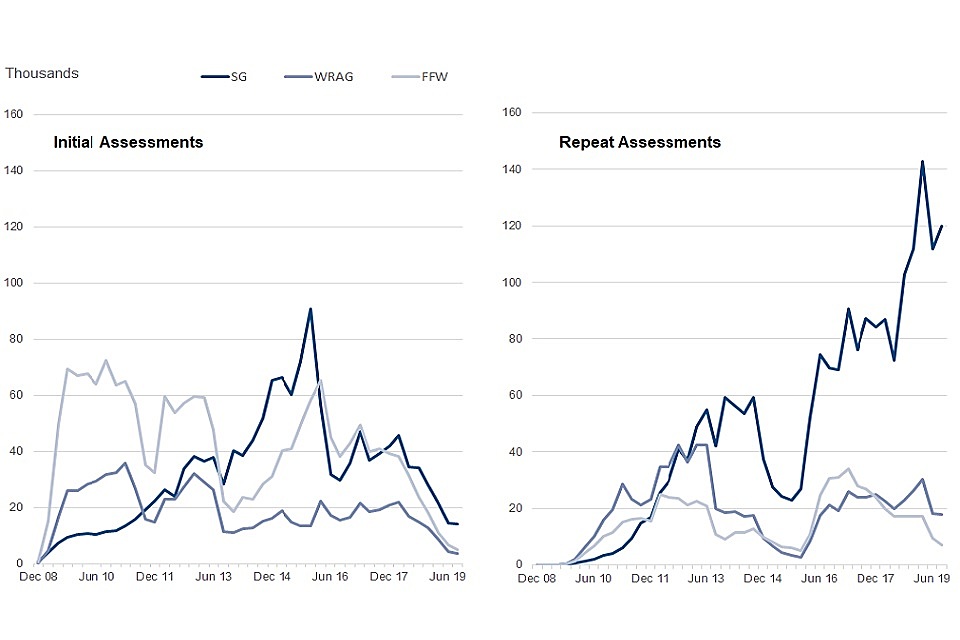
For repeat assessments (right), there is a predominance of SG allocation. For initial assessments (left), the proportion of outcomes is more balanced with SG accounting for the most allocations
Source: Data tables: ESA outcomes of Work Capability Assessments.
Of the 22,000 initial assessments completed in the quarter to September 2019, 18,000 resulted in ESA entitlement.
Figure 3: Assessment outcomes for ESA initial assessments, December 2008 to September 2019
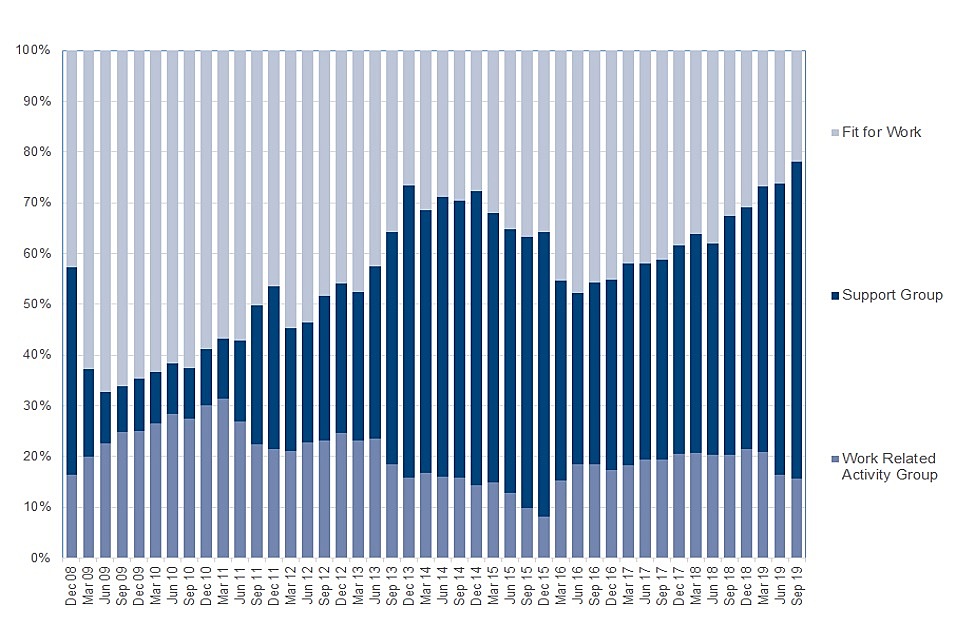
New claimants' proportions of allocation to ESA groups changed over time, with an increase in SG awards starting from June 2016. Currently, the SG sees the highest number of claimants, followed by FFW and WRAG respectively
Source: Data tables: ESA outcomes of Work Capability Assessments.
ESA and IB completed assessment outcomes for the latest quarter show sizable differences across claim types.
Figure 4: Assessment outcomes for ESA initial assessments
| ESA Initial | Percentages (%) |
|---|---|
| Support Group | 62% |
| Work Related Activity Group | 16% |
| Fit For Work | 22% |
Figure 5: Assessment outcomes for ESA repeat assessments
| ESA Repeat | Percentages (%) |
|---|---|
| Support Group | 83% |
| Work Related Activity Group | 12% |
| Fit For Work | 5% |
Figure 6: Assessment outcomes for IB reassessments
| IB Reassessment | Percentages (%) |
|---|---|
| Support Group | 80% |
| Work Related Activity Group | 15% |
| Fit For Work | 5% |
The proportion of ESA repeat assessments assigned to SG has increased from 80% last quarter to 83% this quarter, while the proportion found FFW has decreased by 2 percentage points.
The process of migrating IB claims onto ESA is almost complete. As a result, there were less than 100 IB reassessments completed in the latest quarter. Of these, the proportion assigned to SG increased by 5 percentage points since last quarter to stand at 80% in September 2019. The small change may be due to the low number of IB reassessments taking place.
The majority of ESA repeat and initial assessments are assigned to SG (83% and 62%).
Initial ESA assessments, when compared to ESA and IB repeats, show the largest FFW proportion (22%). This is expected as initial WCA claimants don’t have a known functionally-limiting condition.
5. ESA WCA Mandatory Reconsideration registrations, clearances and clearance times
MR registrations have followed a downward trend since the 22,000 peak in March 2017, to reach a record low of 2,400 in January 2020.
Figure 7: Mandatory reconsiderations registrations and clearances, October 2013 to January 2020
The volumes of registered MRs continues to fall, while the number of clearances has slighlty increased. The numbers of registered and cleared MRs are comparable.
Source: Data tables: ESA outcomes of Work Capability Assessments.
When the MR process was first introduced, the number of MR clearances was lower than the number of MRs registered. As the MRs became established, clearance volumes started increasing and became comparable to registration volumes in recent years.
The number of ESA WCA MR registrations is likely to be affected by the rollout of UC, as the number of new ESA claims is decreasing.
Figure 8: Mandatory reconsiderations median clearance times, October 2013 to January 2020
The median clearance time for MRs has been fluctuating in the last three years. In the last year, it has followed a decreasing trend. However, clearance times started increasing in recent months, to stand at 16 days in January 2020.
Source: Data tables: ESA outcomes of Work Capability Assessments.
The median MR clearance time fell to 6 days in August 2019, but has risen since then to stand at 16 days in January 2020.
Note: The MR average clearance times is derived using calendar days by calculating the median of the time taken from the date the MR is received in the Benefit Centre (BC) until the date the decision is cleared by the decision maker at the Dispute Resolution Team (DRT). These dates are obtained from the DWP Decision Making and Appeals Case Recorder (DMACR) reporting system. The total clearance time therefore includes the time taken to transfer the case to DRT.
6. ESA WCA Mandatory Reconsiderations outcomes
For the 3,300 MR completed, 52% of initial decisions were not revised in January 2020.
Figure 9: ESA WCA Mandatory reconsideration outcomes, October 2013 to January 2020
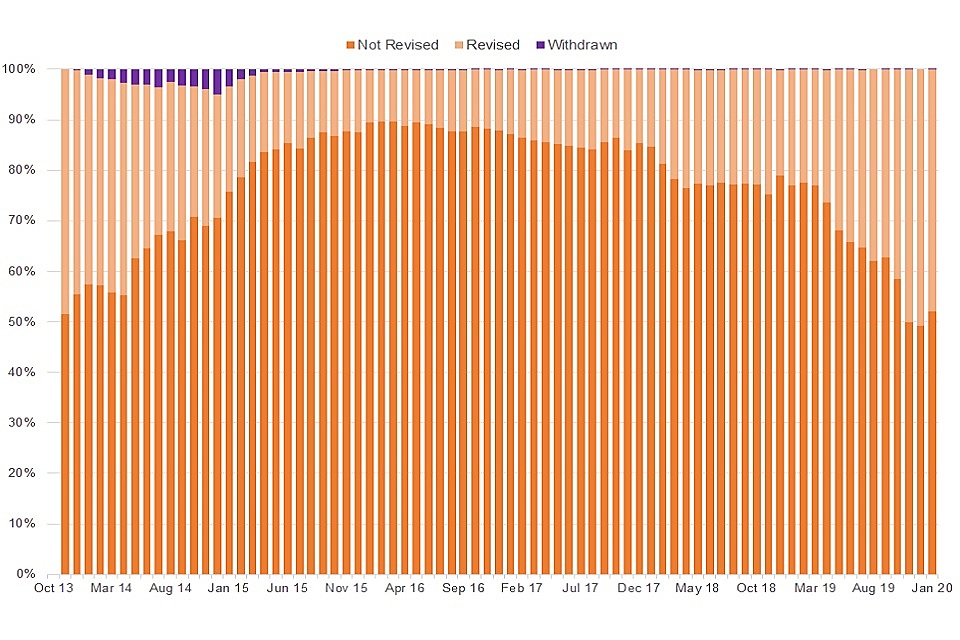
The majority of disputed decisions are not revised at reconsideration stage. Although the proportion of revised decisions has been increasing, these account for less than half the volume of disputes. A very small number of MRs gets withdrawn
Source: Data tables: ESA outcomes of Work Capability Assessments.
When MRs were first introduced, much higher proportions of decisions were revised than in later years but then gradually fell. Between March 2015 and January 2018, the proportion of revised decisions remained below 17%. Since then, these have gradually increased to stand at 48% in the latest month (January 2020).
The number of MR decisions made has fallen by 70% from January 2019 to stand at 3,300 in January 2020. This reflects the general pattern in the number of MR registrations.
Figure 10: Mandatory Reconsiderations – Decisions Made
| Decisions Made | Percentages |
|---|---|
| Customer failed to attend WCA, provide medical evidence or return questionnaire | 14% |
| Customer disputes FFW decision | 43% |
| Customer disputes ESA group | 43% |
The majority of ESA WCA MR raised in January 2020 were made on disputes about FFW and ESA group allocations.
Approximately 1,400 MR decisions (43%) were made on disputes about FFW assessment outcomes. Of all MR decisions made in January 2020, 14% were on disputes where the claimant had not followed the claim procedures correctly.
These reasons include failing to return the initial questionnaire, failing to provide medical evidence or not attending the assessment. Of these disputes, 59% were revised in the latest month.
Only 31% of FFW disputes resulted in a revision. These types of MRs are less likely to result in a change to the decision than the other categories.
Figure 11: Mandatory Reconsiderations – Decision Outcomes
| Decision Outcomes | Revised | Not Revised |
|---|---|---|
| Customer failed to attend WCA, provide medical evidence or return questionnaire | 59% | 41% |
| Customer disputes FFW decision | 31% | 69% |
| Customer disputes ESA group | 61% | 39% |
7. Appeals clearances and outcomes to December 2018
The number of appeals heard on initial FFW decisions continues to fall, reaching the lowest figure since the introduction of ESA in 2008.
Figure 12: Appeals outcomes on initial FFW decisions, December 2008 to December 2018
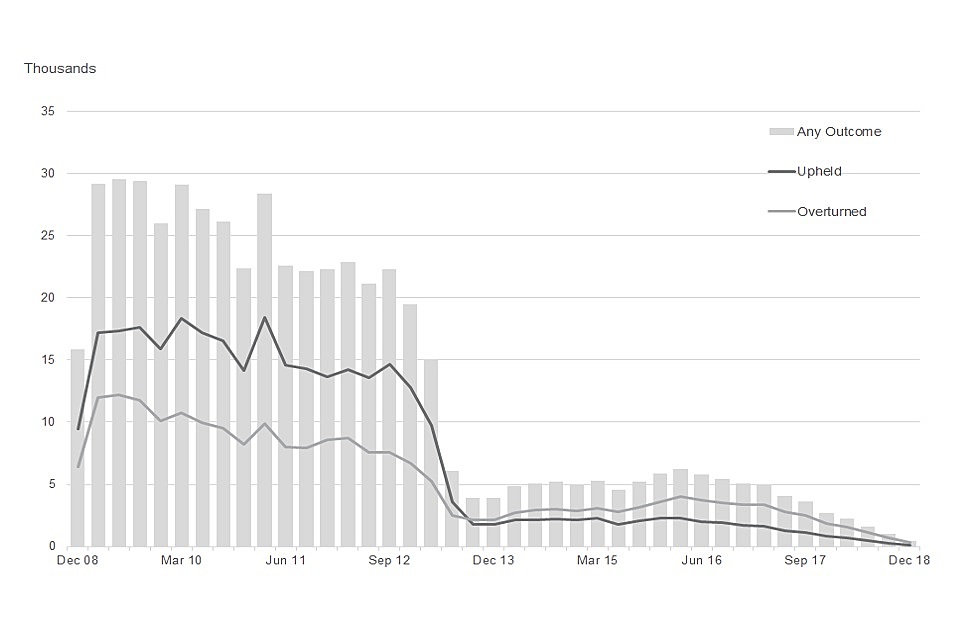
The volumes of appeals decreased sharply in 2013, after the introduction of Mandatory Reconsiderations. The proportion of appeals ruled in favour of the claimant has been increasing over time.
Source: Data tables: ESA: outcomes of Work Capability Assessments.
Being found FFW at initial assessment is the primary reason for claimants disputing a decision. These figures focus on FFW appeals for initial assessments.
The total number of appeals heard on FFW decisions for initial assessments is very low compared to pre-2013 figures, when mandatory reconsiderations were introduced. Figures have remained lower than pre-2013 levels over the last 4 reporting years.
The low numbers of appeals over recent years may be partly due to the introduction of the MR process, among other factors.
The chart shows that in the latest quarter to December 2018, the number of appeals heard on FFW decisions for initial assessments has decreased from 1,000 in the previous quarter to 430.
Note: These figures are grouped by claim start date, therefore numbers could increase as more appeals are completed for claims started in the most recent months.
Approximately 27% of initial FFW decisions were upheld at appeal this quarter and 73% were overturned.
Figure 13: Appeal outcomes for disputes on initial FFW allocation
| Appeal Outcome | Percentages |
|---|---|
| Upheld | 27% |
| Overturned | 73% |
The proportion of decisions upheld at appeal has decreased by 2 percentage points compared with the previous quarter (from 29% to 27%).
8. Health conditions and ESA group allocation for initial assessments
‘Severe functional disability’ is the main reason for SG allocation this quarter.
Figure 14: Main reasons for SG allocations for initial assessments, December 2008 to June 2019
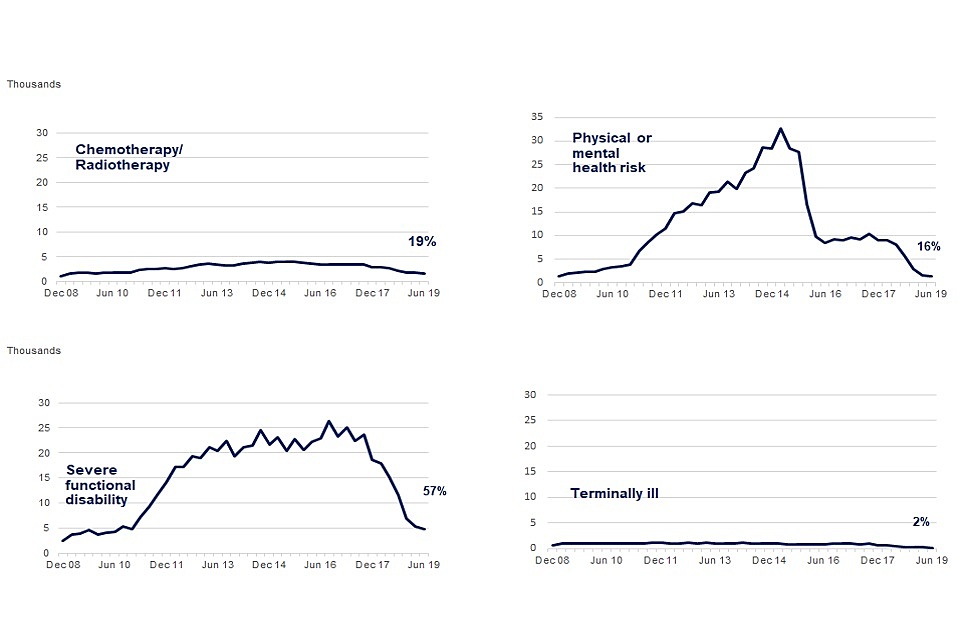
Claimants with Severe Functional Disabilities account for most of SG allocations, followed by cases on Chemotherapy/Radiotherapy. Their proportion remained quite stable, as well as terminally ill
Source: Data tables: ESA: outcomes of Work Capability Assessments.
Note: Recent falls in volumes across all groups are likely to reflect falls in ESA initial assessments as UC rolls out.
There was a notable decrease in allocations to the ‘Physical or mental health’ risk group for claims started from October 2015 onwards. Volumes in this group fell from 28,000 in the quarter to September 2015 to 17,000 in the quarter to December 2015. This could have been due to updated guidance on the application of risk introduced at the start of 2016.
For claims started in the quarter to June 2019, volumes allocated to the ‘Physical or mental health risk” category have decreased to 1,400.
Most claimants assigned to the SG, who started their initial ESA assessment in the quarter to June 2019, were allocated due to health conditions linked to ‘Severe functional disability’. This accounts for 57% of all SG allocations this quarter.
‘Terminally ill’ numbers have remained relatively low, accounting 2% of SG assignment reasons respectively for claims started this quarter.
Note: Since 29 September 2017, claimants in the ESA SG no longer need to be reassessed if they meet the Severe Condition criteria. Information on this can be found on Stat-Xplore.
‘Adapting to change’ and ‘Social interaction’ remain the main reasons for WRAG allocation (with 15 points or more) this quarter.
Figure 15: Main reasons for WRAG (15+ points) allocations for initial assessments, December 2008 to June 2019
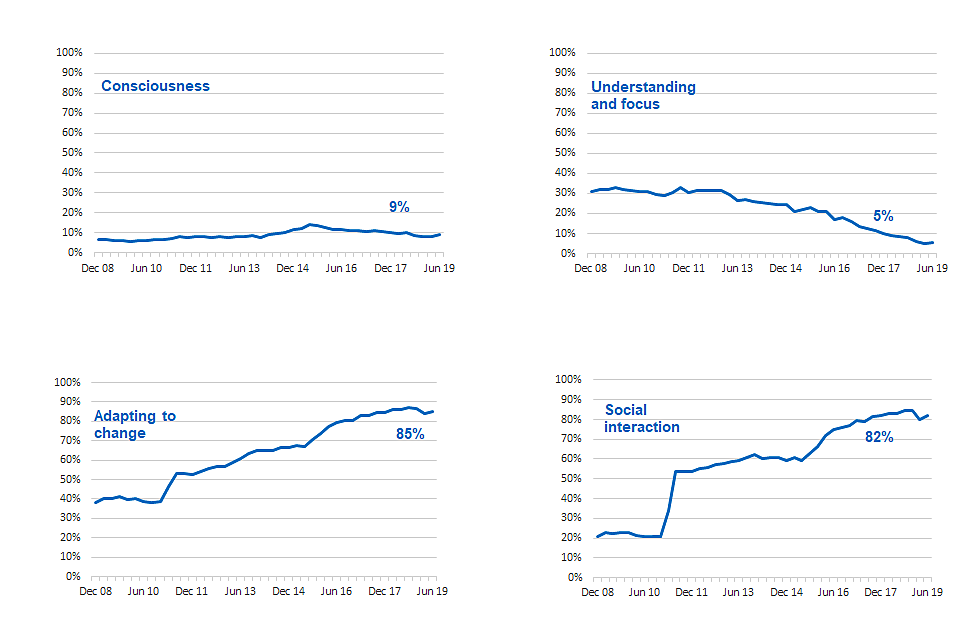
The vast majority of WRAG allocations, based on a score of 15+ points on the questionnaire, occur when the claimant struggles with social interactions and adapting to change. These cases have generally increased; the other major categories remain stable.
Source: Data tables: ESA: outcomes of Work Capability Assessments.
The charts show the 4 main functional impairment categories in which claimants have scored points when assigned to the WRAG, with 15 points or more at initial assessment.
Receiving 15 points or more is the main reason for assignment to the WRAG at initial assessment, however claimants can also be assigned to the WRAG at reconsideration or after appeal.
For claimants allocated to WRAG with 15 points or more, the most common categories for scoring points this quarter were ‘Adapting to change’ and ‘Social interaction’. Of these claimants, 85% had an ‘Adapting to change’ condition and 82% scored points in the ‘Social interaction’ group.
Note: Claimants can have multiple functional impairments, therefore appear in more than one category.
Other reasons for being assigned to WRAG (with 15 points or more) which aren’t shown are less common (Upper Limb, Sensory, Continence, and Lower Limb).
9. ESA WCA customer journey clearance times for initial claims (experimental)
For initial WCA’s completed in September 2019 the median end-to-end clearance time decreased by five weeks to stand at 14 weeks.
Figure 16: Clearance times (in weeks) for individual stages of the ESA WCA process
| Clearance Type | July 2019 (weeks) | August 2019 (weeks) | September 19 (weeks) |
|---|---|---|---|
| Claim Registration to WCA Referral | 1 | 1 | 1 |
| WCA Referral to Assessment Provider (AP) Recommendation | 10 | 8 | 9 |
| AP recommendation to DWP decision | 3 | 3 | 3 |
| End-to-End ESA claim | 21 | 18 | 19 |
Within this, the median time from the WCA Referral to Assessment Provider (AP) recommendation was 9 weeks in September 2019. This stage will usually involve a WCA assessment and includes the waiting time for the customer to complete and return the questionnaire. Multiple referrals are sometimes required before an assessment is completed and a recommendation received, as customers may not attend appointments or return questionnaires.
Note: The ‘end-to-end clearance times’ refer to time taken from claim registration to date of DWP decision. Claim registration date is the date the claimant has first contact with the department when making a claim to ESA. The DWP decision will include MRs where there is a completed decision.
ESA WCA median clearance times for completed initial claims up to September 2019 (experimental).
Figure 17: Median clearance times for completed initial claims, October 2008 to September 2019
The median clearance times for ESA claimants’ journey have been decreasing since the end of 2016. The end-to-end average estimate is now at 14 weeks, while the health assessment provider's average processing time is 9 weeks.
Source: Data tables: ESA: outcomes of Work Capability Assessments.
The chart shows end-to-end median clearance times (claim registration to final DWP award decision) for initial claims from October 2008 to September 2019. The end-to-end process accounts for the time between the customer’s referral to the AP and the AP recommendation.
In September 2019, the average time between referral to the AP and their recommendation was 9 weeks.
10. About these statistics
The UK Statistics Authority has designated these statistics as National Statistics, in accordance with the Statistics and Registration Service Act 2007 and signifying compliance with the Code of Practice for Statistics. This badge does not currently apply to the experimental cohort figures or ESA clearance times.
Key uses of the statistics include:
-
providing the evidence base for assessing the potential effect of changes, monitoring and evaluation of DWP policy
-
answering Parliamentary Questions and Freedom of Information requests and Forecasting benefit expenditure (in conjunction with expenditure statistics)
-
policy development and evaluation by local authorities and other welfare to work and pensions stakeholders and providers
This release only includes ESA and IB WCAs.
This release does not capture:
- UC WCAs
- UC MRs
- UC appeals
Recent trends in these ESA WCA statistics will be affected by the roll out of UC.
Terminology
| Term | Definition |
|---|---|
| Registration | Claimant registers an application for a WCA, MR or appeal. |
| Clearance | DWP decision maker has determined whether the claimant should or should not be entitled to claim ESA. |
| Mandatory Reconsideration | Claimant wishes to dispute a decision made on their claim and requests DWP to reconsider the decision. |
| MR clearance time | The clearance time begins from the point the MR is raised on the DWP administrative system by the Benefit Centre as a valid MR, having considered whether they can initially change the decision in the light of any new information. The total clearance time therefore includes the time taken to transfer the case to the Dispute Resolution Team and the time taken for the decision maker to make a decision. |
| Repeat assessment | An existing claim that has been reassessed for ESA, as opposed to a new claim. A repeat assessment is the second or subsequent WCA undertaken on an existing, continuous ESA claim, usually between 3 and 24 months after the previous assessment. These claimants will have already been assessed as having a limited capability for work at their initial WCA and the repeat assessment will assess if their capability for work has changed. |
Development of UC WCA official statistics
DWP are currently developing official statistics on numbers of UC claimants who go through a WCA and related outcomes. When the information will be robust and accurate enough for publication as official statistics, we will preannounce its release in the GOV.UK release calendar.
Where to find out more
See Stat-Xplore for more detailed breakdowns of the data covering Region, Local Authority and Westminster Parliamentary Constituency breakdowns available for WCA outcomes by claim start date and completed assessment date.
Read the methodology note for more detailed information on these statistics.
Read more about ESA.
Notification of future changes to this series
DWP statisticians improved the methodology of matching the HMCTS appeals data with ESA administrative data and implemented it in this release. The improved methodology has resulted in increases to the number of appeals for current and historic ESA WCA outcomes. The new methodology however has not changed the overall story or proportions of WCA appeals that are upheld or overturned.
Lead statistician: Ioana Criclevit
ISBN: 978-1-78659-205-7