English Private Landlord Survey 2021: main report
Updated 10 September 2024
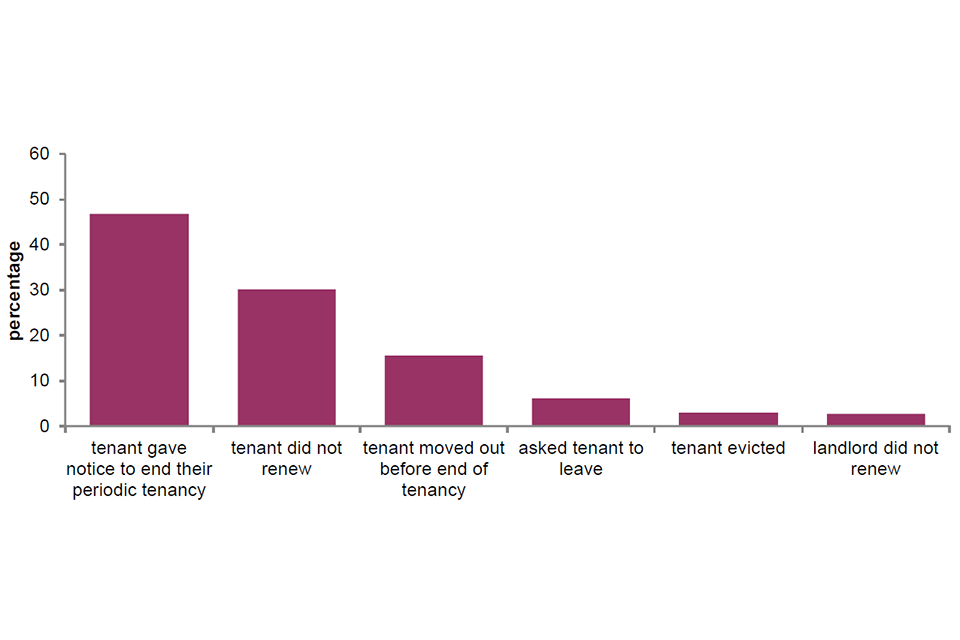
Applies to England

© Crown copyright 2024
This publication is licensed under the terms of the Open Government Licence v3.0 except where otherwise stated. To view this licence, visit nationalarchives.gov.uk/doc/open-government-licence/version/3 or write to the Information Policy Team, The National Archives, Kew, London TW9 4DU, or email: psi@nationalarchives.gov.uk.
Where we have identified any third party copyright information you will need to obtain permission from the copyright holders concerned.
This publication is available at https://www.gov.uk/government/statistics/english-private-landlord-survey-2021-main-report/english-private-landlord-survey-2021-main-report--2
Introduction and main findings
1. The English Private Landlord Survey (EPLS) is a national survey of landlords and letting agents[footnote 1] who own and/or manage privately rented properties in England. It was commissioned by the Department for Levelling up, Housing and Communities (DLUHC).
2. The aim of the EPLS is to inform government understanding of the characteristics and experiences of landlords and how they acquire, let, manage and maintain privately rented accommodation. Similar surveys of private landlords were carried out by the department in 2001, 2003, 2006, 2010 and 2018[footnote 2].
3. The private rented sector is characterised by diversity and looks very different now than it did more than a decade ago. The number of households in the sector rose by 45% between 2008-09 and 2020-21, from 3.1 million to 4.4 million households[footnote 3]. The private rented sector is now the second largest tenure in England, and is home to 19% of all households, compared to 14% in 2008-09, when it was smaller than the social rented sector. The private rented sector contains a wide range of different sub-markets, serving a wide range of different types of households across all incomes, including an increasing number of families. In 2020-21, 30% of households in the private rented sector included dependent children (1.3 million households). There are high rates of turnover in the private rented sector, with the number of house moves significantly higher than in the owner occupied and social rented sectors, both within the sector and between it and the other sectors.
4. Since 2010, there have also been a number of policy changes affecting private landlords. These include tax changes for Buy-to-Let landlords [footnote 4], changes to the Stamp Duty Land Tax, tightening lending criteria on Buy-to-Let mortgages and the growing role of the Build to Rent sector [footnote 5]. More recently, the government has announced plans to reform the private rented sector, including the removal of ‘no fault’ evictions under s. 21 of the Housing and Planning Act. Awareness of, and the impact of these factors is explored in this report.
5. Since the 2018 EPLS we have of course had the COVID-19 pandemic, with its related restrictions and subsequent impact on households’ financial security, income, attitudes towards the homes and future planning. In addition, some specific policies were introduced in response to the pandemic, for instance restricting landlords’ means of evicting tenants, and providing grants to those at risk of losing their homes.
6. This report provides an overview of the private landlord population in England in 2021. The first chapter covers the characteristics of landlords, why and how they became a landlord and how they view their current role. Chapter two presents an overview of landlords’ portfolios - private rented dwellings and the households living in them, including the types and location of rented homes and the types of tenants. It also explores how landlords set rents and the circumstances around how tenancies end. The third chapter examines landlord attitudes, including the willingness of landlords and agents to let to different types of tenants and views on longer tenancies. It also presents findings on compliance with current legal requirements. The fourth chapter looks at the impact of COVID-19 on the experiences and practices of private landlords, and the final chapter provides evidence regarding the likely future of the private rented sector by setting out findings about landlords’ stated future plans.
7. Full details of the survey sampling, weighting and reporting conventions are in the technical notes at the end of this report. Briefly, the EPLS is an online survey with a responding sample of over 9,000 landlords, all of whom are registered with one of the three government-backed Tenancy Deposit Protection (TDP) schemes [footnote 6]. The TDP administrative data shows there were just over 4.1 million live deposits registered with a TDP scheme in England in 2021. It is not known exactly what proportion of the private rented sector that is covered by the TDP schemes. From the English Housing Survey (EHS) in 2021-22 it is estimated that between 62% and 76% of households in the private rented sector are covered by a TDP scheme [footnote 7].
8. The EPLS is a survey of both landlords and agents. In 2021, we received responses from 300 or so agents. Given this relatively low number these responses are not reported on here. In addition, roughly 900 individuals who were identified as agents in the TDP data were in fact landlords (or both landlords and agents) and chose to participate from their landlord perspective. However, in many instances these participants were speaking about properties / tenancies separate to those from which they were sampled. Given this complexity, we have not included these cases in this analysis. The accompanying technical report gives more information about this.
Main findings
There are approximately 4.1 million live deposits registered with one of the three government-backed Tenancy Deposit Protection (TDP) schemes that operate in England. These correspond to an estimated 439,000 registrants (landlords and agents), only some (about 408,000) were landlords who had registered the deposits themselves.
- It is estimated that the TDP schemes cover between 62% to 76% of households in the private rented sector [footnote 8].
Just under half of all landlords owned one rental property, though nearly half of tenancies were owned by landlords with five or more properties.
-
43% of landlords owned one rental property, representing 20% of tenancies.
-
A further 39% owned between two and four rental properties, representing 31% of tenancies.
-
The remaining 18% of landlords owned five or more properties, representing almost half (48%) of tenancies.
Landlords who operated as individuals had smaller portfolios than those that operated as companies or organisations.
-
More than four-fifths (85%) of landlords operating as individuals had between 1 and 4 properties, with just under half (45%) owning 1 property.
-
Fewer than half of landlords that operated as companies or organisations owned between 1 and 4 properties, with just 11% owning 1 property. More than half (56%) owned 5 or more properties.
Individual landlords are more likely to identify as male than female. Male landlords are more likely to report having larger portfolios.
-
55% of landlords identified as male, whereas 44% identified as female.
-
Female landlords were more likely than male landlords to own one property – 55% of landlords owning 1 property were female, compared to 45% who were male. However, male landlords made up a higher proportion of all portfolio size categories owning 2 or more properties.
While more than half of landlords bought their first property with the intention of letting it out, just over a third originally bought their first rental property to live in themselves.
-
52% of landlord purchased their first property with the intention of renting it out. Over a third (35%) bought their first property to initially live in themselves.
-
Few landlords acquired their first rental property through inheritance (7%) or as a gift (1%).
Landlords setting rents for new tenants were more likely to increase rent above the level at which the property was last let. Landlords setting rents for renewals of existing tenancies were most likely to keep the rent at the same level.
-
For new tenancies, nearly half of landlords (45%) said they increased the rent compared to the previous tenancy, whereas 35% kept the rent at the same level, and 8% decreased the rent. 12% said that their most recent letting was the first time the property was let.
-
For renewals of existing tenancies, 64% of landlords kept the same rent, 26% increased it, and 4% decreased the rent on renewal.
Landlords evicting tenants in the last year most commonly did so by means of s. 21 (no fault eviction) notice. About a quarter said they used a s. 8 notice, meaning the tenant had broken the terms of the tenancy agreement[footnote 9].
-
Over two-thirds (67%) of landlords who evicted tenants or asked them to leave in the last year gave their tenants a section 21 notice. One in four (25%) gave a section 8 notice. This is the notice that landlords can give if tenants have broken the terms of their tenancy.
-
Over one-quarter (27%) said they asked their tenants to leave informally, and one in twenty (5%) offered to pay the tenants to leave.
Most landlords returned all or some of the deposit at the end of their last tenancy. Few said they returned none of the deposit.
-
Nearly two-thirds of landlords (62%) returned all of the deposit at the end of their last tenancy. Nearly a quarter (22%) returned some of the deposit.
-
Just 3% did not return any of the deposit, and under a tenth (9%) said they returned none of the deposit and the costs at the end of their last tenancy exceeded the deposit
Landlords were asked, based on a list of different characteristics of tenants, to which they were not willing to rent. Most landlords were unwilling to let to at least one type of tenant, most commonly, those with a history of rent arrears. Just 8% of landlords said they were willing to let to all groups of tenants on the list.
-
More than four-fifths of landlords (84%) were unwilling to let to tenants with a history of rent arrears. More than two-fifths (44%) were unwilling to let to tenants on either housing support or Universal credit.
-
Other characteristics of tenants landlords were unwilling to let to included students (48% unwilling) tenants with pets (45% unwilling) and tenants requiring adaptations to the property (44% unwilling).
On average, landlords reported having one tenant in arrears due to the Covid-19 pandemic. Landlords with larger portfolios reported having more tenants in arrears.
-
On average, landlords reported having one tenant in arrears due to the COVID- 19 pandemic. Nearly a third (29%) of landlords reported not having any tenants in arrears.
-
Landlords with 1 property most commonly had either 1 tenant in arrears (67%) or no tenants in arrears (29%) and rarely had more than 1 tenant in arrears. 15% of landlords with 2-4 properties and 38% of those with 5 or more properties had more than one tenant in arrears.
Most landlords reported that no tenants requested a new rent arrangement during the COVID-19 pandemic. Of those who did, the most common arrangements consisted of a reduced rent, or deferred rent with a repayment plan.
-
Seven out of ten landlords (72%) said that no tenants requested a new rent arrangement during the COVID-19 pandemic. Nearly one in five (18%) said they negotiated a new arrangement with one tenant, and 9% said they negotiated a new arrangement with more than one tenant.
-
Of those who agreed a new arrangement, 49% said this consisted of a reduced rent without anything in exchange and 31% said the arrangement involved a deferred rent with a repayment plan.
When asked about future plans for their portfolio, nearly half of landlords said that they would keep their portfolio the same. Two-fifths of landlords said they had not yet made plans. A similar number of landlords said they would increase their portfolios as said they would decrease or sell off their portfolio.
-
Nearly half of landlords (48%) said they planned to keep their portfolio the same size. Two-fifths (20%) of landlords, representing 14% of tenancies, said they had not yet made plans for their portfolio.
-
Similar proportions of landlords said they planned to increase their portfolio (11% of landlords, representing 15% of tenancies) as did decrease their portfolio (12% of landlords, representing 21% of tenancies) or sell off their portfolio (10% of landlords, representing 8% of tenancies).Main findings
Acknowledgements and further queries
9. The authors would like to thank the landlords and agents who gave up their time to complete the survey. We are indebted to colleagues from the three government-backed TDP schemes, without whom the survey would not have been possible. We are grateful to our colleagues at BRE who provided valuable advice and insight at both the questionnaire development and reporting stages of the project.
10. The research was conducted by NatCen Social Research in partnership with The Building Research Establishment (BRE). The project was led by Sarah Frankenburg and David Hussey of NatCen Social Research in close collaboration with DLUHC.
11. The EPLS has recently been given the status of ‘Official Statistics’. This designation means that the statistics were produced in accordance with the governance and operational arrangements set out in statistical legislation, and in compliance with the standards of best practice set out in the Code of Practice for Statistics. The methodology used to produce the statistics has not changed substantially from the 2018 EPLS.
12. If you have any queries about this report or would like any further information, please contact EPLS@communities.gov.uk.
13. The responsible analyst for this report is: Chauncey Glass, Housing and Planning Analysis Division, MHCLG who can be contacted via EPLS@communities.gov.uk.
14. Minor amendments to this report were made in August 2024. Full details of these amendments can be found on the main EPLS page
Chapter 1: Profile of private landlords
1.1. This chapter presents findings on the types and characteristics of landlords, their finances, their motivations for becoming a landlord and their perceived role as a landlord.
Landlord types
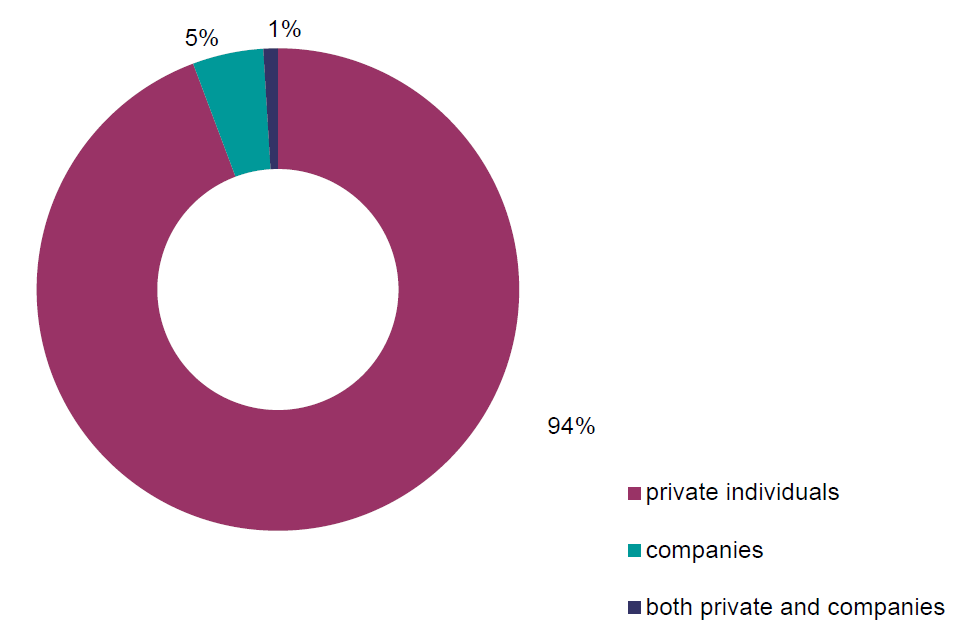
1.2. Landlords were asked how they currently let their property. The majority (94%) let property as an ‘individual or a group of individuals’, with 5% ‘as part of a company’ and the remaining 1% both as an individual/group of individuals and as part of a company, or ‘other’[footnote 10], Figure 1.1 and Annex Table 1.2.
Figure 1.1: Landlord population by landlord type, 2021
Base: all landlords
Note: underlying data are presented in Annex Table 1.2
Source: English Private Landlord Survey 2021
1.3. Most (84%) tenancies were represented by individual landlords, with companies representing 13% and those with both or other organisations 2%. In 2018, the picture was largely the same, Annex Table 1.3.
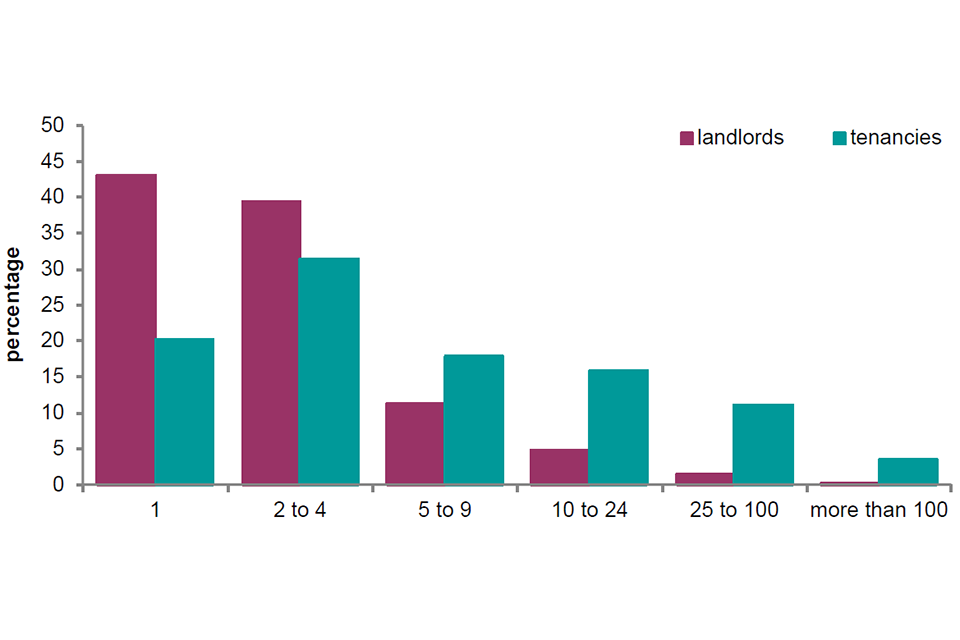
1.4. Landlords were asked how many rental properties they own in England. Almost half (43%) owned one rental property, representing 20% of tenancies.
A further 39% owned between two and four rental properties, representing 31% of tenancies. The remaining 18% of landlords owned five or more properties, representing almost half (48%) of tenancies, Figure 1.2.
Figure 1.2: Landlords by portfolio size
Base: all landlords and tenancies
Note: underlying data are presented in Annex Tables 1.4 and 1.5
Source: English Private Landlord Survey 2021
1.5 The portfolios of individual landlords were considerably smaller than those of companies and organisations. Most individual landlords (85%) owned between one and four properties, with just under half (45%) owning only one rental property. The remaining 15% of individual landlords owned five or more properties. By comparison, 44% of landlords operating as companies owned between one and four properties, with only 11% owning one rental property. Just over half (56%) owned five or more rental properties, including 13% who owned 25 or more, Annex Table 1.4 and 1.5.
1.6 Landlords with Buy-to-let mortgages were more likely to have multiple properties than those who have other types of loans, or those who do not have loans.[footnote 11] One in three (33%) landlords with a Buy-to-Let mortgage owned one property, with the remaining two-thirds (67%) owning two or more properties. Nearly two-thirds (62%) of landlords with other kinds of loans owned one property, up from half (51%) in 2018. For those with no borrowing, 53% of landlords had one property, and 47% had more than one property, Annex Table 1.6.
1.7 Landlords who had been letting for longer tended to have larger portfolios. Of landlords with eleven or more years’ experience, 68% had two or more properties, compared with 45% of those who had been letting for four to 10 years and 19% of those who had been a landlord for three years or less, Annex Table 1.7.
Age, ethnicity and time spent as a landlord
1.8 Individual landlords were asked questions about their personal characteristics and landlord journey.
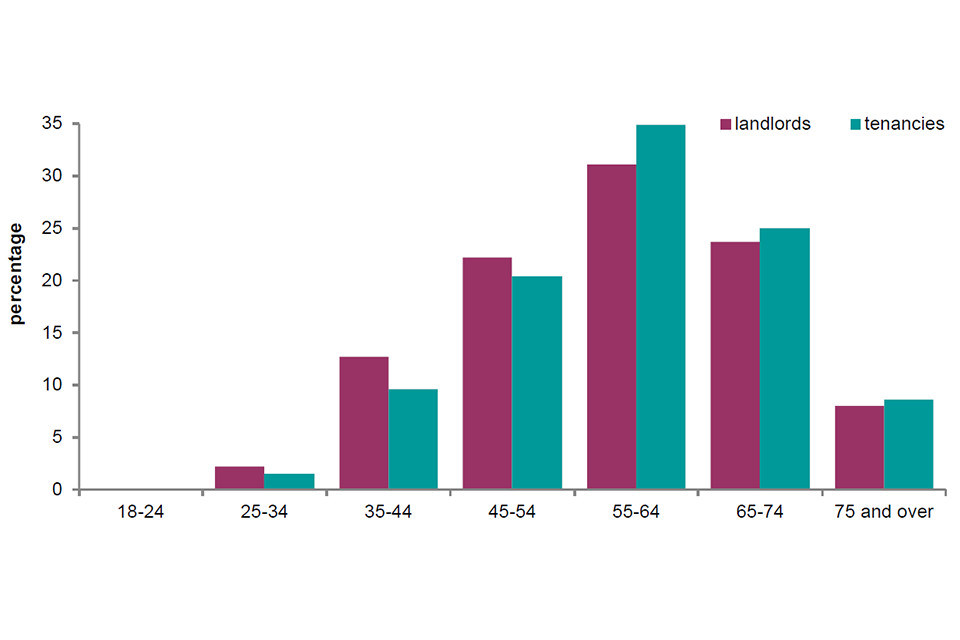
1.9 The median age of individual landlords was 58 years old. This is older than the general population. At the time of the 2011 Census, the median age for the population of England and Wales was 39 years[footnote 12]. Almost two-thirds (63%) of landlords were aged 55 or older, representing 68% of tenancies, Figure 1.3.
Figure 1.3: Landlords by age
Base: all individual landlords and tenancies
Note: underlying data are presented in Annex Table 1.8 and 1.9
Source: English Private Landlord Survey 2021
1.10. In terms of ethnicity, 88% of landlords identified as White, with 4% Indian, 2% Black, 1% Pakistani or Bangladeshi and the remaining 5% Other. Ethnicity did not vary much by portfolio size, Annex Table 1.10. In the 2011 Census statistics for England and Wales, 86% of the population identified as White, 3% Indian, 3% Black, 3% Pakistani or Bangladeshi and the remaining 5% Other[footnote 13].
1.11. 55% of landlords were male, 44% were female and 1% identified as ‘other’, Annex Table 1.13. Male landlords tended to own more rental properties than female landlords, Annex Table 1.12.
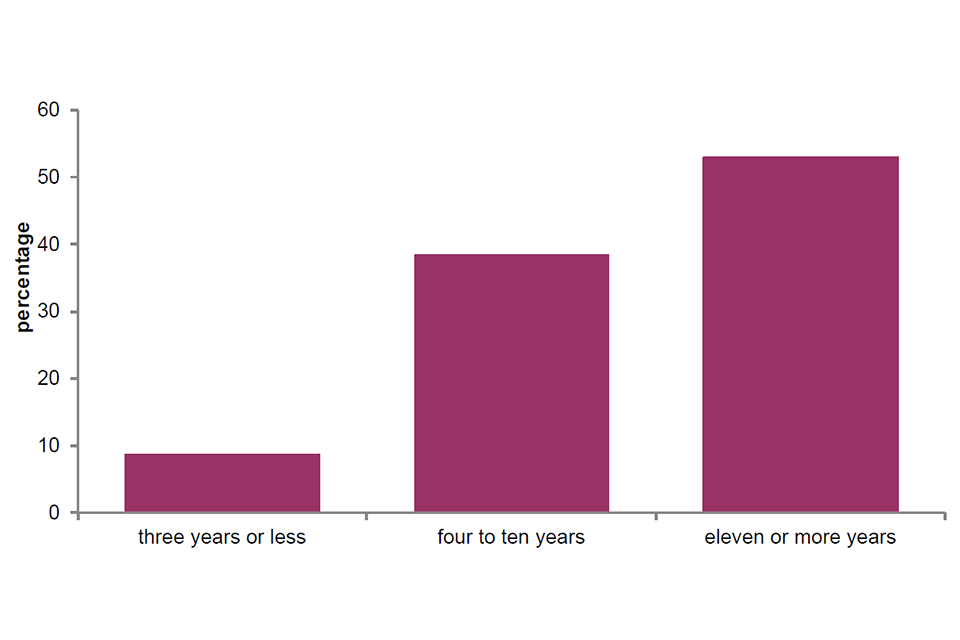
1.12 Less than half (47%) of landlords had been landlords for 10 years or less. In 2018, a higher proportion of landlords had been letting property for 10 years or less (56%), Figure 1.4.
Figure 1.4: Number of years as a landlord
Base: all individual landlords
Note: underlying data are presented in Annex Table 1.14
Source: English Private Landlord Survey 2021
Becoming a landlord and perceptions of the role
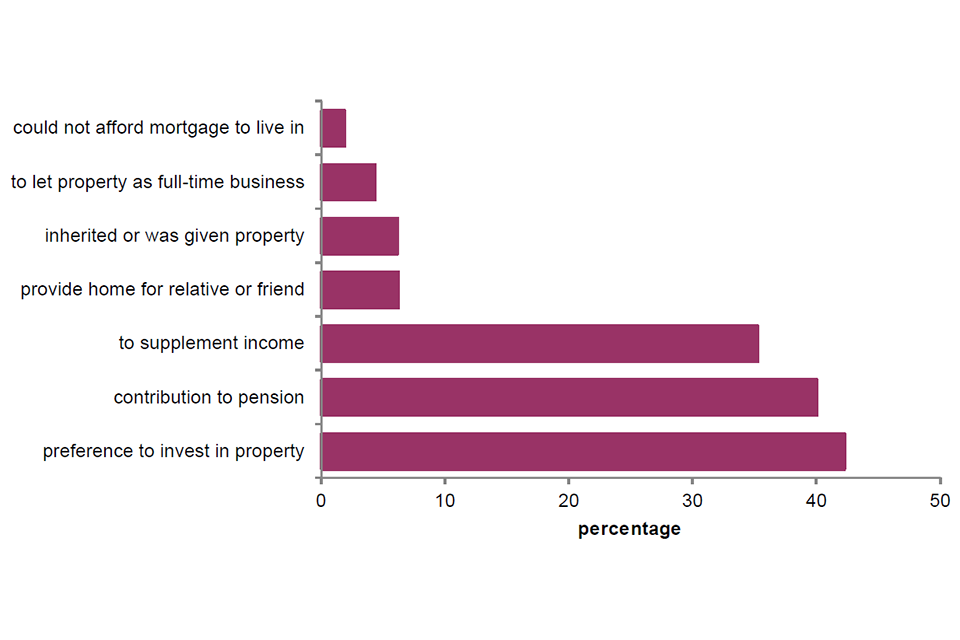
1.13 Landlords were asked to select the reasons they originally became a landlord. The two most prevalent reasons were a preference for investing in property rather than other investments (42%) and as a pension contribution (40%). Around a third (35%) said they wanted to supplement earnings or income. Smaller proportions said it was to provide a home for a relative, child or friend (6%), or because they inherited or were given their first rental property (6%). Only 4% originally became a landlord in order to let property as a full-time business, Figure 1.5. These figures are similar to findings for the 2018 survey.
Figure 1.5: Reasons for becoming a landlord
Base: all individual landlords
Notes:
1) underlying data are presented in Annex Table 1.15
- multi-code question. Responses add up to more than 100%
Source: English Private Landlord Survey 2021
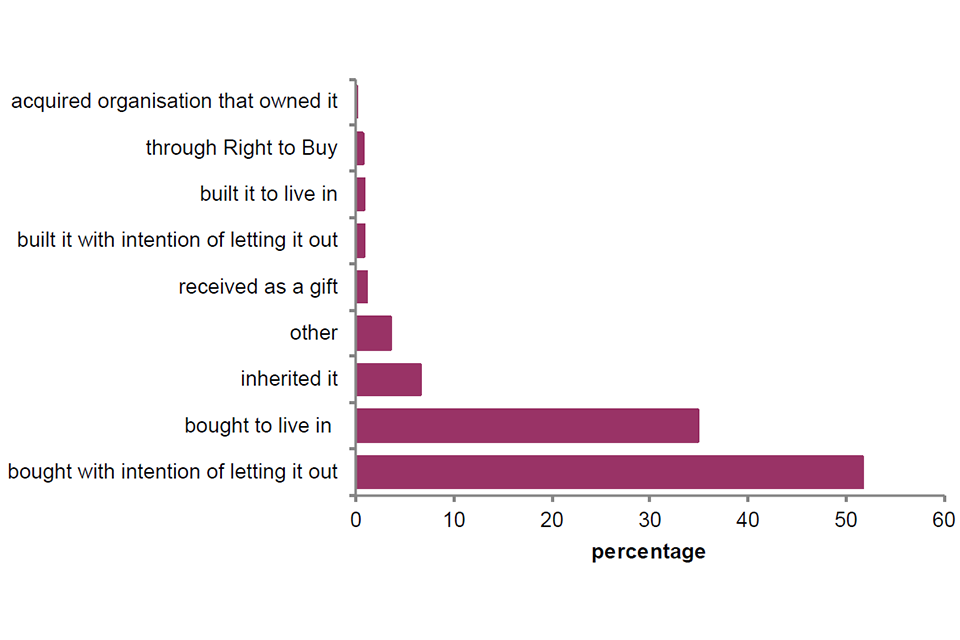
1.14 Landlords were asked how they acquired their first rental property. Although just over half (52%) bought it with the intention of renting it out, over a third (35%) bought it to live in themselves. Few landlords acquired their first rental through inheritance (7%) or as a gift (1%), Figure 1.6.
Figure 1.6: Acquisition of first rental property
Base: all individual landlords
Note: underlying data are presented in Annex Table 1.16
Source: English Private Landlord Survey 2021
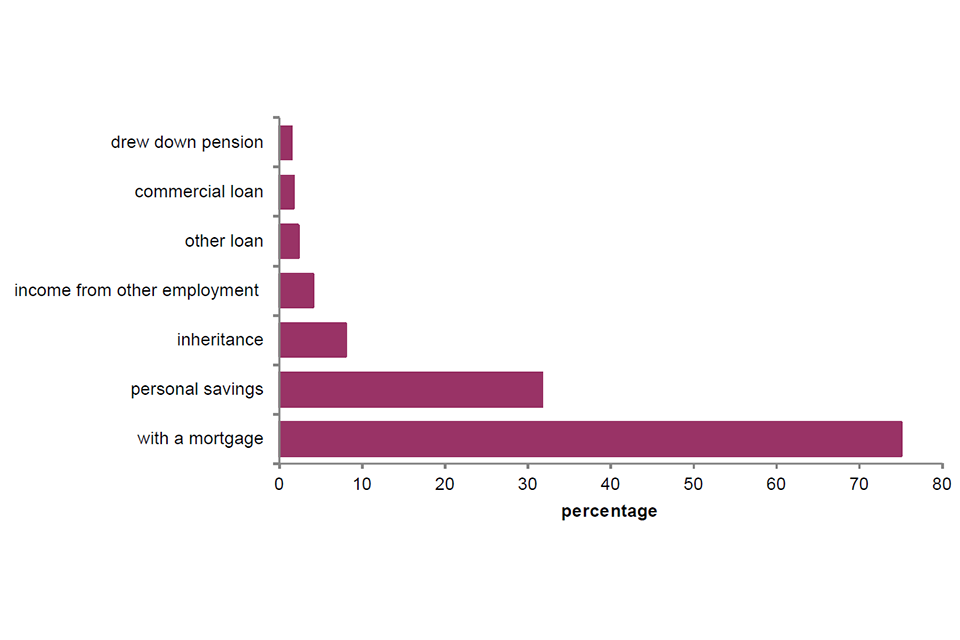
1.15 Landlords who had bought or built their first rental property were asked about the sources of funding for this purchase or build. Three-quarters (75%) reported using a mortgage, 32% used personal savings and 8% used an inheritance, Figure 1.7. Landlords with different portfolio sizes were equally likely to have used a repayment buy-to-let mortgage or an interest only conventional mortgage, but landlords with portfolios of five or more properties were more likely to have used interest only buy-to-let mortgages. Landlords with one rental property were more likely to have used a conventional repayment mortgage than landlords with multiple rental properties, Annex Table 1.17.
Figure 1.7: Funding of first rental property
Base: all individual landlords who purchased or built their first rental property
Notes:
- underlying data are presented in Annex Table 1.17
- multi-code question. Responses add up to more than 100%
Source: English Private Landlord Survey 2021
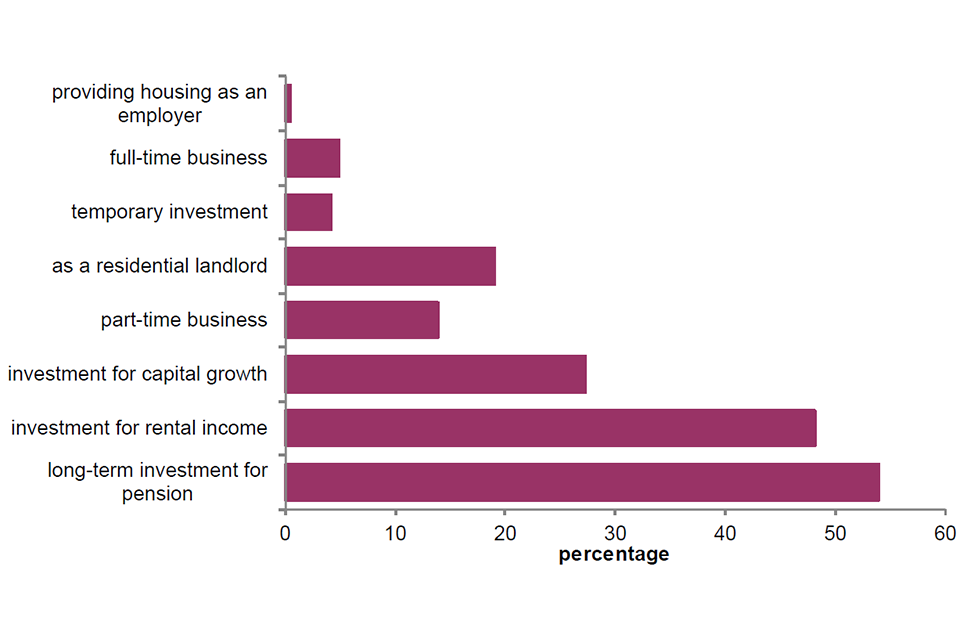
1.16 Landlords were asked how they viewed their role as a landlord. The most common role was ‘as a long-term investment to contribute to their pension’ (54%). More landlords viewed their role ‘as an investment for rental income’ (48%) than for capital growth (27%). The proportion of landlords who viewed their roles as a part-time business (14%) was slightly lower than those who viewed themselves as a residential landlord (19%). Few stated that their role as a landlord was as a full-time business (5%) or as a temporary investment (4%), Figure 1.8.
Figure 1.8: How landlords view their role
Base: all individual landlords
Notes:
1) underlying data are presented in Annex Table 1.19 and 1.20
2) multi-code question. Responses add up to more than 100%
Source: English Private Landlord Survey 2021
1.17 Buy-to-let landlords were more likely to view their role as landlord as a long- term pension investment (58%) compared to those with other kinds of loans or those with no debts or borrowing (44% and 51%). They were also more likely to view their role as a business, either full-time (7% vs 3% for landlords with other kinds of loan, and 2% for landlords with no borrowing), or part-time (18% vs 10% and 9%). They were more likely to view their role as an investment for capital growth (34% vs 25% and 19%), Annex Table 1.20.
Use of agents[footnote 14]
1.18 Landlords were asked whether they currently used an agent to let or manage their properties. Nearly half (49%) said they did not use an agent. A similar number (46%) used an agent for letting services, up from 34% in 2018. One in five (18%) used an agent for management services. Landlords with one property were more likely to say they did not use an agent (64%) compared to landlords with two to four properties (41%) or landlords with five or more properties (31%), Annex Table 1.21.
Membership of professional organisations
1.19 Landlords were asked if they currently or previously had belonged to one or more of the main rental property related professional organisations. The majority of landlords (71%) reported no current or previous membership of any organisation. This is down from 75% in 2018. One in five (21%) reported current or previous membership of the National Residential Landlords Association (NRLA). Eight percent reported current or previous membership of a landlord accreditation scheme, and three percent reported membership of some other professional rental or property organisation, Annex Table 1.23.
Economic activity and income
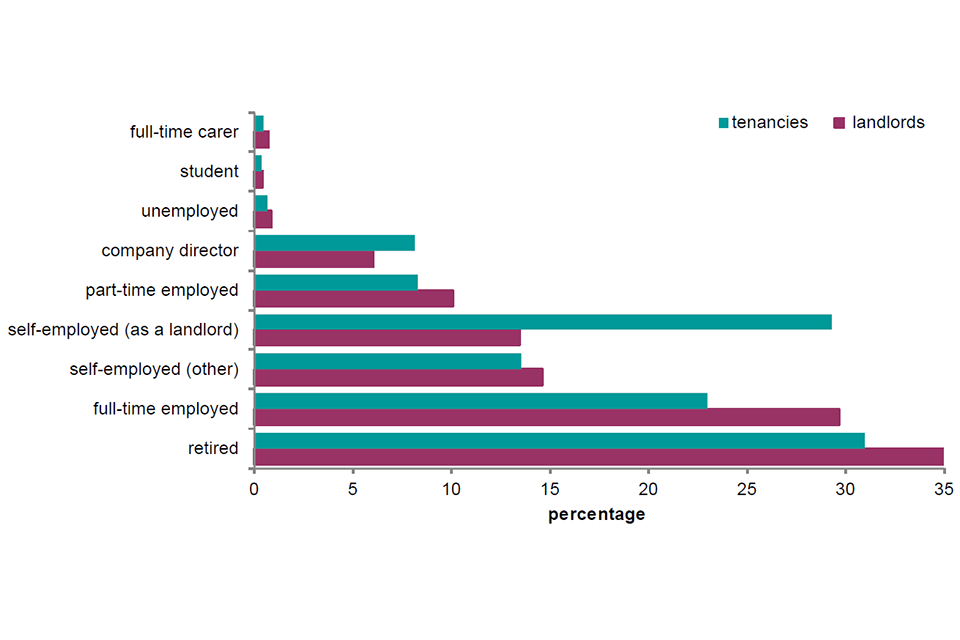
1.20 In 2021, 30% of landlords were employed full-time and 10% part-time. Over a third of landlords (35%) were retired. Less than a fifth (15%) of landlords were self-employed (not as a landlord), with a further 13% self-employed as a landlord[footnote 15]. Landlords with five or more properties were much more likely to be self-employed (as a landlord) (39%) compared to landlords with one property only (5%) or landlords with two to four properties (13%). Landlords with five or more properties are also less likely to be full-time employed (17% vs 37% and 26%), Figure 1.9 and Annex Table 1.24.
Figure 1.9: Employment status of landlords
Base: all individual landlords and tenancies
Notes:
1) underlying data are presented in Annex Table 1.24 and 1.25
2) multi-code question. Responses add up to more than 100%
Source: English Private Landlord Survey 2021
1.21 Landlords were asked for their total gross income (excluding rental income) over the previous 12 months. The median non-rental income was £24,000 per annum[footnote 16]. This has gone down from £25,000 in 2018. Over two-fifths (42%) reported a gross income of less than £20,000 and a smaller number (34%) reported between £20,000 and £49,999. Almost a quarter (23%) reported £50,000 or more, Annex Table 1.26[footnote 17].
1.22 Landlords were also asked for their total gross rental income over the previous 12 months[footnote 18]. The median rental income was £17,200. This has gone up from £15,000 in 2018. Over half (56%) of landlords had gross rental income of less than £20,000, and over a quarter (29%) reported between £20,000 and £49,999. Fifteen percent reported a gross rental income of £50,000 or more, Annex Table 1.27.
1.23 Total gross rental income over the previous 12 months varied regionally from a median of £10,500 in the North East to £22,000 in London, Annex Table 1.28.
1.24 Nearly one in five (18%) of landlords had a total income of over £100,000 in the last 12 months when this survey was taken. This percentage was highest (22%) for 45-54 year old landlords, Annex Table 1.30.
1.25 Looking at both income from rent and income from other sources, on average landlords received nearly half (47%) of their total income from rental property. This number was 42% in 2018.
Property values and borrowing
1.26 Landlords were asked the approximate value of their total rental property portfolio. The median total market value of landlord rental portfolios was £410,000. In 2018 it was £400,000. One in five (19%) landlords had portfolios they valued as less than £200,000. A further 36% had portfolios they valued from £200,000 to £499,999. Nearly a quarter (24%) had a portfolio they valued from £500,000 to £999,999, with the remaining 20% having rental property portfolios valued at £1 million or more, Annex Table 1.32.
1.27 The average (mean) estimated value per rental property for all landlords was £277,100, Annex Table 1.33[footnote 19]. As a comparison, the average house price in England in January 2022 was £273,800[footnote 20].
1.28 Landlords who reported using borrowing or loans to fund their rental property were also asked the approximate value of such borrowing[footnote 21]. The average (median) value of loans or borrowing was £200,000. This figure was £180,000 in 2018. One in four (24%) landlords using borrowing had loans of less than £100,000, with a further 37% having loans of between £100,000 and £300,000. The remaining two-fifths (39%) had loans of £300,000 or more, Annex Table 1.34.
1.29 The median equity or net value of all landlord rental portfolios was £220,000, calculated from the median value of landlord rental portfolios minus median value of loans or borrowing.
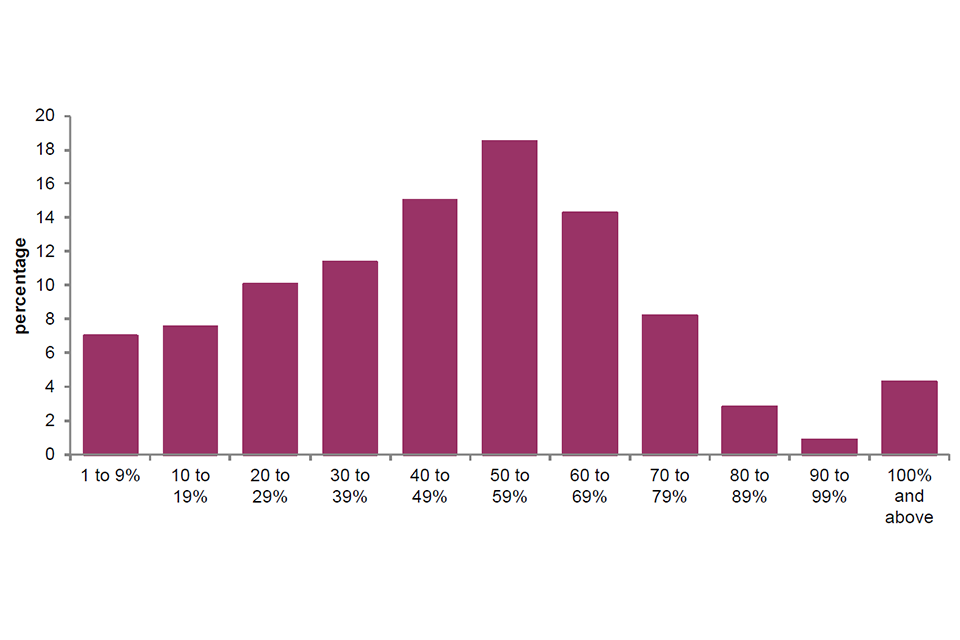
1.30 For those who had existing loans or borrowing, the loan-to-value ratio of the borrowing was calculated using the landlord’s estimate of their portfolio’s market value. The median loan-to-value ratio for these landlords was 48%. In other words, landlords had, on average, paid for just over half of their portfolio, and were in debt for the rest of the value. Over a third (36%) of landlords with debt or borrowing on their rental properties had a loan to value ratio of 39% or less, with another third (34%) between 40 and 59%. Nearly a quarter (22%) had a loan-to-value ratio of between 60 to 79%, with a further 4% having a loan-to-value ratio of 80% to 99%. 4% of landlords had an estimated loan-to-value ratio of 100% or more, Figure 1.10.
Figure 1.10: Portfolio loan to value ratios for landlords with debt
Base: all landlords with loans or borrowing
Notes:
1) underlying data are presented in Annex Table 1.35
2) cases with value of 100% or higher should be treated with caution
Source: English Private Landlord Survey 2021
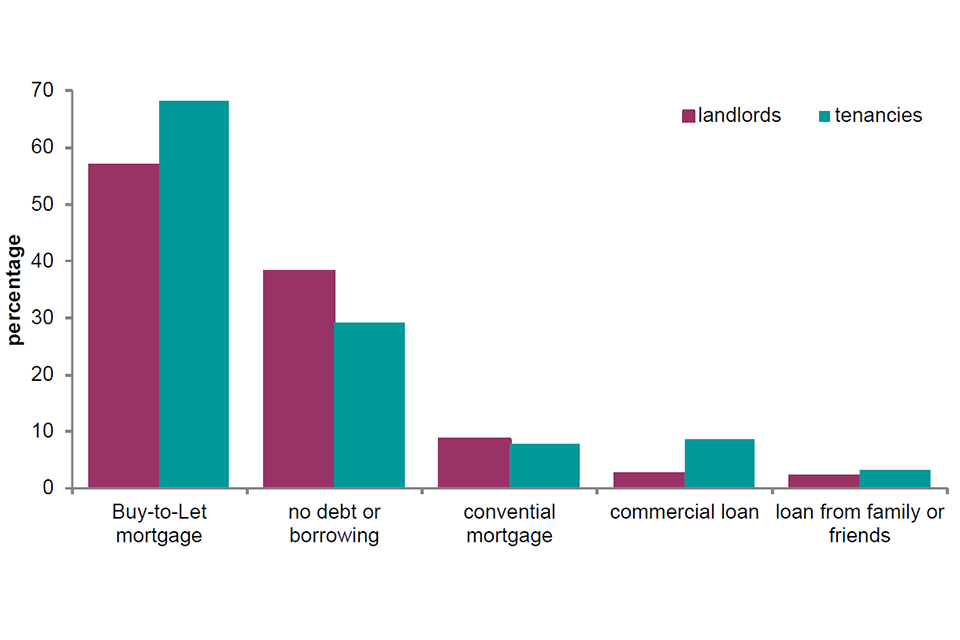
1.31 Landlords were asked which, if any, types of loans or borrowing they currently have to fund their rental property. Over half (57%) of landlords had a Buy-to- Let mortgage. More than a third (38%) of landlords had no debt or borrowing. Smaller proportions had a commercial loan (3%) or a loan from family or friends (2%), Figure 1.12. Landlords with five or more properties were more likely to have used each type of borrowing, with the exception of conventional mortgages. Landlords with one rental property were most likely to have used a repayment conventional mortgage, Annex Table 1.36.
Figure 1.11: Extent and type of borrowing for funding of rental property
Base: all landlords and tenancies
Notes:
1) underlying data are presented in Annex Table 1.36 and 1.37
2) multi-code question. Responses add up to more than 100%
Source: English Private Landlord Survey 2021
Chapter 2: Profile of dwellings and households
2.1 This chapter presents findings on the types of dwellings that private landlords let and the households that live in them. It also provides findings on recent rent setting practices, the reasons for ending tenancies and the use of deposits.
Profile of dwellings
2.2 In 2021, there were 1,023,762 deposits registered by landlords. As noted, these don’t necessary correlate directly with the number of properties that landlord may own, as some properties will have more than one deposit registered (for example HMOs) and some properties may not have a deposit registered at all, Annex Table 2.1.
2.3 Landlords were also asked to indicate any type of rental property they currently owned, let or managed across their whole portfolio.
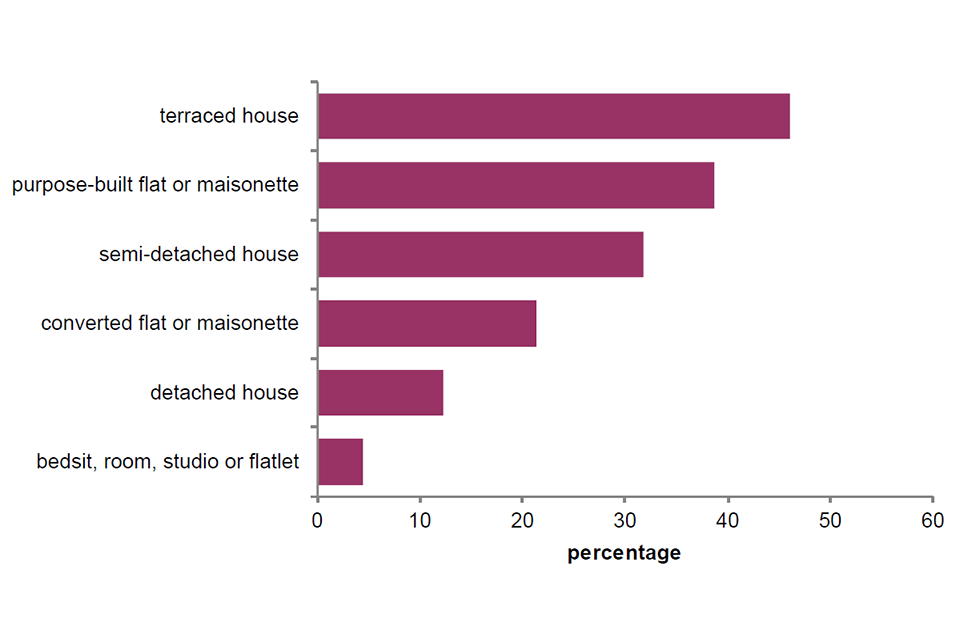
2.4 Terraced properties were the most commonly let (46% of landlords), followed by purpose-built flats (39%), semi-detached houses (32%), converted flats (21%), detached houses (12%) and bedsits, rooms or flatlets (4%), Figure 2.1.
Figure 2.1: Type of rental property currently let or managed by landlords
Base: all landlords
Notes:
1) underlying data are presented in Annex Table 2.2
2) multi-code question. Responses add up to more than 100%
Source: English Private Landlord Survey 2021
Profile of households
2.5 Landlords were asked to indicate which types of tenants they currently let to.
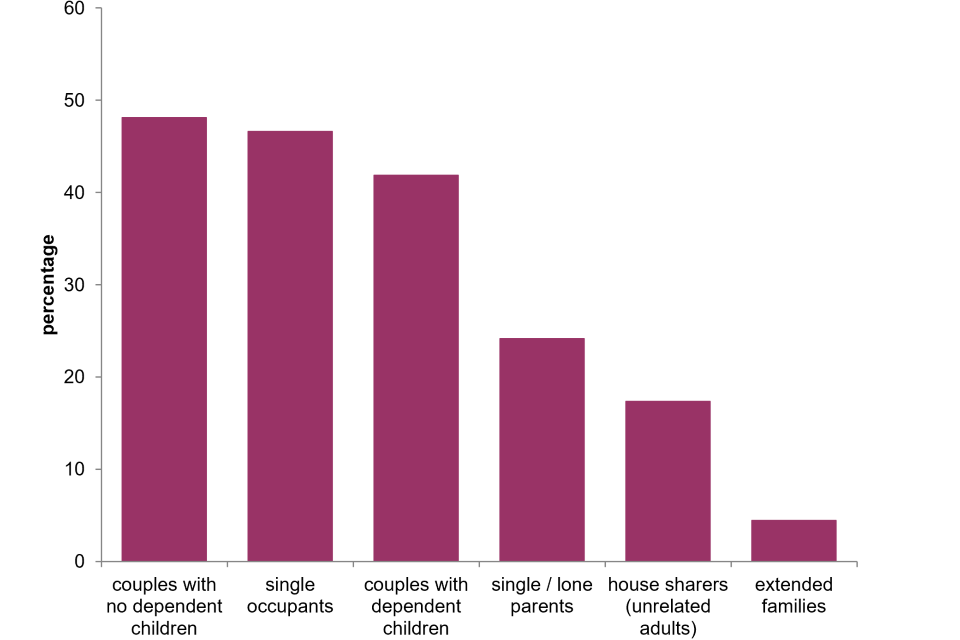
2.6 The most common demographic types of tenants that landlords let to were couples without dependent children (48%), with dependent children (42%), and single occupants (47%). Relatively fewer landlords and agents reported letting to any lone parents (24%), house sharers (17%) or extended families (4%).
2.7 The most common economic type of tenant that landlords currently let to is white collar, clerical or professional workers (60%), followed by blue collar or manual workers (39%). Around one in six landlords let to people in receipt of Housing Benefit or Local Housing Allowance (17%), people in receipt of Universal Credit (16%) and retired people (16%). Around one in nine let to students (11%) and non-UK workers (10%). Fifteen percent of landlords say that they do not let to any of these types of tenants, Annex Table 2.4.
Figure 2.2: Types of tenants landlords currently let to
Base: all landlords
Notes:
1) underlying data are presented in Annex Table 2.4
2) multi-code question. Responses add up to more than 100%
Source: English Private Landlord Survey 2021
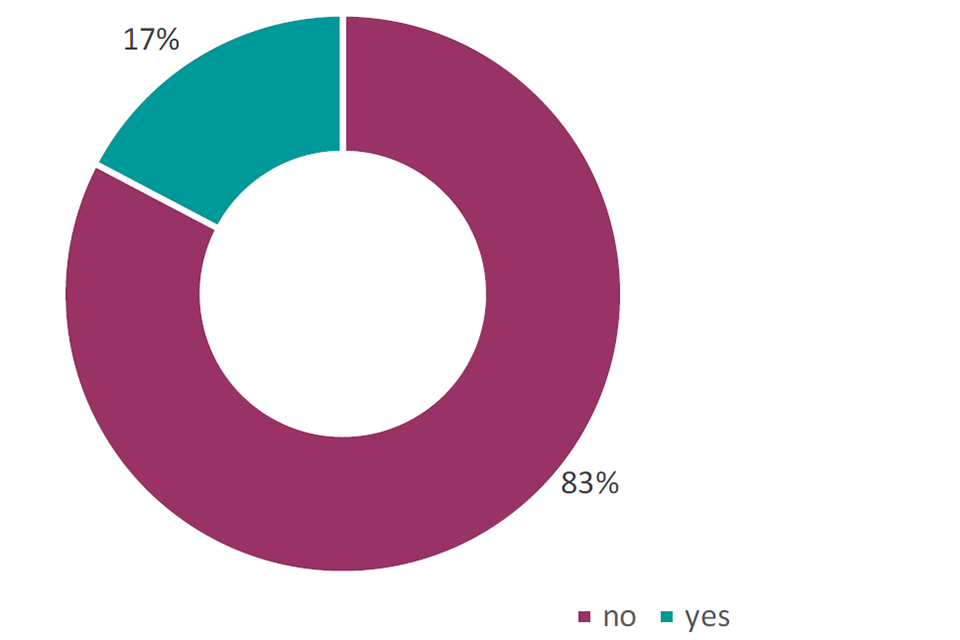
2.8 Landlords were asked whether any of their current tenants received Housing Benefit, Local Housing Allowance or Universal Credit. Seventeen percent of landlords stated that at least one of their tenants claimed one of these benefits, Figure 2.3.
2.9 Of landlords who have a tenant who receives housing support, landlords with fewer properties are more likely to have a higher proportion of their portfolio who receive housing support. For three in five (63%) landlords with two to four properties who had a tenant receiving housing support, over half of their portfolio received housing support. This number was one in four (24%) for landlords with five or more properties who had a tenant receiving housing support, Annex Table 2.6.
Figure 2.3: Whether any current tenants receive benefits
Base: all landlords
Notes:
1) for landlords most recent letting
2) underlying data are presented in Annex Table 2.5
3) benefits include Housing Benefit, the Local Housing Allowance and Universal Credit
Source: English Private Landlord Survey 2021
Setting rents and contracts
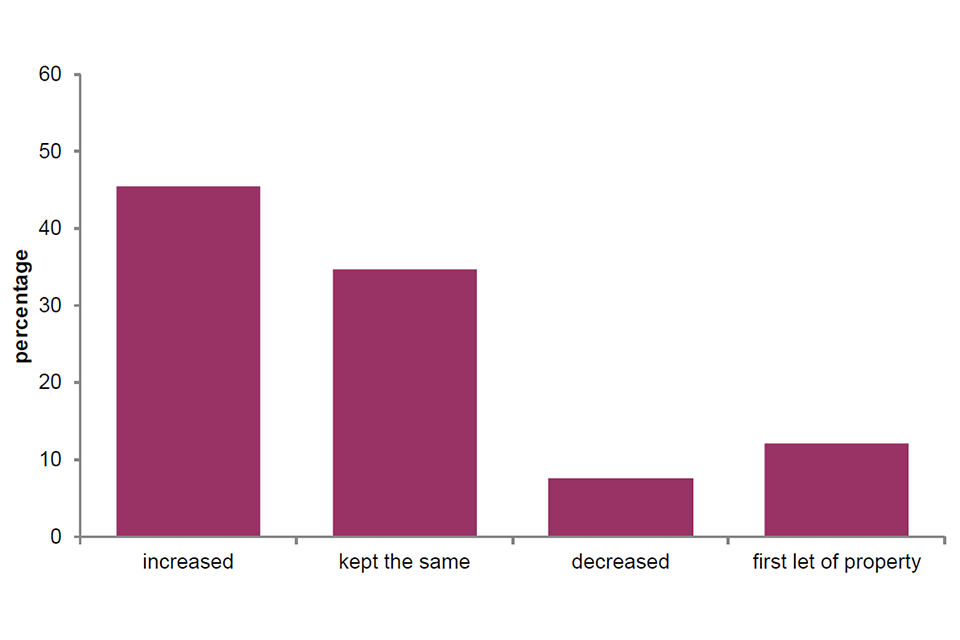
2.10 Landlords were asked, for their last letting to a new tenant, whether they had increased, decreased or kept the rent the same, compared to the previous tenancy. Nearly half (45%) of landlords increased the rent, just over one third (35%) kept the rent the same, and 8% decreased the rent[footnote 22], Figure 2.4.
Figure 2.4: Setting rents for new tenants in most recent letting
Base: all landlords
Notes:
1) for landlords most recent letting to a new tenant
2) underlying data are presented in Annex Table 2.7
Source: English Private Landlord Survey 2021
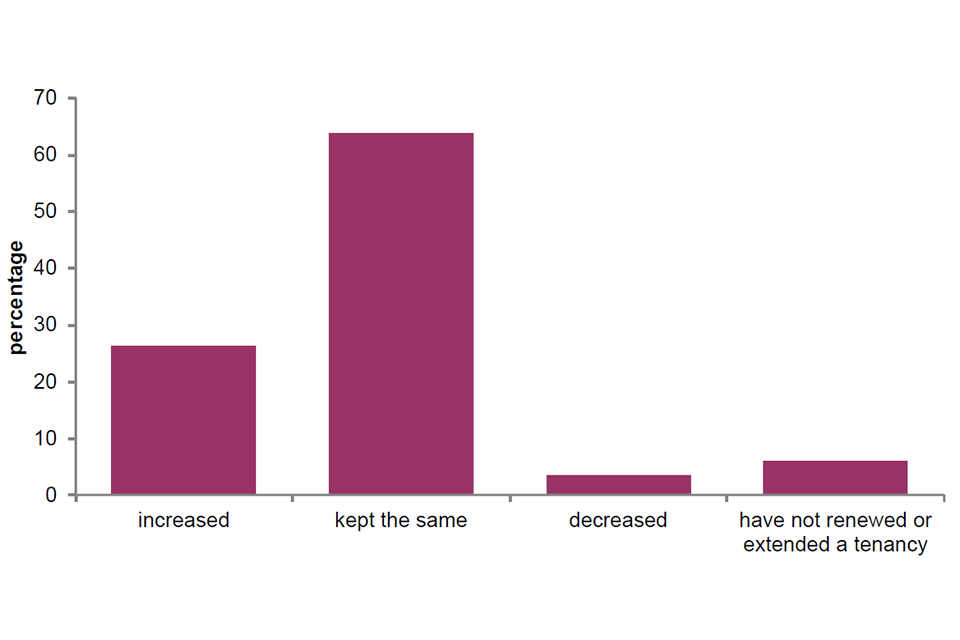
2.11 Landlords were also asked, for the last time they renewed or extended a tenancy, whether the rent had been increased, reduced or kept the same. Nearly two-thirds of landlords (64%) kept the rent at the same rate, just over a quarter (26%) increased it, and a small number of landlords (4%) decreased the rent[footnote 23], Annex Table 2.8.
2.12 Nearly three-quarters of landlords said that market rents in the local area was a factor that influenced their rent setting (71%), making this the most common factor. Agent advice was the next most common factor, with 34% of landlords citing this as a factor. One-fifth (20%) cited tenant demand or lack of demand, Annex Table 2.9.
2.13 For landlords who increased their rent above their previous rent setting, or landlords who kept rent the same, market rents in the local was the most commonly cited influencing factor (82% and 63% respectively). The most frequently given reason for decreasing rent was to avoid a lengthy void period (50%), Annex Table 2.10.
Figure 2.5: Setting rents for existing tenants in most recent renewal or extension
Base: all landlords
Notes:
1) for landlords and agents most recent tenancy renewal or extension
2) underlying data are presented in Annex Table 2.8
Source: English Private Landlord Survey 2021
Tenancies that ended
2.14 Landlords who reported a tenancy ending within the last two years were asked why this tenancy (or these tenancies) had ended.
2.15 The most common reason, selected by nearly half (47%) of landlords was that the tenant gave notice to end their periodic tenancy. Under a third (30%) reported that it was the end of the tenancy and the tenant decided not to renew. Sixteen percent of landlords reported that tenants had moved out before the end of the tenancy.
2.16 Other reasons for tenancies ending included the landlord or agent asking the tenant to leave (6%), the landlord or agent evicting the tenant (3%) and it being the end of the tenancy and the landlord decided not to renew (3%), Figure 2.6.
2.17 The proportion of tenancies ending for these reasons did not vary much by different landlord type or portfolio size, Annex Tables 2.12 and 2.13.
Figure 2.6: Reasons tenancies ended
Base: all landlords who had a tenancy end in the last two years
Notes:
1) underlying data are presented in Annex Table 2.11
2) multi-code question. Responses add up to more than 100%
Source: English Private Landlord Survey 2021
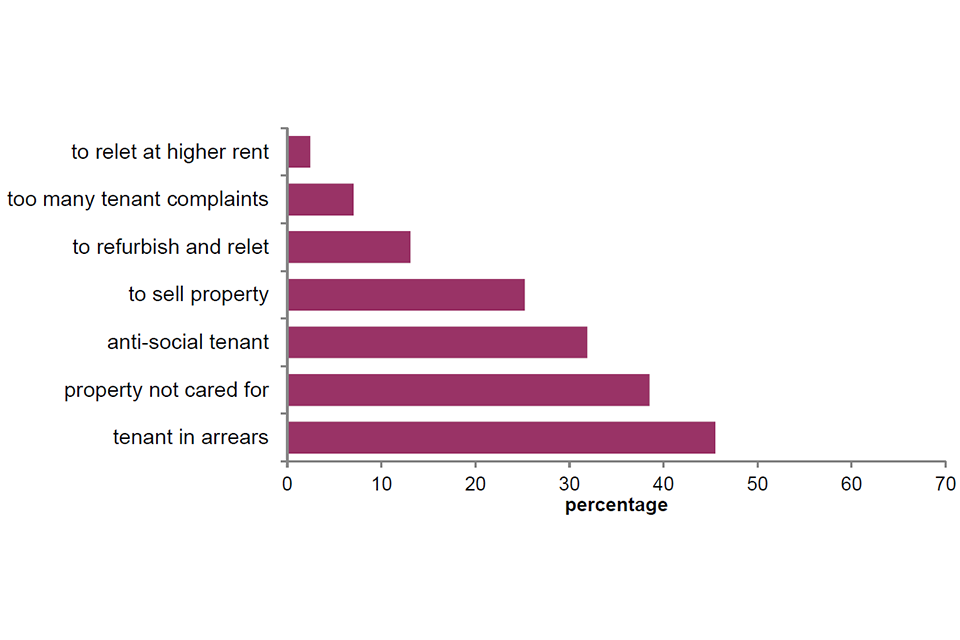
2.18 Where landlords and agents reported that they had chosen to end a tenancy in the last two years either by asking the tenant to leave, not renewing a tenancy or evicting a tenant, they were asked to select the reasons for this.
2.19 The most common reason to end tenancies, selected by nearly half (46%) of landlords, was that the tenant was in arrears. Roughly two in five (39%) landlords chose to end a tenancy because the property was not cared for, and a just under a third (32%) because the tenant engaged in anti-social behaviour.
2.20 Other reasons for ending the tenancy included to refurbish the property and re- let it (13%), to sell the property (25%) and because the tenant had too many complaints about the property (7%). Two percent of landlords ended a tenancy to let the property at a higher rate, Figure 2.7.
2.21 Of landlords who had evicted tenants in the last year, over two-thirds (67%) gave their tenants a section 21 notice. One in four (25%) gave a section 8 notice. This is the notice that landlords can give if tenants have broken the terms of their tenancy. Over one-quarter (27%) asked their tenants to leave informally, and one in twenty (5%) offered to pay the tenants to leave, Annex Table 2.15.
Figure 2.7: Reasons tenancies were ended by the landlord or agent
Base: all landlords who ended a tenancy in the last two years
Notes:
1) tenancies were ended by the landlord or agent if they did not renew the tenancy, asked the tenant to leave, or evicted the tenant
2) underlying data are presented in Annex Table 2.14
3) multi-code question. Responses add up to more than 100%
Source: English Private Landlord Survey 2021
Deposits
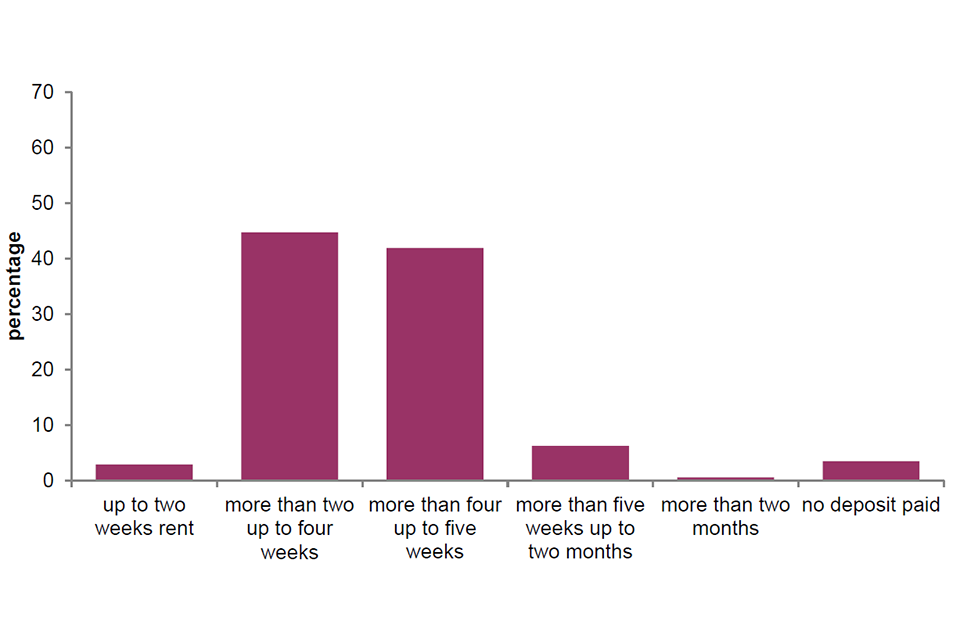
2.22 Landlords were asked how much the deposit was for their most recent letting. Because all of the landlords in EPLS have registered deposits, we expect the proportion of landlords who did not take a deposit for their last letting will be lower than in the general landlord population[footnote 24]. As expected, most (96%) landlords in the EPLS took a deposit for their last letting.
2.23 Almost half of landlords (48%) took a deposit that was up to four weeks’ rent. Most other landlords (42%) took a deposit that was more than four and up to five weeks’ rent. A deposit of more than five weeks’ rent was taken by 6% of landlords, Figure 2.8.
Figure 2.8: Amount of deposit collected from tenants for most recent letting
Base: all landlords
Notes:
1) for most recent letting
2) underlying data are presented in Annex Table 2.16
Source: English Private Landlord Survey 2021
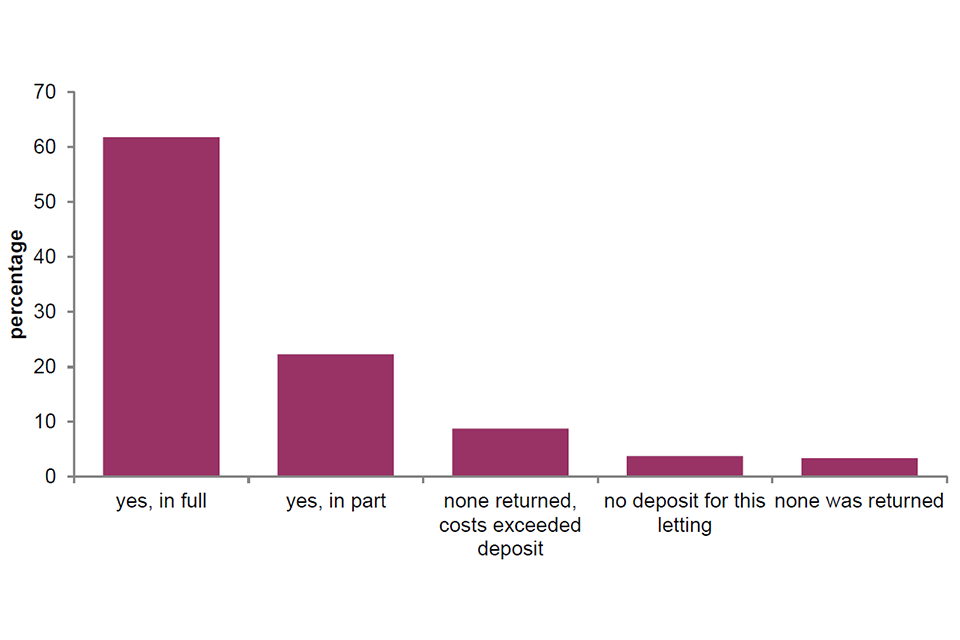
2.24 If they had had a tenancy that ended in the last two years, landlords were asked whether and how much of the deposit was returned to the tenant for the most recently ended tenancy. The majority of landlords returned all or some of the deposit to the tenant, with 62% returning all and 22% returning part, Annex Table 2.17.
2.25 More than a tenth of landlords (12%) say they did not return any of the deposit, with 9% not returning any deposit where the costs they faced exceeded the value of the deposit. 4% of landlords reported that there was no deposit on their most recently ended tenancy, Figure 2.9.
2.26 Landlords who ended a tenancy because they wanted to sell the property were most likely to return the deposit in full (46%). Landlords whose tenants did not care for the property or were in arrears were the least likely to return the deposit in full (13% and 11% respectively), Annex Table 2.18.
Figure 2.9: Whether the deposit was returned for most recently ended tenancy
Base: all landlords who had a tenancy end in the last two years
Notes:
1) for the last tenancy that ended in the past two years
2) underlying data are presented in Annex Table 2.17
Source: English Private Landlord Survey 2021
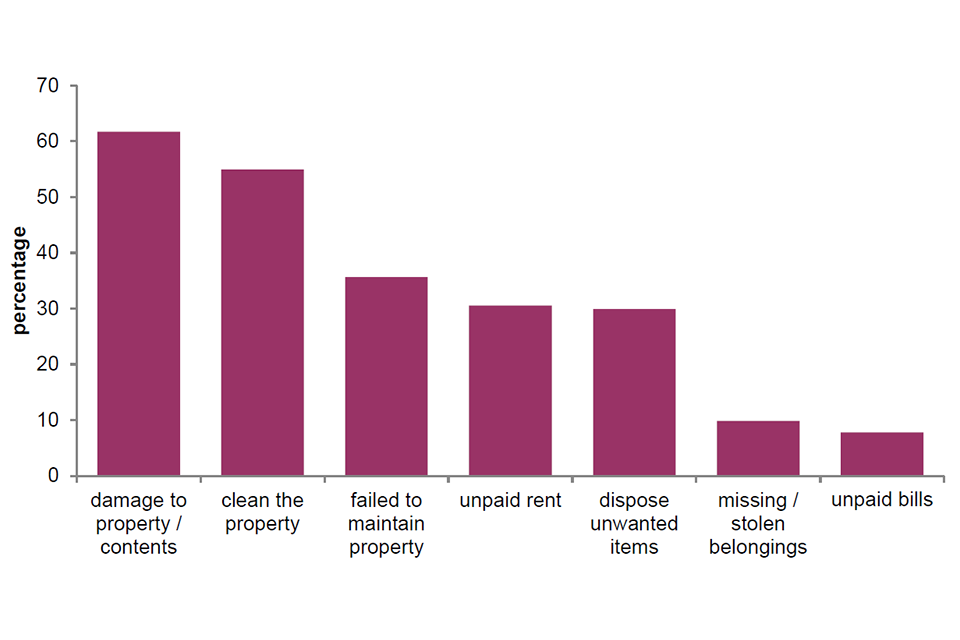
2.27 Landlords who did not return the deposit for their most recently ended letting (either in part or at all) were asked why. The most common reasons were due to damage to the property or contents (62%) and to clean the property for the next tenant (55%).
2.28 Other common reasons for retaining deposits included failure to maintain the property (36%), unpaid rent (31%) and to dispose of unwanted items left behind (30%), Figure 2.10.
Figure 2.10: Reasons for not returning deposits for most recently ended tenancy
Base: all landlords who had a tenancy end in the last two years
Notes:
1) for the last tenancy that ended in the past two years
2) underlying data are presented in Annex Table 2.19
3) multi-code question. Responses add up to more than 100%
Source: English Private Landlord Survey 2021
Chapter 3: Landlord attitudes and practices
3.1 This chapter presents findings on landlord attitudes to letting to a range of different types of tenants and towards offering longer tenancies. It also explores landlord compliance with a range of different legal requirements and best practice concerning the letting, management and maintenance of their properties.
Willingness to let
3.2 Landlords were asked, from a list of different types of tenants, which, if any, they were not willing to let to. The findings about the number of tenancies affected by these practices are available in Annex Table 3.2.
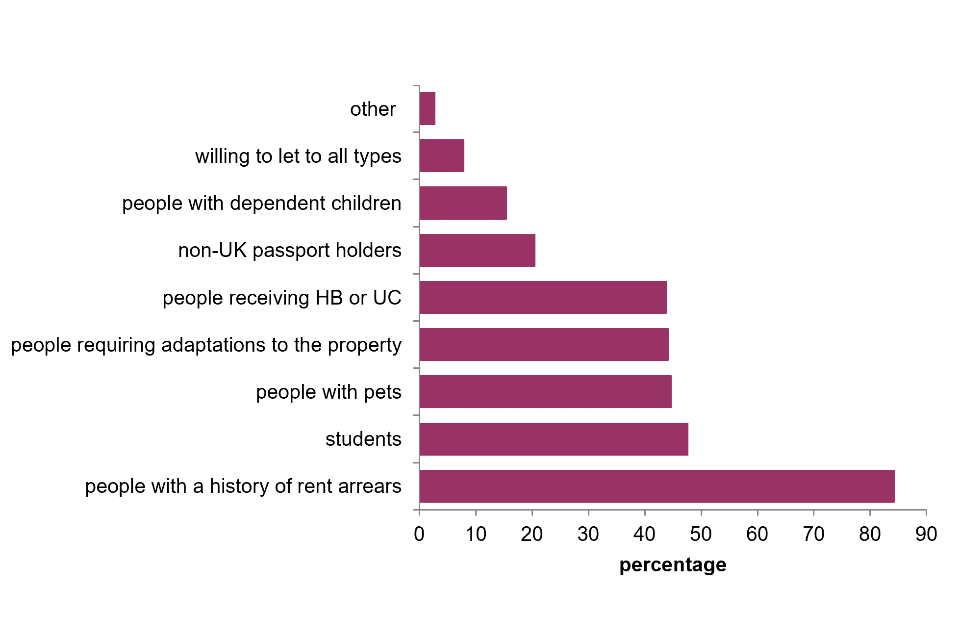
3.3 Most respondents reported being unwilling to let to at least one type of tenant listed, while 8% reported being willing to let to all types of tenants, Annex Table 3.1 and Figure 3.1. This is a lower proportion than found in the 2018 survey, where 26% of landlords reported being willing to let to all types of tenants listed. It is worth noting however that the 2021 question included a longer list of tenant types than 2018, which may have contributed to this change.
3.4 Tenants who landlords were unwilling to let to included those with a history of rent arrears (84% unwilling) and those in receipt of Housing Benefit or Universal Credit (44% unwilling).
3.5 Furthermore, around half (48%) were unwilling to let to students, and 44% and 45% were unwilling to let to people requiring adaptations to the property and people with pets, respectively.
3.6 More than a third (37%) of landlords with five or more properties were unwilling to let to people receiving Housing Benefit or Universal Credit. Landlords with either one or two to four properties showed less willingness (both at 45%) to let to these tenants. Landlords with smaller portfolios also reported being less willing to let to people with dependent children, with pets, or requiring adaptations to the property, than landlords with five or more properties, Annex Table 3.3.
Figure 3.1: Types of tenants not willing to let to
Base: all landlords
Notes:
1) underlying data are presented in Annex Table 3.1
2) multi-code question. Responses add up to more than 100%
Source: English Private Landlord Survey 2021
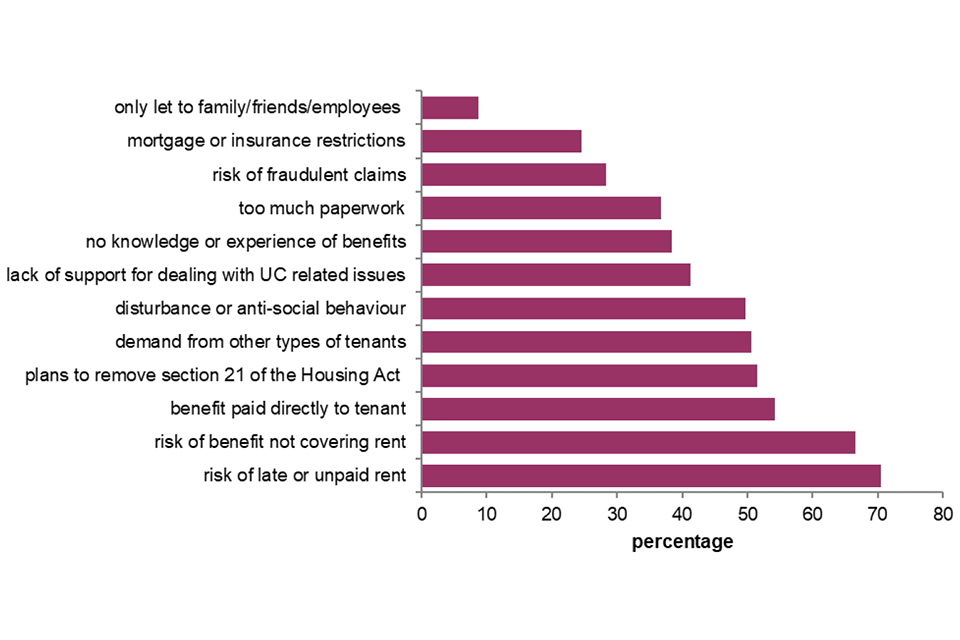
3.7 Landlords who were not willing to let to tenants on particular benefits[footnote 25] were asked to select the reasons they were not willing to do so.
3.8 The most frequently selected reason was a perceived greater risk of delays in payment or unpaid rent. This was selected by 69% of landlords. Two-thirds (66%) of landlords also reported a perceived risk that the benefits would not cover all the rent, Annex Table 3.4.
3.9 Over half of landlords (53%) reported being unwilling to let to people on benefits because these benefits are paid directly to the tenant and not to the landlord or agent. A similar proportion reported a perceived greater risk of disturbance or anti-social behaviour or damage to property or furnishings (49%) and a perceived greater risk due to plans to remove section 21 of the Housing Act (50%), Figure 3.2.
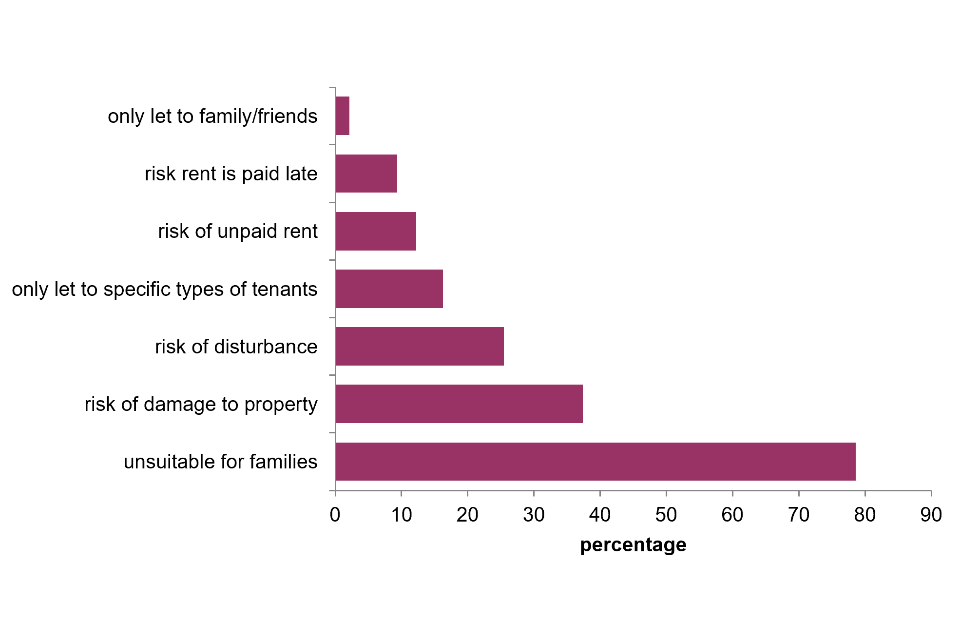
3.10 Landlords who were not willing to let to families[footnote 26] were asked to select the reasons they were not willing to do so. The majority (79%) of respondents said it was because they believed the accommodation was unsuitable for families. Another commonly selected reason was a perceived greater risk of damage to property or furnishings (37%), Figure 3.3.
Figure 3.2: Reasons for not letting to households on benefits
Base: all landlords not willing to let to tenants on HB, LHA or UC
Notes:
1) underlying data are presented in Annex Table 3.4
2) multi-code question. Responses add up to more than 100%
Source: English Private Landlord Survey 2021
Figure 3.3: Reasons for not letting to families with children
Base: all landlords not willing to let to couples/lone parents with children
Notes:
1) underlying data are presented in Annex Table 3.5
2) multi-code question. Responses add up to more than 100%
Source: English Private Landlord Survey 2021
Legal and good practice requirements - letting
3.11 Legal responsibilities that landlords should undertake when letting a property include, but are not limited to[footnote 27]:
-
protecting the tenant’s deposit in a government-approved scheme
-
providing an Energy Performance Certificate for the property
-
checking the tenant has the right to rent the property
-
providing the tenant with a copy of the ‘How to rent’ checklist
Landlords were asked which of these legal requirements they had undertaken, for their most recent letting.
3.12 This section focuses on the proportion of landlords that responded ‘yes’ to undertaking the legal requirements.
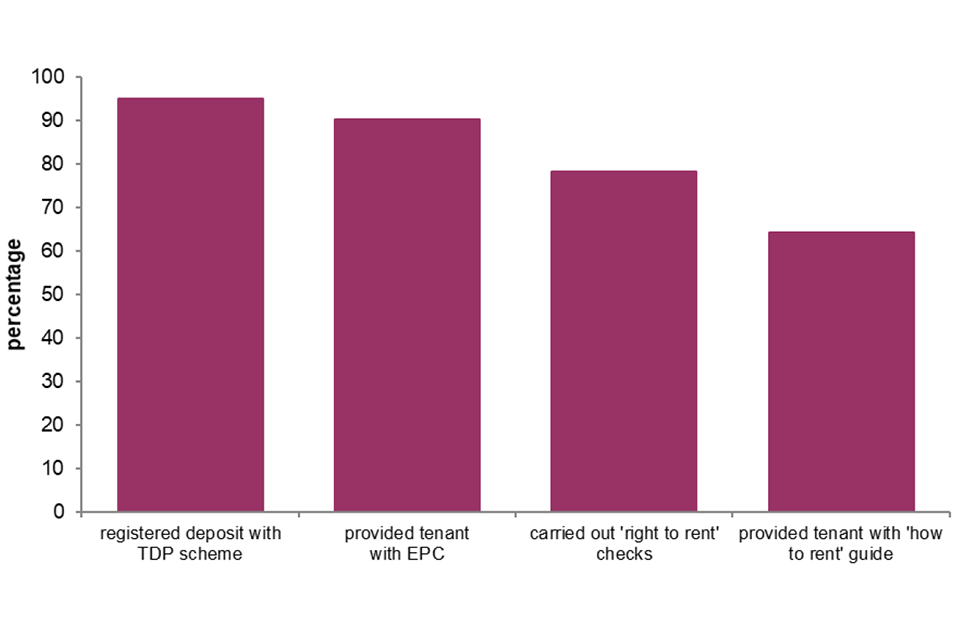
3.13 A tenancy deposit protection scheme (TDP) protects a deposit during the tenancy. For all assured shorthold tenancies in England that started after 6 April 2007, where a deposit is taken, landlords are required to register it in one of the three government-backed tenancy deposit schemes. Similar to the 2018 position, almost all landlords (95%) stated they had registered a deposit with a government backed tenancy deposit protection scheme for their most recent letting[footnote 28], Annex Table 3.7 and Figure 3.4.
3.14 An Energy Performance Certificate (EPC) gives a property an energy efficiency rating between A (most efficient) and G (least efficient) and is valid for 10 years. Since October 2008, there has been a legal duty on landlords to provide new and prospective tenants with a copy of the EPC of the property[footnote 29]. This provides the tenant with energy efficiency information on the property to help inform their decision on which property to rent. Overall, 90% of landlords provided prospective tenants with a copy of the EPC for the property, Annex Table 3.7 and Figure 3.4. This represents an increase since 2018 when 84% of landlords reported they had done so.
3.15 Since February 2016, all landlords letting a property in England are legally required to carry-out ‘Right to Rent’ checks of their prospective tenants to determine whether they have the legal right to rent a property in the UK. Right to Rent was introduced in the Immigration Act 2014 as part of the government’s wider reforms to the immigration system to make it fairer and more effective. Between 2018 and 2021, there has been an increase in the proportion of landlords that carried out a ‘Right to Rent’ check on their most recent letting, from 62% to 78%, Annex Table 3.7 and Figure 3.4. As it is not necessary to carry out Right to Rent checks on tenants where a tenancy agreement came into force before the February 2016 (December 2014 for certain pilot areas), this increase is expected given more time has elapsed since the law was introduced.
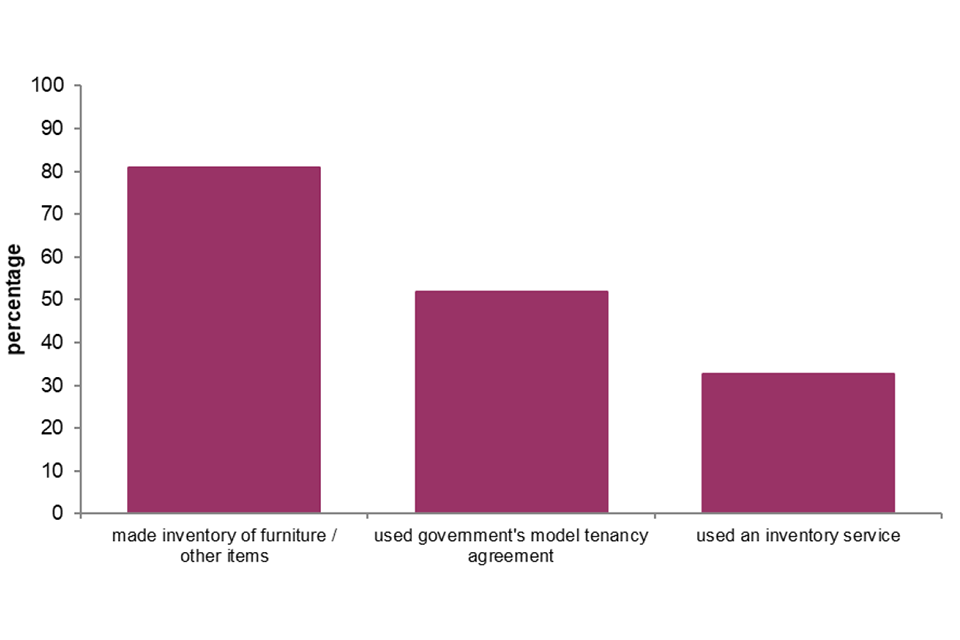
3.16 While landlords with one property were more likely to say they had registered the deposit for their last letting with a TDP scheme (97%) than landlords with multiple properties (92% to 93%), Annex Table 3.8, when the not applicable and don’t know categories were removed from the analysis, there was no marked difference in the results by landlord portfolio size.
3.17 Larger landlords were more likely to have provided tenants in their last letting with a copy of the EPC certificate, with 86% of those with one property providing the guide, compared with 91% of those with two or more properties and 94% of those with five or more properties, Annex Table 3.8.
3.18 Landlords with larger portfolios were more likely to have carried out a ‘Right to Rent’ check for their most recent letting compared with smaller landlords. Nearly three-quarters (72%) of landlords with one property said they carried out this check, compared with 80% who owned between two and four properties and 87% with five or more properties, Annex Table 3.8.
3.19 From October 2015 all landlords in England have been legally required to provide a new tenant with a copy of the government ‘How to Rent’ guide for tenants[footnote 30]. The guide is for people who are looking for a house or flat to rent in the private sector to help them understand their rights and responsibilities. Between 2018 and 2021, there has been an increase in the proportion of landlords that say they provided the tenant with a copy of the government’s ‘How to Rent’ guide, from 52% to 64%, Annex Table 3.7 and Figure 3.4, again, this is increase is expected given more time has elapsed since the legal requirement was introduced.
3.20 Larger landlords were more likely to have issued the guide, with 55% of landlords with one property saying they issued the guide, compared with 65% of those owning between two and four properties and 82% of those owning five or more properties, Annex Table 3.8.
Figure 3.4 Compliance with legal requirements - letting (most recent letting)
Base: all landlords
Notes:
1) underlying data are presented in Annex Table 3.7
2) single code variables presented together. Responses add up to more than 100%
Source: English Private Landlord Survey 2021
3.21 The EPLS also collected data on other activities that occur at the beginning of a tenancy. While these are not legal requirements, for their most recent letting landlords were asked whether they made an inventory of furniture or other items in the property, used an inventory service and whether they had used the government’s model tenancy agreement for assured shorthold tenancies.
3.22 Most landlords (81%) stated they made an inventory of furniture or other items which is recognised as good practice measure to prove the contents and condition of all fixtures and fittings within the rental property at the beginning of the tenancy and to avoid disputes relating to the deposit at the end of the tenancy, and 33% of landlords stated they used an inventory service to provide a professional and independent inventory for their most recent let, Annex Table 3.7 and Figure 3.5.
3.23 Over half of landlords (52%) said they used the government’s model tenancy agreement for assured shorthold tenancies, Annex Table 3.7 and Figure 3.5.
Figure 3.5 Good practice - letting (most recent letting)
Base: all landlords
Notes:
1) underlying data are presented in Annex Table 3.7
2) single code variables presented together. Responses add up to more than 100%
Source: English Private Landlord Survey 2021
Legal and good practice requirements – management and maintenance
3.24 When letting a property in England, landlords also have a number of legal requirements related to the management and maintenance of their rental property. A landlord renting out a property must:
-
keep rented properties safe and free from the most serious health hazards
-
make sure all gas and electrical installations or equipment are safely installed and maintained
-
fit and test smoke alarms and carbon monoxide alarms (where applicable)[footnote 31]
Where asked to do so by tenants, landlords also have a duty under the Equality Act 2010 (in place since 1 October 2010) to make reasonable adjustments for disabled people when undertaking a letting. Again for their most recently let property, landlords and agents were asked which of these requirements they had undertaken.
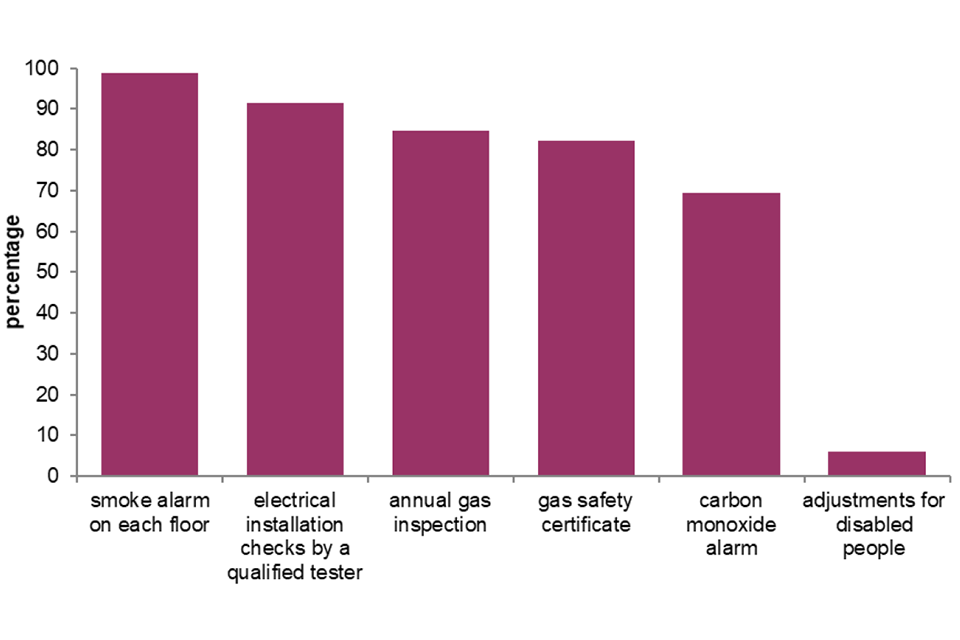
3.25 In this section, while it may appear that fewer landlords than expected report compliance with legal requirements, for some of the categories the legal requirements do not apply to all properties, e.g. the provision of a gas safety certificate to tenants is only applicable to properties where gas is installed.
3.26 Since October 2015, as part of the Smoke and Carbon Monoxide Alarm (England) Regulations 2015, private sector landlords in England are required to have at least one working smoke alarm installed on every storey of their properties and a carbon monoxide alarm must be installed in any room containing a solid fuel burning appliance (for example, a coal fire, wood burning stove). The landlord must make sure the alarms are in working order at the start of each new tenancy.
3.27 Almost all landlords (99%) stated they ensured a working smoke alarm was installed on each floor of the property and 69% stated they ensured a working carbon monoxide alarm was installed in rooms containing a solid fuel burning appliance, Annex Table 3.7 and Figure 3.6. Whilst the latter percentage is lower than for smoke alarms, we need to bear in mind that landlords were asked about the provision of these alarms irrespective of whether they were legally required.
3.28 As part of the Electrical Safety Standards in the Private Rented Sector (England) Regulations 2020, all private sector landlords in England must ensure the ‘fixed’ electrical installations in their rented properties (for example, wiring, plug sockets, light fittings) are inspected and tested by a qualified and competent person at an interval of at least every 5 years[footnote 32]. By 1st April 2021, these Regulations applied to all new and existing tenancies in England and were applicable to all private rented tenancies at the time of the survey fieldwork[footnote 33]. While the survey did not specify the 5 year time interval, 91% of landlords stated they had ensured electrical installation (e.g. wiring) checks were carried out by a qualified tester, Annex Table 3.7 and Figure 3.6.
3.29 For properties where gas is installed, as part of The Gas Safety (Installation and Use) Regulations 1998, landlords have since 1998 been legally required to carry out an annual gas inspection by a qualified inspector and to provide the gas safety certificate to the tenant. Overall, 85% of landlords responded they carried out an annual gas inspection and 82% of landlords provided a copy of the gas safety certificate to the tenant, Annex Table 3.7 and Figure 3.6.
3.30 Where asked to do so by tenants, landlords are required to make reasonable adjustments for disabled people when undertaking a letting. 6% of landlords responded that they made reasonable adjustments for disabled people when undertaking their most recent letting, Annex Table 3.7 and Figure 3.6.
3.31 Generally speaking, the findings for the compliance measures in Figure 3.6 are similar irrespective of landlord portfolio size, Annex Table 3.8. However, a relationship did exist between ensuring electrical installation checks were carried out by a qualified tester and the landlord portfolio size, with the prevalence increasing as the landlord portfolio size increases. Overall, 89% of landlords with one property reported the electrical installation checks were carried by a qualified tester, compared with 92% who owned between two and four properties and 96% with five or more properties, Annex Table 3.8.
Figure 3.6: Compliance with legal requirements – management and maintenance (most recent letting)
Base: all landlords
Notes:
1) underlying data are presented in Annex Table 3.7
2) single code variables presented together. Responses add up to more than 100%
Source: English Private Landlord Survey 2021
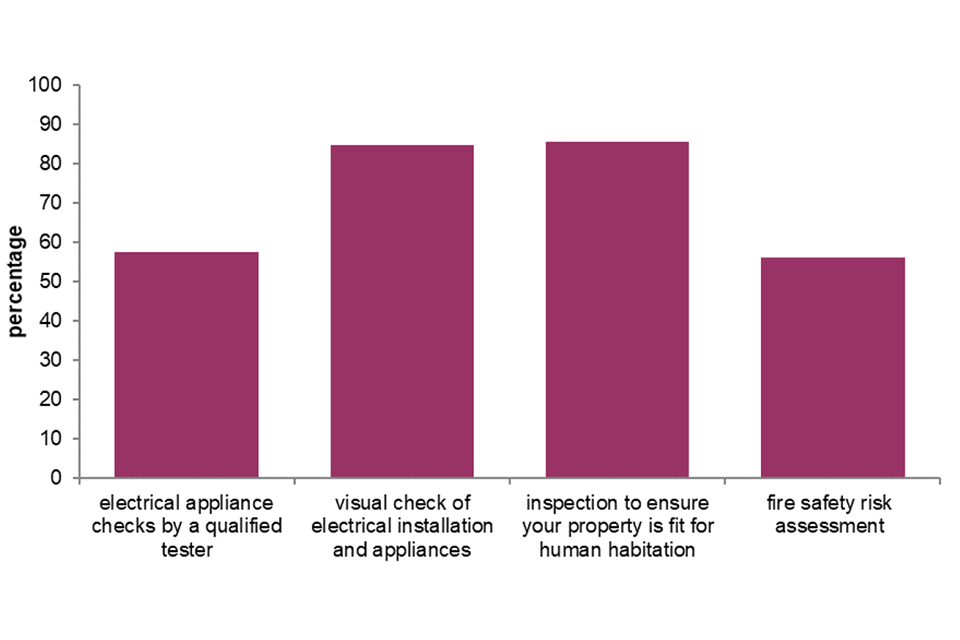
3.32 Two additional electrical safety questions associated with good practice activities were asked of landlords for their most recent let. These questions related to whether electrical appliance (e.g. fridge, toaster) safety checks were undertaken by a qualified tester and whether a visual check of the electrical installation and appliances was carried out. Over half of landlords (57%) stated they ensured electrical appliance checks were carried out by a qualified tester with 85% reporting they carried out a visual check of the electrical installation and appliances, Annex Table 3.7 and Figure 3.7.
3.33 Also, landlords were asked whether they had undertaken an inspection to ensure the property is fit for human habitation and whether a fire safety risk assessment had been carried out in their last letting[footnote 34]. Under The Homes (Fitness for Human Habitation) Act 2018 which came into force on the 20th March 2019 (and amends the Landlord and Tenant Act 1985) landlords must ensure that their property, including any common parts of the building, is fit for human habitation at the beginning of the tenancy and for the duration of the tenancy agreement[footnote 35]. Where a landlord fails to do so, the tenant has the right to take action in the courts for breach of contract on the grounds that the property is unfit for human habitation. Fitness for habitation means that the property is safe, healthy and free from things that could cause serious harm.
3.34 Over four-fifths (86%) of landlords said they carried out an inspection to ensure the property was fit for human habitation, and over half (56%) responded they carried out a fire safety risk assessment, Annex Table 3.7 and Figure 3.7.
3.35 Landlords with larger portfolios were more likely to have undertaken an inspection to ensure the property is fit for human habitation compared with smaller landlords. Overall, 82% of landlords with one property reported to have carried out an inspection to ensure the property is fit for human habitation, compared with 86% who owned between two and four properties and 92% with five or more properties, Annex Table 3.8.
Figure 3.7: Good practice – management & maintenance (most recent letting)
Base: all landlords
Notes:
1) underlying data are presented in Annex Table 3.7
2) single code variables presented together. Responses add up to more than 100%
Source: English Private Landlord Survey 2021
Licensing
3.36 When asked if they had applied for a license to operate as a landlord, 17% responded they had applied, 26% stated they had not and the remaining 57% stated a license was not required in the region their properties are, Annex Table 3.6.
Request for reasonable adjustment
3.37 Landlords were asked whether in the last two years a sitting or new tenant had requested the landlord to make reasonable adjustments to any of their properties. One in five landlords (20%) responded ‘yes’, Annex Table 3.9. and almost all landlords that had received a request for reasonable adjustments (98%) responded that they did carry out the request, Annex Table 3.10.
Legal requirements – energy efficiency
3.38 The Energy Efficiency (Private Rented Property) (England and Wales) Regulations 2015 phased in obligations for private sector landlords in relation to the energy performance of their properties, setting a minimum energy efficiency level for domestic private rented properties. The highest EPC energy efficiency rating is A and the lowest is G. Initially, from 1st April 2018 private sector landlords were unable to grant a new tenancy (or renewal tenancy), where the energy performance of the property is below a minimum ‘E’ rating on the EPC, unless a valid exemption for the property is in place. The Regulations widened and from 1 April 2020, there has been a legal requirement for all private rented properties to have a minimum ‘E’ rating on the EPC, unless a valid exemption for the property is in place. A private landlord planning to let a property or currently letting a property with an EPC of F or G, must improve the property’s rating to a minimum EPC of E immediately, or register an exemption (if applicable).
3.39 All landlords were asked to select the EPC bands of their rental properties. This survey question was asked of the landlord’s whole portfolio so they could select more than one category. In the survey questionnaire, there are three groups to the EPC band categories, bands E, F and/or G, band D and band C and above. Due to these groupings, it is not possible to identify the proportion of landlords with F or G rated properties that fall below the required minimum energy efficiency standard.
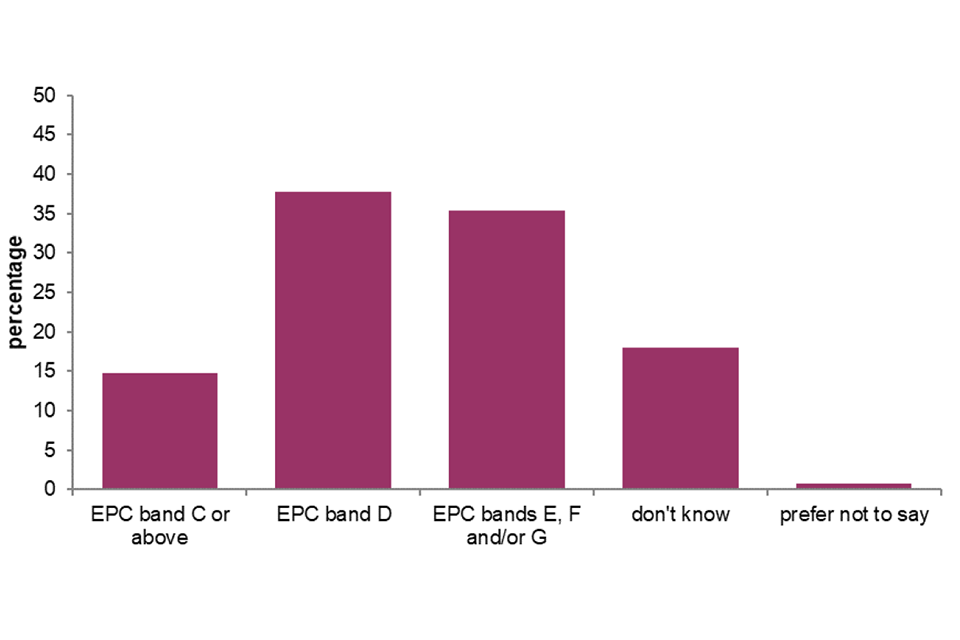
3.40 Since 2018, the proportion of landlords reporting having properties with an EPC rating of E, F and/or G has declined from 21% to 15% in 2021. More than a third of landlords reported having properties with an EPC rating of C or above (35%) or with an EPC rating of D (38%), while 18% reported not knowing the EPC rating of their property or properties and 1% preferred not to say, Annex Table 3.11 and Figure 3.8.
Figure 3.8: EPC rating of properties
Base: all landlords; weight: landlord weight
Notes:
1) underlying data are presented in Annex Table 3.11
2) multi-code question. Responses add up to more than 100%
Source: English Private Landlord Survey 2021
3.41 As the question referred to any property in their portfolio, it is not possible to calculate the proportion of tenancies this affects. However, according to the EHS 2020-21, 14% of the private rented sector stock has an EPC rating of E, F or G, with 4% having an EPC rating of F or G only[footnote 36].
Awareness of new legal requirement – energy efficiency
3.42 Landlords were asked if, before the survey, they were aware of the new legal requirement, as of April 2018, for all new lettings to have a minimum EPC rating of E and that in April 2020 this was extended to all tenancies. Nearly two-thirds (64%) of landlords reported being aware of the regulation with full understanding of the details, with a further 22% aware of the regulation but did not understand the details (Annex Table 3.12). The remaining 15% of landlords were not aware of the new energy efficiency legal requirement at all.
3.43 The 2018 survey also asked landlords about awareness of the minimum level of energy efficiency standard. The question wording in 2018 was very similar to the 2021 survey, albeit without the reference to the April 2020 extension. At the time of the 2018 survey some landlords would have taken part in the survey before the new legal requirements came into force[footnote 37] and in April 2018 the minimum energy efficiency requirement was only applicable for new lettings. At the time of the 2021 survey, the standard had extended to cover all landlords and their tenancies. Based on this, as expected between 2018 and 2021, landlord awareness and full understanding of the minimum energy efficiency standards improved from 42% to 64%.
Landlord awareness of tax and legislative changes
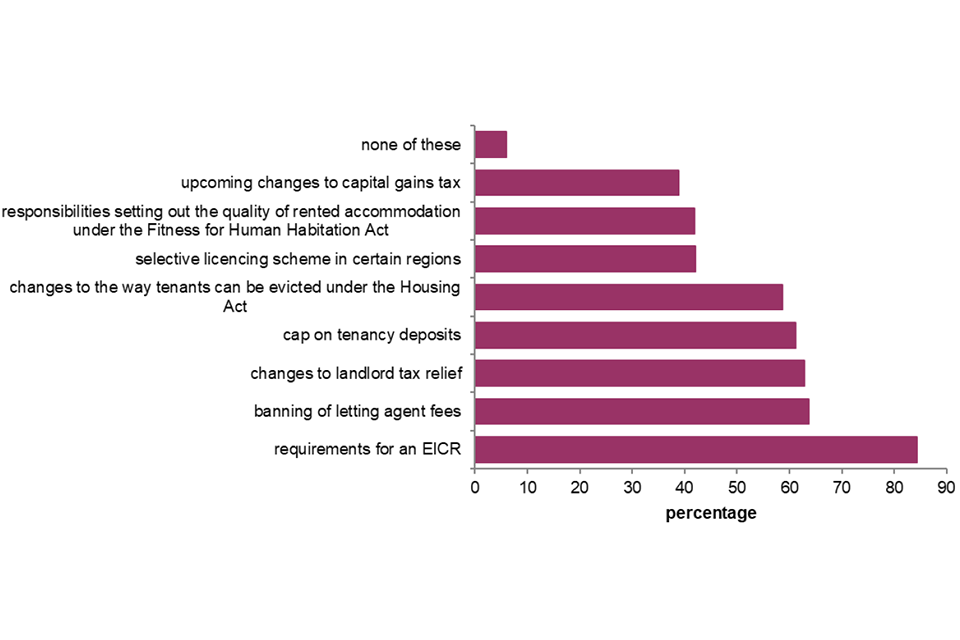
3.44 Landlords were asked which recent or planned legislative changes they were aware of. Respondents were most aware of the requirements for an Electrical Installation Condition Report (EICR; 84%).
3.45 Almost two-thirds of landlords were aware of the banning of agents charging certain fees to tenants (64%), changes to landlord tax relief (63%) and the cap on tenancy deposits (61%), Figure 3.9.
3.46 Overall, landlords with a Buy-to-Let mortgage were more aware of tax and legislative changes than landlords with other types of loan or no loans, Annex Table 3.13. Furthermore, landlords with larger portfolio sizes had greater awareness of each of the tax and legislative changes than those with small portfolios, Annex Table 3.14.
Figure 3.9: Awareness of tax and legislative changes
Base: all landlords; weight: landlord weight
Notes: underlying data are presented in Annex Table 3.13
Source: English Private Landlord Survey 2021
Chapter 4: The impact of COVID-19 on landlords
4.1 This chapter provides an overview of the impact of COVID-19 on landlords, their tenants and portfolios. It will give a view on the incidence and extent of arrears that landlords experienced within their portfolios and how they managed this.
Incidence and extent of arrears
4.2 On average, landlords reported having one tenant in arrears due to the COVID-19 pandemic (mean = 1.2, median = 1). Almost one-third (29%) reported having no tenants in arrears due to the pandemic.
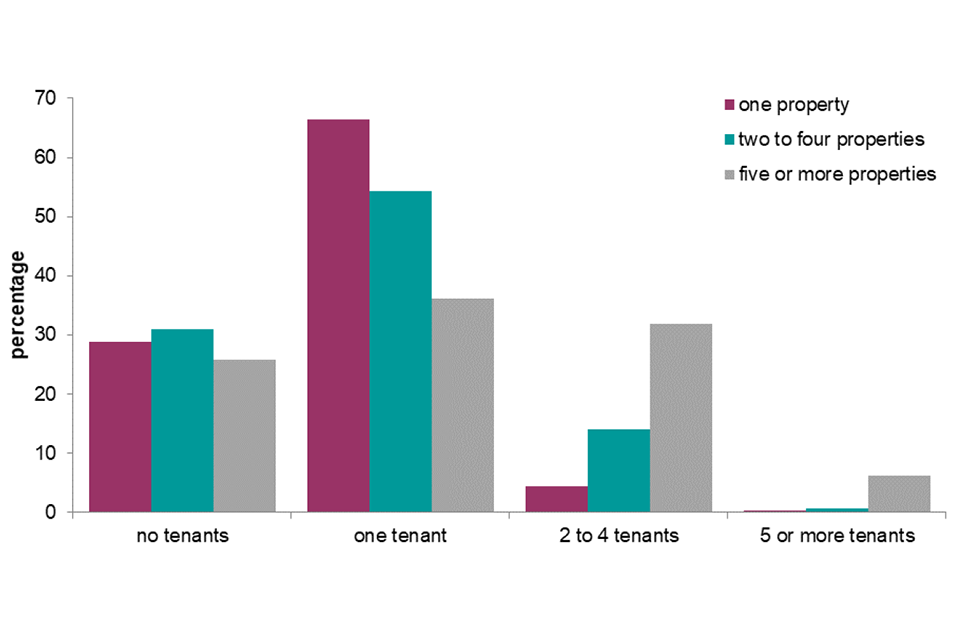
4.3 Over two-thirds (71%) of all landlords had at least one tenant in arrears due to COVID-19. The number of tenants in arrears for this reason varied across landlord portfolio size, Figure 4.1 and Annex table 4.1.
4.4 Landlords who let to tenants in receipt of Housing Benefit or Local Housing Allowance reported having more tenants in arrears (mean = 1.4) than landlords who did not (mean = 1). Although a greater proportion of landlords who let to tenants on Housing Benefit or Local Housing Allowance reported having no tenants in arrears (34%) than those who did not let to tenants on Housing Benefit or Local Housing Allowance (26%), they were more likely to report having two or more tenants in arrears (31%) than those who did not let to tenants on housing benefit (17%), who were more likely to report having one tenant in arrears due to COVID-19 (57%) than those who did let to tenants on housing benefit (36%), Annex Table 4.2.
Figure 4.1: Number of tenants in arrears due to the pandemic by landlord portfolio size
Base: all landlords
Notes: underlying data are presented in Annex Table 4.1
Source: English Private Landlord Survey 2021
4.5 Landlords were asked to provide the value of arrears accrued by the end of March, July, November 2020 and ‘currently’ (at the point of fieldwork, which was held December 2021 to January 2022). Overall, the value of arrears accrued increased from the end of March 2020 (mean £1,117) to December 2021 (mean £3,531). At the end of March, over half (55%) reported no arrears, this then dropped to 25% by the end of November and then increased slightly by December 2021 (30%).
New rent arrangements
4.6 Seven out of ten landlords (72%) reported that no tenants requested a new rent arrangement due to COVID-19. Almost one in five (18%) had agreed a new arrangement with one tenant or household, and a further 9% had agreed a new arrangement with more than one tenant or household. Only 1% stated a tenant had requested a new arrangement but they could not come to an agreement, Annex Table 4.5.
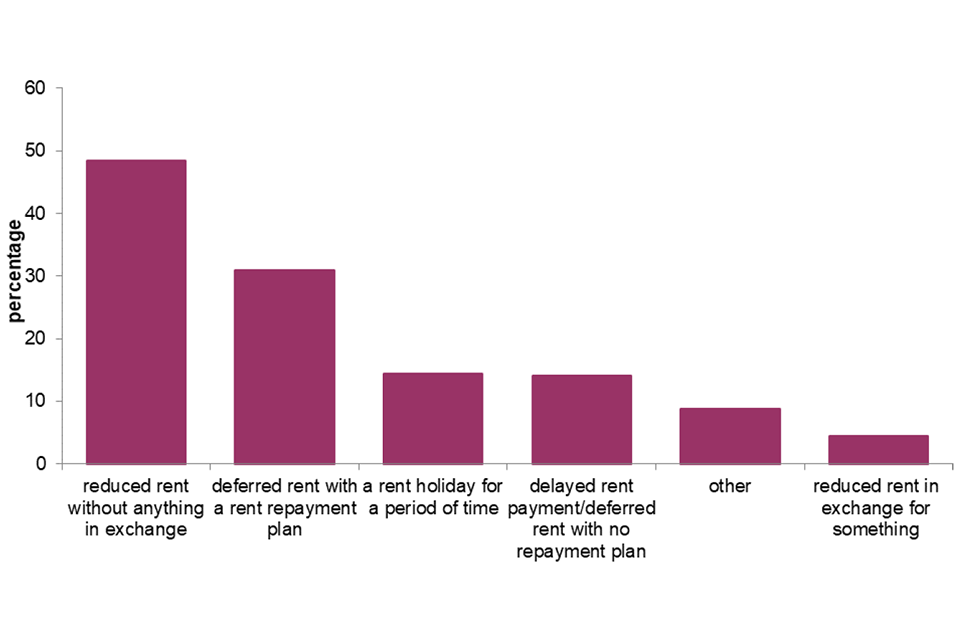
4.7 Of those who agreed a new arrangement, almost half reported this new arrangement consisted of a reduced rent without anything in exchange (49%) and approximately one-third (31%) reported it involved deferred rent with a rent repayment plan, Figure 4.2.
Figure 4.2 Nature of new rent arrangement
Base: all landlords who agreed a new rent arrangement; weight: landlord weight
Notes: underlying data are presented in Annex Table 4.6
Source: English Private Landlord Survey 2021
Mortgage holiday
4.8 Landlords were asked whether they had taken a mortgage holiday as a result of the pandemic. Almost one in ten (9%) stated they had, the remaining stated they had not, either because they did not require a mortgage holiday (61%) or would not take one (29%).
4.9 The likelihood of taking a mortgage holiday did not differ by portfolio size. However, there were differences in the reasons given for not agreeing a mortgage holiday. Landlords with five or more properties were more likely to say they would not take a mortgage holiday (35%) than those with one property, or two to four properties (26% and 27%, respectively). Yet, they were less likely to say they did not take a mortgage holiday because they did not require one (54%) than those with one property (65%) or two to four (63%), Annex Table 4.8.
4.10 The likelihood of agreeing a mortgage holiday did not largely differ by how landlords viewed their roles. However, landlords who viewed their role as a full-time business were more likely to report they had agreed a mortgage holiday (13%) than those who did not view their role as a full-time landlord. They were also more likely to state they did not agree a mortgage holiday because they would not take a mortgage holiday (41%) and less likely to report it was because they did not require one (44%), than those who did not view their role as a full-time business (28% and 63%, respectively), Annex Table 4.9.
4.11 Landlords were then asked their reasons for taking a mortgage holiday. The most common answer was that it was taken as a precaution (60%). A further 31% stated it was due to their tenant being in arrears, Figure 4.3.
Figure 4.3: Reasons for taking a mortgage holiday
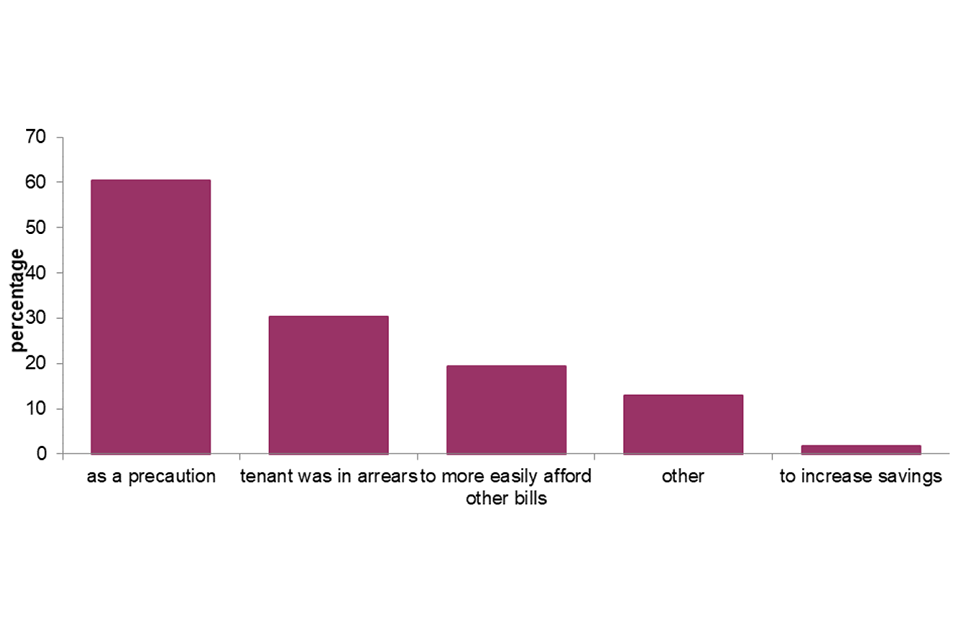
Base: all landlords; weight: landlord weight
Notes: underlying data are presented in Annex Table 4.10
Source: English Private Landlord Survey 2021
Chapter 5: The future of the private rented sector
5.1 This chapter presents findings on the future plans landlords have for their rental property portfolios and their concerns with respect to finances, legislation and tenant behaviours.
Landlords’ future plans
5.2 Landlords were asked whether the next time one of their rental properties became vacant, they would relet it. The majority of landlords (69%) said they would relet the property. One in ten (10%) reported that they would not relet the property, with a similar number saying it depended which of their properties became vacant (8%) or that they did not know (10%), Annex Table 5.1. Landlords with more than one property were more likely to report that they would relet the property than those with one property only.
5.3 More generally across their portfolio, landlords were asked what, if any, investment plans they had for their rental properties over the coming two years[footnote 38]. Almost half of landlords (48%) said they plan to keep the number of their rental properties the same, representing 42% of tenancies. A further 20% of landlords said they had not made any plans for their rental properties, representing 14% of landlord tenancies. A similar number of landlords planned to increase their number of properties (11%, representing 15% of tenancies), as planned to decrease their number of properties (12%, representing 21% of tenancies) or were planning to sell all of their rental properties (10% of landlords, representing 8% of tenancies), Figure 5.1.
5.4 Landlords who rent out property as part of a company were more likely to state they had plans to increase their number of rental properties in the next two years (35%; representing 36% of landlord tenancies) than those who rent out as an individual or group of individuals (9%; representing 11% of landlord tenancies). Landlords who rent out as an individual or group of individuals were more likely to state they planned to keep the number of properties they let out the same (49%; representing 44% of tenancies) than those who rent out as part of a company (33%; representing 31% of tenancies), Annex Tables 5.2 and 5.3.
5.5 Landlords’ future plans also differed depending on their portfolio size. Overall, landlords with five or more properties were less likely to plan to keep the same number of rental properties they let out (36%) than those with one property (51%) or two to four properties (50%). Three in ten (29%) landlords with five or more properties reported plans to decrease the number of rental properties they own, and 19% reported plans to increase the number of rental properties they own, which were higher proportions than those with one property (2% and 6%, respectively) or two to four properties (16% and 12%, respectively), Annex Table 5.4.
5.6 Landlords with buy-to-let mortgages were more likely to report planning to increase (14%) or decrease (16%) the number properties in their portfolio compared to landlords with other types of loan (9% and 8%) and those with no loans or borrowing (6% and 9%, respectively). They were also less likely to report having not made plans (16%) than landlords with another kind of loan (23%) or no loan (24%), Annex Table 5.5.
5.7 In 2018, a greater proportion of landlords said the next time one of their rental properties became vacant they would relet it (75%). More landlords also expected their portfolio to be unchanged (53%, representing 47% of tenancies) over the next two years. Only 5% of landlords (representing 5% of tenancies) reported plans to sell all their rental properties in the same period.
Figure 5.1: Plans to make changes to portfolio sizes over the next two years
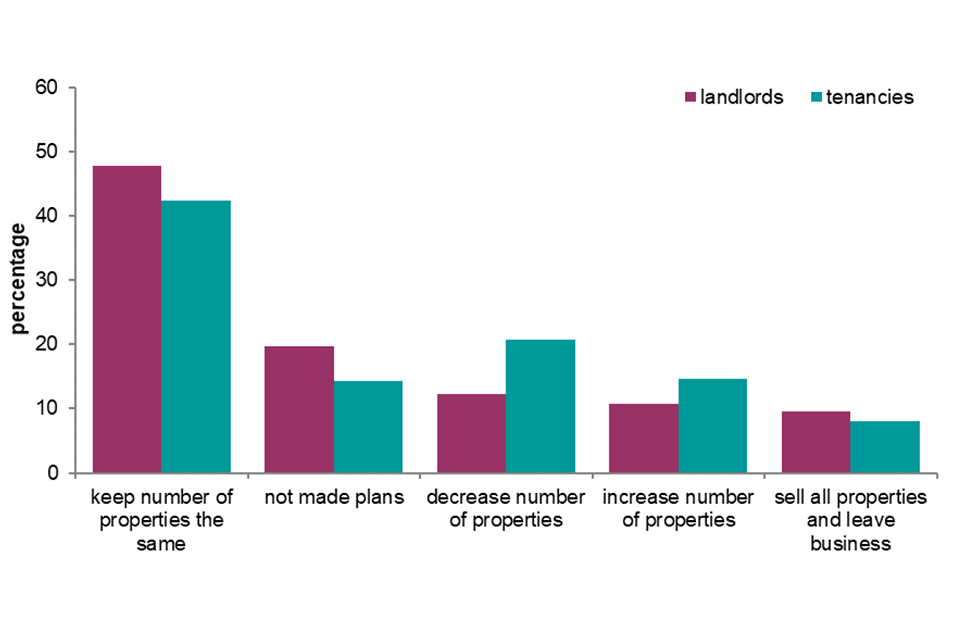
Base: all landlords; weight: landlord weight and tenancy weight
Notes: underlying data are presented in Annex Table 5.2 and 5.3
Source: English Private Landlord Survey 2021
5.8 Landlords who planned to decrease or sell all their rental property were asked to select reasons why they were planning to do so. From the options given, recent legislative changes (e.g. to benefits, tax relief and stamp duty)[footnote 39] were the most commonly selected (55%), followed by forthcoming legislative changes (e.g. the changes to section 21 evictions), which was selected by 53%. Four in ten (42%) also reported intending to sell or decrease their portfolio for personal reasons (e.g. approaching retirement age, other commitment etc.) [footnote 40], Figure 5.2.
Figure 5.1: Plans to make changes to portfolio sizes over the next two years
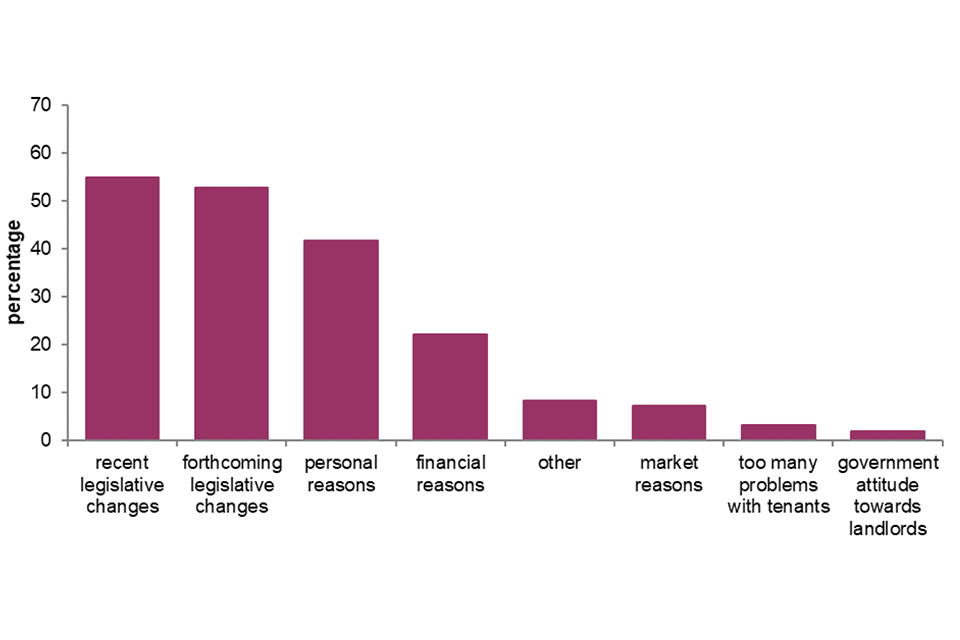
Base: all landlords who plan to decrease or sell all rental property, weight: landlord weight
Notes:
1) underlying data are presented in Annex Table 5.6
2) multi-code question. Responses add up to more than 100%
Source: English Private Landlord Survey 2021
5.9 Landlords with one property only were more likely to report planning to decrease or sell their rental property due to financial reasons (27%) than those with two to four or five or more properties (22% and 18%, respectively). Conversely, landlords with five or more properties were more likely to report planning to decrease or sell their rental property due to recent (69%) or forthcoming (68%) legislative changes than those with two to four properties (55% and 53%, respectively), or one property (42% and 39%, respectively), Annex Table 5.6.
5.10 Landlords who planned to increase or keep the number of their rental properties the same were also asked the reasons for doing so. From the options given, the most common reasons selected were financial (57%) and personal (36%) reasons, Figure 5.3. In 2018, just one-third (34%) of landlords stated they planned to increase or keep the number of their rental properties the same due to financial reasons.
5.11 Landlords with larger portfolio sizes were more likely to select market reasons (e.g. strong demand in area, house prices) and recent or forthcoming legislative changes for increasing or keeping the same portfolio size than those with smaller portfolios, Annex Table 5.7.
Figure 5.3: Reasons for planning to increase or keep portfolio size the same
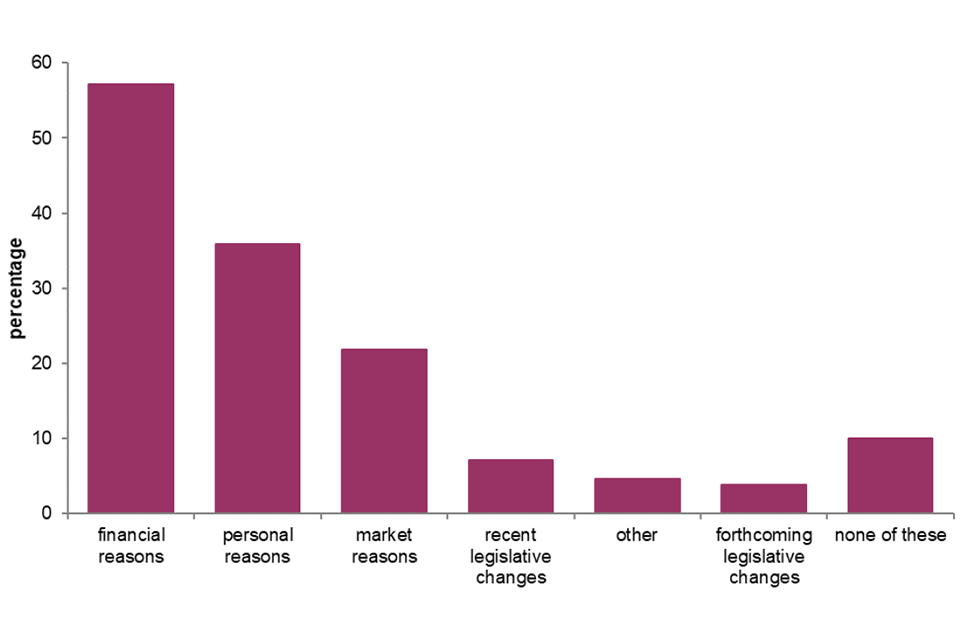
Base: all landlords who plan to increase or keep the same number of rental properties; weight: landlord weight
Notes:
1) underlying data are presented in Annex Table 5.7
2) multi-code question. Responses add up to more than 100%
Source: English Private Landlord Survey 2021
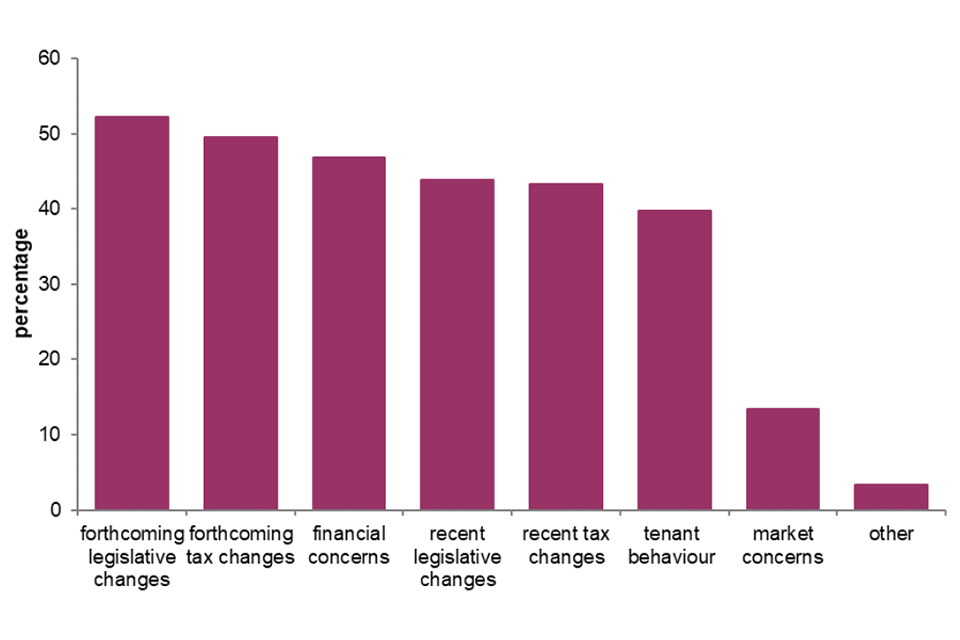
Landlord concerns
5.12 Respondents were asked to select from a range of options, which caused them most concern as a landlord. The most commonly reported concerns were about forthcoming legislative changes and forthcoming tax changes, with half of respondents indicating concern (52% and 50%, respectively), Figure 5.4.
5.13 Landlords with a larger portfolio size were less likely to have financial and market concerns, but more likely to state concerns over both recent and forthcoming tax and legislative changes, than landlords with smaller portfolio sizes, Annex Table 5.8.
5.14 In the 2018 survey, from a shorter list of concerns, landlords were most concerned about legislative changes (62%), followed by tenant behaviour (51%).
Figure 5.4: Landlord concerns
Base: all landlords
Notes:
1) underlying data are presented in Annex Table 5.8
2) multi-code question. Responses add up to more than 100%
Source: English Private Landlord Survey 2021
Technical notes
Methodology and approach
1. The EPLS is an online survey of over 9,000 landlords and letting agents registered with one of the three government-backed Tenancy Deposit Protection (TDP) schemes. Since 6 April 2007 in England when a deposit is provided by a tenant to a landlord for an assured shorthold tenancy, all landlords (or their agents) are legally required to register that deposit with a TDP scheme.
2. The TDP scheme administrative data used for the EPLS were downloaded in January 2021[footnote 41]. At this time, the TDP scheme data indicated that there were just over 4.1 million live deposits registered with a TDP scheme in England, corresponding to an estimated 439,000 registrants (landlords and agents – each agent representing multiple landlords on whose behalf they have registered a deposit. A randomly selected sample of these landlords and agents were invited to take part in the EPLS. Landlords and agents with larger portfolios were over-sampled to provide sufficient numbers for analysis.
3. We do not know the precise proportion of the private rented sector that is covered by the TDP schemes. From the English Housing Survey (EHS) in 2018-19 it is estimated that between 62% and 76% of households in the private rented sector are covered by a TDP scheme[footnote 43].
4. There are various reasons why the remainder of the sector would not be registered with a TDP scheme. For example, the landlord may not have taken a deposit, or the tenancy agreement may have been in place before the TDP schemes became mandatory in 2007. While some landlords will be operating outside of the law, it is not possible to say how many.
5. The proportion of the private rented sector that is registered with a TDP scheme has increased steadily since 2007. The proportion is expected to continue to increase as more tenancies fall within the requirement and as there is increasing awareness of the need to register[footnote 44].
6. Although across most of the household characteristics the profiles of households with a TDP scheme registered deposit and all private renters were very similar[footnote 45], renters from TDP scheme landlords are more likely to be employed and have higher incomes than those not registered with a TDP scheme[footnote 46]. This should be recognised when considering the findings and their implications.
7. The project used administrative data provided by the three TDP schemes to create a combined registrant (landlord and agent) level dataset and then a (separate) combined deposit level dataset. The registrant dataset comprised around 439,000 records (each one representing a landlord or agent) and included details of the landlords and agents who had a live deposit registered with a TDP scheme at the time of the download (31 January, 2021). The deposit level dataset comprised around 4.1 million records (each one representing a live deposit)[footnote 47] and included details about the deposits themselves, including the location of the properties. The registrant dataset was used as a sample frame for the survey whilst both datasets were used to create weights to make the survey findings as representative as possible.
Weighting
8. The survey data was weighted to make the data representative of two different populations. The weights used are:
i. Tenancy weight – this makes the data representative of live deposits/tenancies that are registered with a TDP scheme;
ii. Landlord weight – this makes the data representative of landlords who have registered live deposits with a TDP scheme.
9. The two populations that the weights represent (deposits/tenancies, and landlords) are quite distinct. Each one gives a different weight (in aggregate) to different groups in the sample, reflecting the makeup of the respective populations. The weight used for analysis will therefore affect the results. For example, based on landlord responses, 45% of landlords own one rental property but these account for only 21% of tenancies. This illustrates that the tenancy weight gives landlords with small portfolios (in this case only one rental property) less influence than the landlord weight will do.
10. When findings are reported using the tenancy weight, these are described as representing x% of tenancies. More precisely, they represent the proportion of live deposits in England registered with TDP schemes. A deposit may not always equate to a tenancy. In some cases, multiple deposits may be registered for a single tenancy (for example, multiple tenants or households living in the same shared property). However, for ease, the word ‘tenancy’ is used to describe registered deposits throughout the report.
11. Similarly, when findings are reported using the landlord weight, they are described as representing x% of landlords. More precisely, they represent the proportion of landlords with registered live deposits.
12. For ease of reference, the weight used is noted under each chart.
Reporting
13. The base under each chart denotes the set of respondents on which the findings are based; this is often (but not always) the same as the set of respondents to whom the question was addressed (e.g. all landlords, individual landlords, only landlords with multiple properties etc.).
14. Some questions relate to all of the respondents’ properties or lettings, whilst others relate only to the most recent letting or property. Where findings relate only to the most recently let property, this is noted.
15. Several survey questions were multi-coded (i.e. respondents were able to select more than one response), which means that the number of responses may add up to more than 100%. Where this is the case it is noted under the charts.
16. All reported comparisons were tested at the 5% significance level, taking into account the effect of the weights. Confidence intervals around survey estimates were also produced. Although an estimate produced from a sample survey will rarely be identical to the population value, confidence intervals indicate the likely range within which the population value will fall and provide an indication of the precision of the survey results.
17. Additional annex tables, including the data underlying the figures and charts in this report are published[footnote 48].
-
The survey involved agents who let and / or manage property on behalf of landlords. For brevity, the term “agent” is used throughout the report to describe agents who let and / or manage properties. ↩
-
Such as the removal of their ability to deduct mortgage interest payments from taxable income (phased in from April 2017) and the removal of the wear and tear allowance on furnished properties (from April 2016). ↩
-
For a detailed overview of the private rented sector, see Rugg and Rhodes (2018) The Evolving Private Rented Sector: Its Contribution and Potential. ↩
-
Since April 2007, all landlords and agents that take a deposit for an assured shorthold tenancy have been required to register that deposit with a TDP scheme. ↩
-
For more information on the methodology, including the TDP scheme administrative data and the EHS estimate of the proportion of private rented sector households covered by the TDP schemes see the technical note at the end of this report or the accompanying technical report. ↩
-
The coverage of TDP schemes across private rented sector households was calculated from 2018- 19 EHS data as the proportion of all private renters who reported having a deposit registered with a TDP scheme, out of the total number of private renters (regardless of whether they had a deposit registered). It includes tenants with all types of tenancies, including assured shorthold tenancies. It is expressed as a range, with the lower bound being tenants who were certain their deposit was registered in a TDP scheme and the upper bound including those who did not know. ↩
-
For more information on the types of eviction notice please see Evicting tenants: Section 21 and Section 8 notices. ↩
-
‘Other’ includes any other organisation or entity not described as either an ‘individual or group of individuals’ or ‘as part of a company’. ↩
-
Landlords were asked which, if any, types of loans or borrowing they currently have to help fund their rental property. Over half (55%) were Buy-To-Let landlords with an existing mortgage, representing 61% of landlord tenancies. See Figure 1.12. ↩
-
Census 2011: Population of England and Wales. Note that this comparison has not been tested for statistical significance. ↩
-
These questions were asked of landlords who registered deposits themselves- figures for landlords whose agents registered deposits are not included in this analysis. ↩
-
There is a disparity in the number of landlords reporting they are self-employed as a landlord (13%) at the employment question, compared to those reporting that they are a full-time landlord (5%) at the question about their role as a landlord (paragraph 1.17) as these questions are different, with the one reported on here a multi-code question, which enables respondents to provide more than one answer (i.e. they could be a self-employed landlord and be working part-time). ↩
-
Landlords were asked about ‘your total gross income (i.e. before tax and deductions) excluding income from rental property(ies)’. This will not necessarily equate to a household income. The mean income excluding rental income was £55,415. ↩
-
The proportions do not add to 100% due to rounding. Note that this analysis excludes some outlying figures. ↩
-
Landlords were asked about ‘your total gross rental income from your rental property(ies)? (i.e. before tax and deductions, mortgage, letting and other operating costs)’. ↩
-
The average (median) value per rental property for all landlords was £220,000. ↩
-
Respondents were asked ‘which of the following types of loans or borrowing do you currently have to help fund your rental property(ies)’: Buy-to-let mortgage, commercial loan and loan from family or friends. ↩
-
For 12% of respondents, this was the first letting of their property. ↩
-
6% of respondents had not previously renewed or extended a tenancy. ↩
-
In 2018-19, 23% of private renters reported that they did not pay a deposit for their tenancy English Housing Survey, Headline Report 2018-19. ↩
-
Housing Benefit, the Local Housing Allowance, or Universal Credit. ↩
-
Couples/lone parents with dependent children. ↩
-
There are also legal requirements related to the management and maintenance of the property let which are covered in the section ‘Legal and good practice requirements – management and maintenance’. ↩
-
All landlords participating in the survey are currently registered with a TDP. For their most recent letting 4% of landlords selected ‘not applicable’, 1% selected ‘don’t know’ and 1% selected ‘no’. ↩
-
Further EPC legislation for landlords of domestic private rented properties on the minimum level of energy efficiency standard is considered in the section ‘Legal requirements – energy efficiency’. ↩
-
Landlords must also follow fire safety regulations for a property in a purpose-built block of flats or for houses and property adapted into flats. ↩
-
Landlords of HMOs were subject to this mandatory legislation even before these Regulations came into force. ↩
-
The EPLS fieldwork was conducted between December 2021 and January 2022. ↩
-
HMO properties with shared communal areas must carry out a fire risk assessment in the communal areas of the property under the Regulatory Reform (Fire Safety) Order 2005. ↩
-
The Act outlines when the landlord’s obligations and liabilities do not arise, for example, the unfitness was caused by the tenant’s behaviour. ↩
-
English Housing Survey 2020 to 2021: headline report, Annex Table 2.8. ↩
-
EPLS 2018 fieldwork was conducted between March and April 2018. ↩
-
The survey was carried out in December 2021. ↩
-
The response option was ‘Legislative changes, e.g. to benefits, tax relief and stamp duty.’ ↩
-
The response option was ‘Personal reasons, e.g. approaching retirement age, other commitment etc.’ ↩
-
TDP scheme data is administrative data generated for the purpose of administering the schemes. As such the limitations and constraints of these datasets and statistics generated from them should be recognised. See technical report for further details. ↩
-
The coverage of TDP schemes across the private rented sector was calculated as the proportion of private renters who reported having a deposit registered with a TDP scheme, out of the total number of private renters (regardless of whether they had a deposit registered). It includes tenants with all types of tenancies, including assured shorthold tenancies. It is expressed as a range, with the lower bound being tenants who were certain their deposit was registered in a TDP scheme and the upper bound including those who did not know. ↩
-
The UK Tenancy Deposit Statistics (October 2016) show that the number of deposits protected in England and Wales by one of the three TDP schemes increased steadily year on year from March 2008 to March 2016 from 924,181 to 3,425,718 deposits, or an increase of around 270% over 8 years. ↩
-
Such as the type of household housed. ↩
-
This analysis is provided in the technical report. ↩
-
Headline findings from the analysis of these datasets are provided in the accompanying EPLS technical report. ↩