English Housing Survey 2021 to 2022: headline report
Published 15 December 2022
Applies to England

© Crown copyright 2022
This publication is licensed under the terms of the Open Government Licence v3.0 except where otherwise stated. To view this licence, visit nationalarchives.gov.uk/doc/open-government-licence/version/3 or write to the Information Policy Team, The National Archives, Kew, London TW9 4DU, or email: psi@nationalarchives.gov.uk.
Where we have identified any third party copyright information you will need to obtain permission from the copyright holders concerned.
This publication is available at https://www.gov.uk/government/statistics/english-housing-survey-2021-to-2022-headline-report/english-housing-survey-2021-to-2022-headline-report
Introduction and main findings
1. The English Housing Survey (EHS) is a national survey of people’s housing circumstances and the condition and energy efficiency of housing in England. It is one of the longest standing government surveys and was first run in 1967. This report provides the findings from the 2021-22 survey.
Impact of COVID-19 on the English Housing Survey
2. Much like the previous year, the 2021-22 English Housing Survey data was collected during the COVID-19 pandemic. Given the restrictions on social distancing, and being conscious of the safety of both our interviewers and respondents, these circumstances necessitated a change in the established survey mode. Face-to-face interviews were replaced with telephone interviews and internal inspections of properties were instead replaced with external inspections, where the inspection was restricted to an assessment of the exterior of the dwelling and supplemented by information about the interior of the dwelling that the surveyor collected (socially distanced) at the doorstep.
3. Ordinarily, such changes would not be made without thorough testing to examine the impact on survey response rates, data collection and reporting. Unfortunately, this testing was not possible during 2020-21, given the pace at which it was necessary to make changes so as not to miss a year of data collection. When analysing the 2020-21 data, we found these changes resulted in our sample having significantly more outright owners and fewer renters than in 2019-20. There was also a skew toward older respondents (aged 65 or over), and fewer households with children than in 2019-20. However, the English Housing Survey was not the only long-standing survey to be impacted by the pandemic in this way. The Office for National Statistics compared several of their prominent survey data collections and found similar changes in the distribution of household characteristics – more owner occupiers, fewer respondents from areas of deprivation, as well as an increase in older respondents, and those belonging to white ethnic groups.
4. In 2021-22, while the overall mode of data collection did not change from the year previous, we were able to modify our practices to try and counteract some of the concerns we had in 2020-21. In particular, we were able to increase the number of people who we invited to take part in the survey, as well as incorporate a ‘knock to nudge’ approach when contacting potential respondents. The ‘knock to nudge’ approach involved visiting a respondent at their home and, while socially distanced, encouraging them to respond to the survey by telephone. This approach has been shown to balance the tenure profile of household telephone surveys. We consider these measures both helped increase our achieved sample size and appeared to balance out the profile of our respondent households, when compared to 2020-21.
5. While larger than in 2020-21, the circumstances surrounding the COVID-19 pandemic still resulted in a smaller sample size than pre-pandemic, with 9,752 interviews in 2021-22 (down from around 13,300 in a usual year) and 5,284 physical surveys (down from 6,200 physical surveys) in 2021-22. As the reliability of the results of sample surveys, including the English Housing Survey, is positively related to the unweighted sample size, the smaller sample in 2021-22 may contribute to some of the differences observed this year. This has likely also resulted in an increase in the number of occasions where apparent differences between two figures are not statistically significant.
6. There were also some data we were unable to collect at all, in which case predictive modelled estimates at dwelling level were produced to supplement the ‘external plus’ inspection and indicate whether or not a dwelling: had damp problems; had any Category 1 hazards assessed through the Housing Health and Safety Rating System (HHSRS); or met the Decent Homes Standard. In these instances, we have been able to model data to provide headline figures for this report. We indicate where this has been done at the beginning of each topic area. More information on the impact of COVID-19 on the English Housing Survey and the modelling methodology can be found in Annex 5.5 of the Technical Report. It is important to note that, the English Housing Survey physical data is designed such that we aggregate two years of data for analysis. Last year’s report (2020-21) included dwelling data from both the 2019-20 and 2020-21 data collection years – and so still included some pre-covid full physical inspections in the analysis. This report includes data from the 2020-21 and 2021-22 data collection years, and so only includes observations from our modified ‘external plus’ inspections and modelled variables.
7. For 2021-22, we also observed that, in some instances, respondents were somewhat less likely to give interviewers personal details over the phone. This was more so the case for certain financial variables, such as income or mortgage amounts. The English Housing Survey deals with missing data through imputation, which was carried out according to usual methods and assumptions in 2021-22. It is worth noting, however, that a slightly higher than usual number of observations required imputation this year. Where this is the case and where we have seen somewhat unexpected changes to these figures, we have flagged this in the report.
8. We are encouraged to see that there are fewer differences observed in 2021-22 compared to pre-pandemic data. However, for what few changes we have seen, it is not clear to what extent these are the result of the change in mode, or real change (e.g. a change in people’s housing circumstances as a result of COVID-19). For this reason, the report highlights changes which may be larger and/or unexpected and caution is advised when interpreting some of the changes observed against findings from pre pandemic surveys.
This report
9. This report is split into two sections. The first, on households, covers tenure (owner occupation and the social and private rented sectors) and the demographic and economic characteristics of the people who live in the three tenures. It then explores how affordability varies between tenures and how this has changed over time; buying expectations among renters; average mortgage and rental costs; the extent to which private and social renters claim housing support to help meet the cost of their rent; and rates of mortgage and rent arrears. Rates of overcrowding and under-occupation by tenure are then examined, followed by analysis of well-being and loneliness and the extent to which this varies by tenure.
10. The second section, on homes, provides an overview of the housing stock in England including: the age, size, and type of home; energy efficiency of the housing stock; decent homes; homes affected by damp and mould; and smoke alarms. Additional annex tables provide further detail to that covered in the main body of the report.
11. This is the first release of data from the 2021-22 survey. The report will be followed up with a series of more detailed topic reports in 2023.
Main findings
Owner occupation remains the largest housing tenure in England, and has seen a small increase compared to 2016-17.
- There are 15.6 million owner occupied households, representing 64% of all households in 2021-22. This proportion is unchanged from 2020-21, and has been similar over the last decade, but has seen an increase from 63% in 2016-17.
- Since 2013-14 there have been more outright owners than mortgagors. In 2021-22, 35% of households were outright owners while a further 30% were mortgagors.
After nearly doubling in size since the early 2000’s, the private rented sector has accounted for about one fifth of households in England since 2013-14.
- The private rented sector makes up 4.6 million or 19% of households. There is no change in the proportion of private rented households from the year previous (2020-21), but there is a small, though significant decrease compared to the high point in 2016-17 (20%).
The social rented sector accounts for 17% of households in England. Over the last decade, social housing provision has increasingly been supplied by Housing Associations.
- At 4.0 million households (17%), the social rented sector is the smallest tenure, following a longer-term downward trend that stabilised over the last decade.
- In 2021-22, more households (10% or 2.5 million) rented from housing associations, and fewer (6% or 1.6 million) from local authorities. This was not the case a decade ago, when 9% (2.0 million) rented from housing associations and 8% (1.8 million) rented from local authorities.
Across all tenures, and across nearly all individual measures, average personal well-being increased in 2021-22, when compared to 2020-21.
- Average life satisfaction scores increased from 7.3 to 7.5, the average score for thinking ‘life is worthwhile’ increased from 7.6 to 7.8, and average happiness scores increased from 7.2 to 7.5. Anxiety levels (3.0) remained similar to 2020-21 (3.1).
- Owner occupiers generally had higher scores for life satisfaction (7.8), thinking life is worthwhile (8.0), and happiness (7.7), and lower scores for anxiety (2.7), than the private rented sector (7.2; 7.6; 7.3; 3.3). Conversely, private renters report higher well-being scores than social renters (7.0; 7.4; 7.0; 3.6).
Modelled data of occupied dwellings finds that the private rented sector remains the tenure with the highest proportion of non-decent dwellings, with nearly a quarter of dwellings failing to meet the Decent Homes Standard.
- In 2021, 14% or 3.4 million occupied dwellings, failed to meet the Decent Homes Standard
- The private rented sector had the highest proportion of non-decent homes (23%) while the social rented sector had the lowest (10%). Among owner occupied homes, 13% failed to meet the Decent Homes Standard.
Modelled data of occupied dwellings finds that a relatively small proportion of the overall housing stock has problems with damp, but this is more prevalent in some tenures than others.
- In 2021, modelled data shows that 4% of the occupied dwelling stock had problems with damp.
- Problems with damp were most prevalent in the private rented sector, with 11% of dwellings having reported a problem in 2021. A small proportion of owner occupied dwellings (2%) and occupied social rented dwellings (4%) had problems with damp.
The energy efficiency of the English housing stock continues to improve, with significant increases in mean SAP (Standard Assessment Procedure) ratings seen over the past 25 years. Mean scores varied across tenures, with the social rented sector having the highest average SAP rating.
- In 2021, the average SAP rating of an English dwelling was 66 points, up from 45 points in 1996.
- In 2021, the social sector had the highest mean SAP rating with mean scores of both housing associations and local authorities at 70. Owner occupied dwellings averaged a rating of 66 and private rented dwellings scored the lowest at 65.
Acknowledgements and further queries
12. Each year the English Housing Survey relies on the contributions of a large number of people and organisations. The Department for Levelling Up, Housing and Communities (DLUHC) would particularly like to thank the following people and organisations without whom the 2021-22 survey and this report would not have been possible: all the households who gave up their time to take part in the survey, NatCen Social Research, the Building Research Establishment (BRE) and CADS Housing Surveys.
13. This report was produced by the Housing Research and Evaluation Team at DLUHC. If you have any queries about it, would like any further information or have suggestions for analyses you would like to see included in future EHS reports, please contact ehs@levellingup.gov.uk.
14. The responsible analyst for this report is: Chauncey Glass, Housing and Planning Analysis Division, DLUHC. Contact via ehs@levellingup.gov.uk.
Section 1: Households
1.1 There are three main housing tenures in England: owner occupation and the private and social rented sectors. Owner occupation includes households that own their home outright and households that have a mortgage. The social rented sector includes both local authority and housing association homes.
1.2 This section compares the demographic characteristics of the people who live in these three different tenures, how affordability varies between the sectors, and how this varies by region and has changed over time. It also describes the characteristics of first time buyers, including details on how they funded the purchase of their first home.
1.3 It then explores housing costs, the extent to which private and social renters claim housing support to help meet the cost of their rent, and whether households are in rent or mortgage arrears. Savings and buying expectations are then explored. Rates of overcrowding and under-occupation by tenure are then examined, followed by analysis of loneliness and well-being and the extent to which this varies by tenure.
Trends in tenure
1.4 In 2021-22, there were an estimated 24.2 million households in England living in self-contained accommodation, Annex Table 1.1. This figure excludes those living in institutional accommodation such as nursing homes or halls of residence.
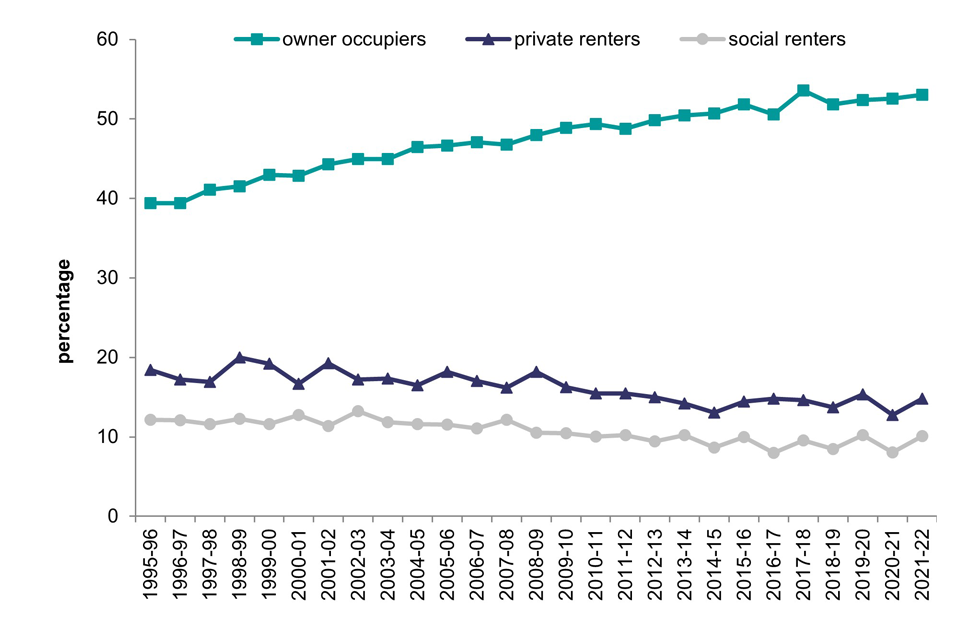
1.5 Owner occupation remained the largest tenure group, with 15.6 million households, representing 64% of all households in 2021-22. Ownership rates were highest in 2003 at 71% of all households. Compared to 10 years ago, owner occupation has not changed (the difference between 65% in 2011-12 to 64% in 2021-22 is not statistically significant). However, owner occupation has increased over more recent years, from a low of 63% in 2016-17 to the current rate of 64%, Figure 1.1.
1.6 Owner occupation is made up of two distinct groups: outright owners and those buying with a mortgage (referred to throughout this report as ‘mortgagors’). Since 2013-14 there have been more outright owners than mortgagors and in 2021-22, 35% of households were outright owners while 30% were mortgagors. The increase in the number and proportion of outright owners is at least partly explained by population ageing, with large numbers of ‘baby boomers’ reaching retirement age, paying off their mortgages and moving into outright ownership.
Figure 1.1: Trends in tenure (proportions), 1980 to 2021-22

Line chart showing change in proportions of owner occupation, private renting, and social renting from 1980 to 2021-22.
Base: all households
Note: underlying data are presented in Annex Table 1.1
Sources:
1980 to 1991: DOE Labour Force Survey Housing Trailer;
1992 to 2008: ONS Labour Force Survey;
2008-09 onwards: English Housing Survey, full household sample
1.7 In 2021-22, the private rented sector accounted for 4.6 million or 19% of households, no change from 2020-21, but lower than in 2016-17 (20%). Throughout the 1980s and 1990s, the proportion of private rented households was steady at around 9% to 11%. While the sector has doubled in size since the early 2000s, the rate has remained around 19% or 20% since 2013-14.
1.8 The social rented sector, at 4.0 million households (17%), is the smallest tenure, following a longer-term downward trend which stabilised over the last decade or so.
1.9 The composition of the social sector has changed in the last decade. In 2011-12, the social rented sector accounted for 17% of households with 9% (2.0 million) renting from housing associations and 8% (1.8 million) renting from local authorities. In 2021-22, more households (10% or 2.5 million) rented from housing associations, and fewer (6% or 1.6 million) from local authorities, Figure 1.2.
Figure 1.2: Trends in tenure (thousands of households), 1980 to 2021-22

Line chart showing change in counts of outright ownership, owning with a mortgage, private renting, and social renting from 1980 to 2021-22.
Base: all households
Notes:
1) underlying data are presented in Annex Table 1.1
2) separate housing association/local authority estimates are not available prior to 2008-09. This is because a large number of HA tenants wrongly report that that they are LA tenants; most commonly because their home used to be owned by the council but had transferred to a housing association. Since 2008-09, an adjustment has been made for this.
Sources:
1980 to 1991: DOE Labour Force Survey Housing Trailer;
1992 to 2008: ONS Labour Force Survey;
2008-09 onwards: English Housing Survey, full household sample
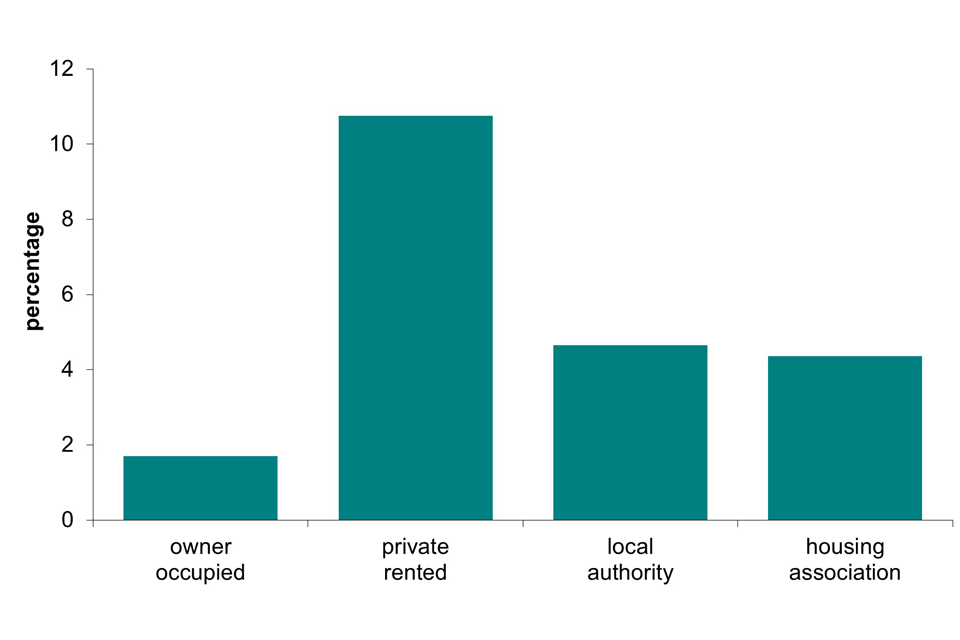
1.10 When compared with the other English regions, London has a very different tenure profile. Renting is more prevalent and outright ownership is less prevalent in London than in the rest of England, Figure 1.3 and Annex Table 1.2.
1.11 In 2021-22, 29% of households in London were private renters, compared to 17% in the rest of England. A similar pattern is seen in the social rented sector, with 22% of London households being social renters, compared to 16% in the rest of England.
1.12 There are similar proportions of households renting from housing association in London (11%) compared to the rest of England (10%). However, the proportion of households in London (11%) renting from a local authority was much higher than the proportion in the rest of England (6%).
1.13 In 2021-22, owner occupation rates were lower in London (49%) than in the rest of England (67%). This disparity appears to be driven by a difference between the proportion of outright owners in London compared to the rest of England. In London, 22% of households are outright owners, compared to 37% in the rest of England. There are similar proportions of mortgagors in London (27%) and in the rest of England (30%).
Figure 1.3: Tenure, London and the Rest of England, 2021-22

Bar chart comparing the percentage of outright owners, mortgagors, private renters and social renters in London and the rest of England.
Base: all households
Note: underlying data are presented in Annex Table 1.2
Source: English Housing Survey, full household sample
Demographic and economic characteristics
1.14 In this section the demographic and economic profile of the household reference person (HRP) is explored in more detail. The HRP is the ‘householder’ in whose name the accommodation is owned or rented (see the glossary for further information).
Age
1.15 Not surprisingly, outright owners were concentrated among the older age bands, while mortgagors were typically in the middle age bands. In 2021-22, 63% of outright owner households had a HRP aged 65 or over, while 60% of households with a mortgage had a HRP aged 35-54. About two thirds (65%) of households in the private rented sector had a HRP aged under 45 years, Annex Table 1.3.
1.16 This variation by age was less apparent in social rented households, where 14% of households had a HRP aged 25-34, 16% aged 35-44, 20% aged 45-54 and 19% aged 55-64. The most prevalent group in the social rented sector were households with a HRP aged 65 or over (28%).
1.17 In 2021-22, 41% of those aged 25-34 were owner occupiers, a similar proportion to those privately renting (43%). Compared to 2020-21, the proportion of households aged 25-34 who are owners decreased (from 47% to 41%) and the proportion of private renters increased (from 37% to 43%). While the difference between these years is statistically significant, it is possible that this is not a reflection of a real difference in the profile of households, but rather, due to the impact the Covid-19 pandemic had on the EHS sample in 2020-21, where more responses than usual came from older and owner occupied households, and fewer from younger and renting households. Compared to 2019-20, the proportion of owner occupiers aged 25-34 (41%) is similar to 2021-22 (41%). In the same way, the proportion of private renters aged 25-34 was 42% in 2019-20, similar to the 43% in 2021-22, Annex Table 1.4.
1.18 The apparent decrease in owner occupation among those aged 34-45, from 61% in 2020-21 to 59% in 2021-22 is not statistically significant. Over the last decade, there was a decrease in owner occupation among those aged 34-45 from 64% in 2011-12 to 59% in 2021-22. Over the same period, there was an increase in private renters of the same age, from 20% to 25%.
1.19 In 2021-22, 66% of households aged 45-54 were owner occupiers. Similar proportions were private renters (17%) and social renters (18%). Over the last decade, there was an increase in the number and proportion of people aged 45-54 living in the private rented sector, from 12% (530,000 households) in 2011-12 to 17% (740,000 households) in 2021-22. Over the same period there was a decrease in the proportion of owner occupiers aged 45-54 from 72% to 66%. This was driven by a decrease in mortgagors, from 54% to 49%.
1.20 There was also an increase in the number and proportion of people aged 55-64 living in the private rented sector, from 7% (252,000 households) in 2011-12 to 11% (477,000 households) in 2021-22. Over the same period there was a corresponding decrease in the proportion of owner occupiers aged 55-64 from 76% to 71%.
1.21 Over the last ten years, the rate of owner occupation increased for those aged 65 and over. In 2011-12, 76% of those aged 65 and over were owner occupiers. In 2021-22, this increased to 79%. This was largely driven by an increase in outright owners (from 71% to 74%) over the last decade. Over the same period, the proportion of social renters aged 65 and over decreased, from 19% in 2011-12 to 16% in 2021-22.
Household type
1.22 Household type varied by tenure. Reflecting their older age profile, outright owner households were predominately couples with no dependent children (41%), lone female households (24%) and lone male households (15%), Annex Table 1.3.
1.23 Couples with and without dependent children predominated among mortgagors (59%), while the social rented sector had high proportions of single person households (22% of social renters were lone females, 21% were lone males).
1.24 The proportion of households that consisted of a lone person sharing with another lone person/s (house sharers) was higher in the private rented sector (7%) than among owner occupiers (1%) and social renters (2%), Annex Table 1.3.
1.25 Not surprisingly, the proportion of households with children varied by tenure. Some 46% of mortgagor households had dependent children, higher than all other tenures. In 2021-22, 32% of private renters, 33% of social renters and just 7% of outright owners had dependent children, Annex Table 1.5.
1.26 In the EHS, household size is measured by the mean number of persons per household. In 2021-22 this was 2.3 persons, up from 2.2 persons in 2020-21, but lower than 2.4 persons in 2019-20, Annex Table 1.3.
1.27 Mortgagors had the largest household size at 2.8 persons, and outright owners the smallest household size (1.8 persons). Social renters (2.2 persons) and private renters (2.3) had similar household sizes.
Economic status and income
1.28 In 2021-22, 51% of all households had a HRP working full-time, 10% were working part-time and 29% were retired. Around 3% of households were unemployed, 1% were in full-time education and 7% were ‘other inactive’, a group which includes those who had a long-term illness or disability and those who were looking after the family or home, Annex Table 1.3.
1.29 Among outright owner households, 64% had a retired HRP, consistent with the older age profile of this group. One third (33%) of outright owners were working (either full- or part-time). In contrast, most (93%) mortgagors were working, with 85% in full-time work and 8% in part-time work. A small proportion (3%) of mortgagors were retired, Figure 1.4.
1.30 Over three quarters (78%) of private renters were working, with 66% in full-time work and 11% in part-time work. In 2021-2022, 7% of private renters were retired, 4% were unemployed, 4% were in full-time education and 8% were other inactive.
1.31 Among social renters, 43% were working, with 29% working full-time, and 15% working part-time; 8% of social renters were unemployed. Nearly half (49%) of social renters were retired, in full-time education or ‘other’.
Figure 1.4: Economic activity of HRP, by tenure, 2021-22
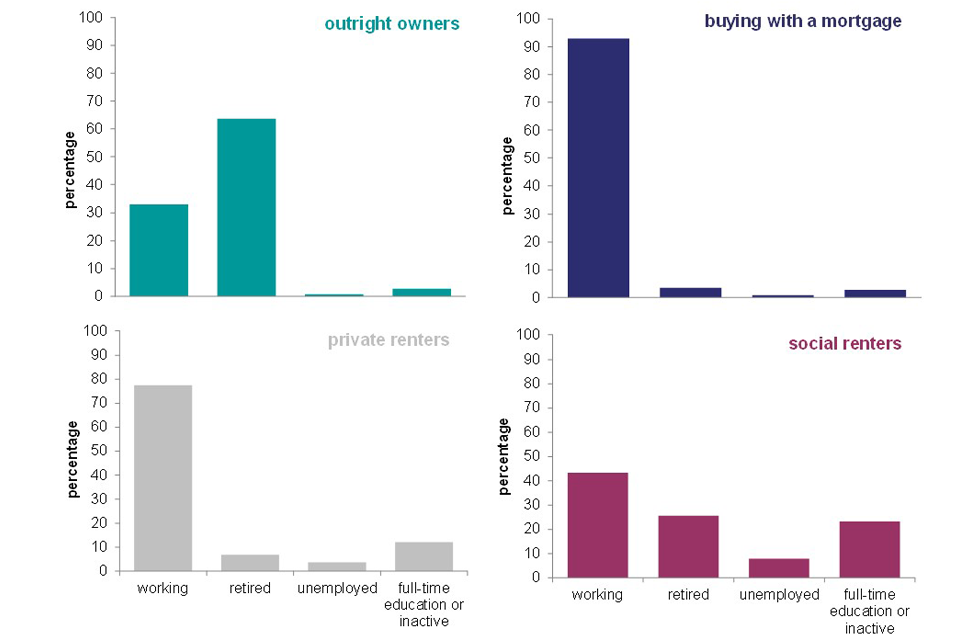
Bar charts showing the percentage of outright owners, mortgagors, private renters, and social renters who are working, retired, unemployed, and in full time education or inactive.
Base: all households
Note: underlying data are presented in Annex Table 1.3
Source: English Housing Survey, full household sample
1.32 Income is presented as quintiles, where all households are divided into five equal groups based on their income (i.e. those in the bottom 20%, the next 20% and so on). These can be used to compare income levels of particular groups to the overall population. Social renters were concentrated in the lowest two income quintiles (47% were in the lowest income quintile; 28% in the second lowest), while mortgagors were concentrated in the two highest income quintiles (40% were in the top income quintile; 29% in the second highest). Private renters and outright owners were more evenly spread across the quintiles, Figure 1.5.
Figure 1.5: Weekly household income, by tenure, 2021-22
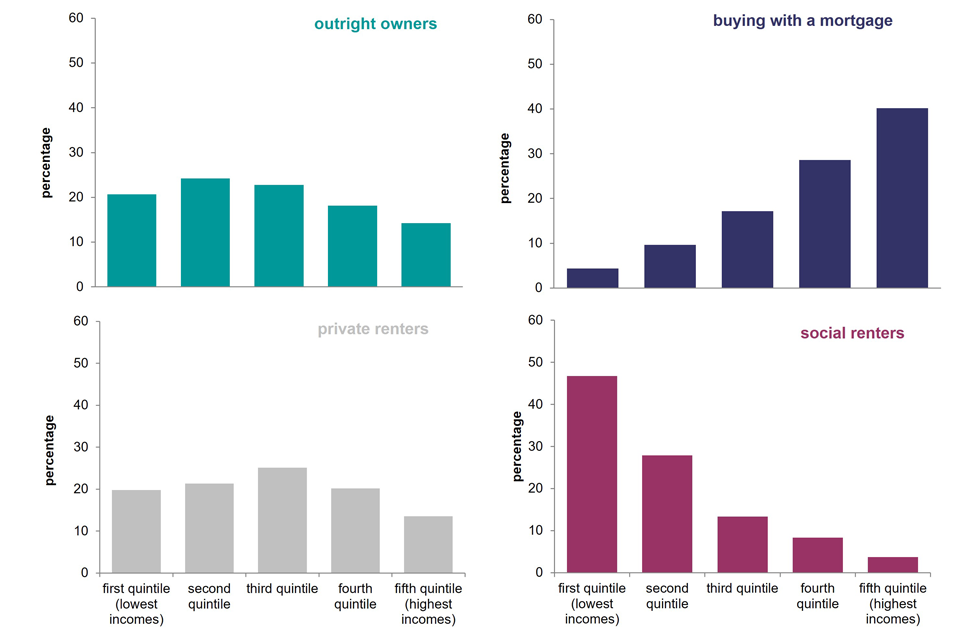
Bar charts showing the percentage of outright owners, mortgagors, private renters, and social renters in each of the five income quintiles.
Base: all households
Note: underlying data are presented in Annex Table 1.3
Source: English Housing Survey, full household sample
Disability and long-term illness
1.33 Over half (54%) of households in the social rented sector had one or more household members with a long-term illness or disability. For private renters, this figure was 30%. While 30% of owner occupied households also had one or more household members with a long-term illness or disability, this varied between mortgagors and outright owners. Likely reflecting their older age profile, 37% of households who owned outright contained someone with a disability, compared to 22% of mortgagors.
Internet access
1.34 In 2021-22, 93% of households in England had internet access at home. Almost all mortgagors (99%) had internet access at home, higher than private renters (95%) and outright owners (91%). Social renters (83%) were the least likely tenure to have access to the internet at home, Annex Table 1.3.
First time buyers
1.35 In 2021-22, there were around 852,000 recent first time buyers in England, around 100,000 fewer compared to last year in 2020-21. Recent first time buyers are those who had bought a home for the first time in the last three years and had not previously owned a property, Annex Table 1.6[footnote 1]. These figures fluctuate year on year due to small sample sizes, particularly in London, and should be considered as indicative only.
Age
1.36 In 2021-22, the average age of first time buyers was 34 years. The apparent difference in the average age of first time buyers in London (34 years) compared to the rest of England (33 years) is not statistically significant, Annex Table 1.7.
Household type
1.37 In 2021-22, 38% of first time buyer households were couples without dependent children, 29% were one person households and 24% were couples with dependent children. A further 6% were multi-person households, and the remaining 3% were lone parent households, Annex Table 1.8.
Income and mortgage type
1.38 The average (mean) deposit of a first time buyer in 2021-22 was £43,693 (£30,000 median). Given this, it was not surprising that 63% of first time buyers were in the top two income quintiles, Annex Tables 1.8 and 1.9[footnote 2].
1.39 Of those first time buyers who had a mortgage, nearly all (98%) had a repayment mortgage. Over half of first time buyers (56%) with a mortgage had a repayment period of 30 years. A small proportion (6%) had a 1-19 year mortgage. The remaining first time buyers (38%) had a repayment period of 20-29 years, Annex Table 1.9.
1.40 Around two thirds of first time buyers (68%) paid a deposit of less than 20% of the purchase price of their property. This includes more than one fifth (22%) of first time buyers who paid a deposit between 0% and 9%, and a further 46% who paid a deposit of between 10% and 19% of the purchase price of their property. A small proportion (5%) bought their first home outright.
1.41 Most first time buyers (85%) funded the purchase of their first home with savings, 27% reported receiving help from family or friends, while 8% used an inheritance as a source of deposit.
Housing costs
Mortgage costs
1.42 In 2021-22, as noted in the introduction, more respondents opted to not report their mortgage amounts. This resulted in a slightly higher than normal number of imputed mortgage values, and a small number of slightly higher than expected mortgage amounts. Mean mortgage amounts in 2021-22 saw a significant increase on 2020-21 figures, though we cannot be sure whether this is a real change, or a change associated with differences in data collection. These higher than expected values impacted mean mortgages more than median, and we present both statistics below.
1.43 In 2021-22, the average (median) mortgage payment was £154 per week. Median mortgage payments were higher in London (£277) than in the rest of England (£143). Between 2020-21 and 2021-22, the median mortgage payment in England increased from £145 to £154. This increase was larger in London, increased by £65 from £212 to £277 per week. Over the same period, the median mortgage payment in the rest of England increased by £5 from £138 to £143, Annex Table 1.10.
1.44 The average (mean) mortgage payment was £204 per week. Mean mortgage payments were higher in London (£336) than in the rest of England (£183). Since 2020-21, the weekly mortgage payment in London increased by £92 from £244 to £336. Over the same period the average (mean) weekly mortgage payment in the rest of England increased by £20, from £163 to £183.
Rents
1.45 In 2021-22 the average (median) rent (excluding services but including housing support) for social renters was £97 per week, and £173 for private renters.
1.46 The average (mean) rent for households in the social sector was £106 compared with £209 per week in the private rented sector[footnote 3], a difference of £103 per week, Annex Table 1.11.
1.47 Social and private rents are higher in London than in the rest of England. Moreover, the gap between social and private rents is greater in London than it is in the rest of England. In 2021-22, the average (mean) private rent in London was £353 per week, more than twice the average rent than in the rest of England (£166 per week).
1.48 Social renters in London paid, on average (mean), £141 per week, an increase of £12 per week from 2020-21. In the rest of England, social renters paid on average a similar amount in 2021-22 (£97 per week) to 2020-21 (£95 per week).
Affordability
1.49 In this section, affordability is explored. A simple measure of housing affordability has been derived by calculating the average proportion of income spent on housing. The proportion of income spent on mortgage payments (both the repayment element and the interest element) is compared with the proportion spent on rents in the social and private rented sectors. Housing-related costs, such as water and fuel bills, insurance, maintenance costs and council tax are not included in the calculation. Income is taken to be the gross weekly household income, including and excluding benefits. Outright owners are excluded from this analysis as they have no mortgage costs.
1.50 Two different calculations are made: one based on the household income (i.e. the income of all the members of the household), and another based on HRP and partner income only (irrespective of whether there are other adults in the household). For both measures it is not known which members of the household contribute to the rent or mortgage. For the household measure, it is assumed that all household members contribute to the rent or mortgage; for the HRP and partner measure, it is assumed that only the HRP and partner contribute.
1.51 On average, mortgagors spent 22% of their household income on mortgage payments, whereas rent payments including housing support were 27% for social renters and 33% of household income for private renters. Excluding housing support, the average proportion of income spent on rent was 36% for social renters and 38% for private renters, Annex Table 1.12 and Figure 1.6.
Figure 1.6: Mortgage/rent as a proportion of household income (including and excluding housing support), by tenure, 2021-22

Bar chart comparing the proportion of household income spent on mortgage/rent including and excluding housing support for mortgagors, private renters, local authority social renters, and housing association social renters.
Base: all households making mortgage or rent payments
Notes:
1) underlying data are presented in Annex Table 1.12
2) excludes households without a mortgage (i.e. outright owners), those with part-mortgage and part-rent (i.e. shared owners) and zero rent households
3) includes income from all household members irrespective of whether or not they contribute to the rent or mortgage
Source: English Housing Survey, full household sample
1.52 Between 2011-12 and 2021-22, the proportion of household income that mortgagors spent on their mortgage increased from 18% to 22%. The proportion of household income (including housing support) that private renters spent on their rent decreased from 35% to 33%. In the same period, the proportion of household income that social renters spent remained similar (28% in 2011-12 and 27% in 2021-22).
1.53 When HRP and partner income is used, mortgagors spent, on average, 23% of their income on mortgage payments, whereas, including housing support, rent payments were 30% of income for social renters and 37% of joint income for private renters. Excluding housing support, the average proportion of income spent on rent was 40% for social renters and 44% for private renters.
Mortgage and rent arrears
1.54 In 2021-22, approximately 52,000 (0.7%) mortgagors reported being in arrears. This is similar to the proportion in 2020-21 (0.9%; 67,000 households). The proportion of mortgagors who reported being in arrears has remained at or below 2% since 2011-12, Annex Table 1.13.
1.55 In 2021-22, most mortgagors reported they found it very or fairly easy to afford their mortgage (93%)[footnote 4]. However, 6% of mortgagers found it fairly difficult and 1% found it very difficult to afford their mortgage, Annex Table 1.15.
1.56 In 2021-22, 3% of private renters reported being in rent arrears at the time of interview, and 4% reported that they had fallen behind with rent payments in the 12 months prior. This was similar to the proportion who reported being currently in arrears (4%) or in arrears in the 12 months prior (4%) in 2020-21, Annex Table 1.14.
1.57 Social renters were more likely to report being in rent arrears than private renters: 10% reported that they were currently in arrears, and 8% reported that they had fallen behind with payments in the 12 months prior to the interview. While there is an apparent increase in the number of social renters reporting rent arrears from 2020-21, this difference is not statistically significant.
1.58 In 2021-22, just over a quarter of private renters (26%) reported finding it either fairly or very difficult to afford their rent, similar to the proportion in 2020-21 (25%). A similar proportion of social renters (25%) reported finding it either fairly or very difficult to afford their rent. However, this is lower than in 2016-17, when 32% of social renters and 31% of private renters reported finding it very or fairly difficult to afford their rent, Annex Table 1.16.
Housing support
1.59 Housing support is a means-tested benefit provided by the state to low income households. It includes both legacy Housing Benefit, as well as the housing element of Universal Credit. This section compares receipt of housing support by households in the social and private rented sectors[footnote 5].
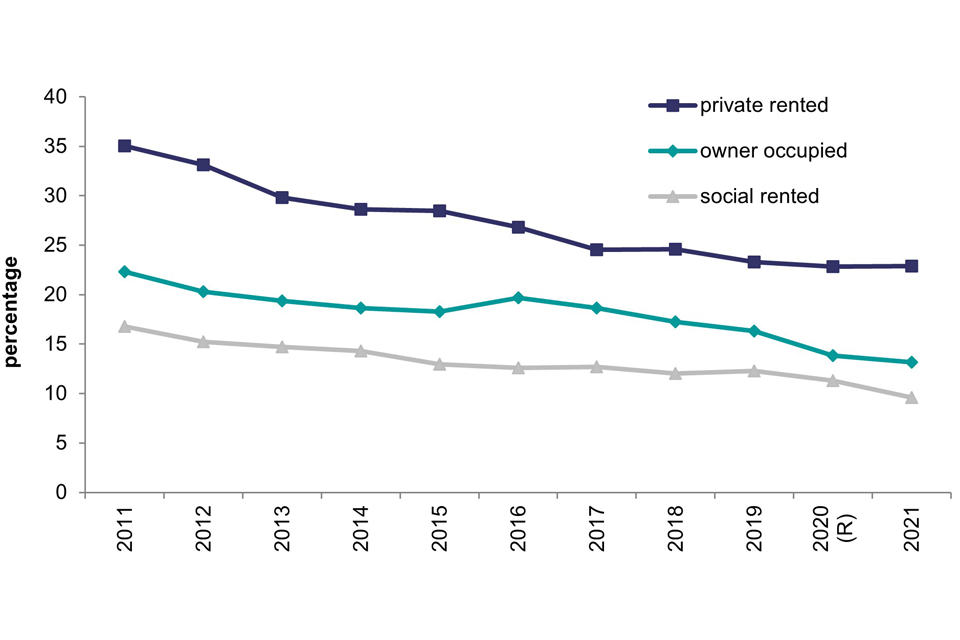
1.60 In 2021-22, 57% (2.3 million households) of social renters and 25% (1.2 million households) of private renters received housing support to help with the payment of their rent, Annex Table 1.17.
1.61 The proportion of private renters receiving housing support in 2021-22 (25%) remained similar to the proportion in 2020-21 (26%), although there was an increase from 20% in 2019-20. The proportion of social renters receiving housing support (57%) has remained similar in recent years at 60% in 2020-21 and 56% in 2019-20.
Figure 1.7: Percentage of private and social renters in receipt of housing support, 2011-12 to 2021-22

Line chart showing the change in percentage of social renters and private renters receiving housing support from 2011-12 to 2021-22.
Base: all renting households
Note: underlying data are presented in Annex Table 1.17
Source: English Housing Survey, full household sample
1.62 Social renters in receipt of housing support received an average of £86 per week, lower than the average amount received by private renters (£127). The average amount of housing support received by private renters remained similar to 2020-21 (£128), and the average amount of housing support received by social renters remained similar at £85 in 2020-21.
1.63 Almost a third (30%) of working social renters received housing support in 2021-22. This was lower for private renters, where 18% of working private renters received housing support in 2021-22, Annex Table 1.18.
Savings
1.64 For 2021-22, the proportion of households with savings has decreased compared to the year previous (2020-21). In 2021-22, 64% of households in England reported they had savings, compared to 68% in 2020-21, Annex Table 1.19.
1.65 While owner occupiers were the most likely tenure to have savings, at 78%, this decreased from 81% in 2020-21. Private renters (52%) were more likely to have savings than social renters (26%). The proportion of social renters with savings decreased from 31% in 2020-21 to 26% in 2021-22, while the apparent decrease in the proportion of private renters with savings, from 55% in 2020-21 to 52% in 2021-22, is not statistically significant. Within owner occupiers, those who own outright are more likely to have savings (83%) than are mortgagors (73%). However, the proportion of those who own outright with savings has decreased from 87% in 2020-21, while the proportion of mortgagors with savings remained similar (75% in 2020-21), Figure 1.8.
Figure 1.8: Proportion of households with savings, by tenure, 2019-20 to 2021-22

Bar chart comparing the proportion of households with savings for 2019-20, 2020-21, and 2021-22 for outright owners, mortgagers, private renters, and social renters.
Base: all households
Note: underlying data are presented in Annex Table 1.19
Source: English Housing Survey, full household sample
Future buying expectations
1.66 In 2021-22, 62% of private renters (2.8 million households) and 27% of social renters (1.1 million households) said they expected to buy a property at some point in the future, Annex Table 1.20.
1.67 There is no statistically significant difference in buying expectations of renters between 2020-21 and 2021-22, Annex Table 1.21 and Figure 1.9.
Figure 1.9: Percentage of private and social renters who expect to buy, 2011-12 to 2021-22

Line chart showing the change in the percentage of private and social renters who expect to buy from 2011-12 to 2021-22.
Base: all renting households
Note: underlying data are presented in Annex Table 1.21
Source: English Housing Survey, full household sample
1.68 Among social renters who expected to buy, 52% of local authority tenants expected to buy their current home, higher than the 33% of housing association tenants who expected to buy their current home, Annex Table 1.20.
1.69 Renters who expected to buy a home were also asked when they expected to do so. In 2021-22, 28% of private renters expected to buy in less than two years, decreasing from 35% in 2020-21. Social renters were less likely to expect to buy in less than two years (15%), and this remained similar to the proportion in 2020-21 (19%). More than a third (35%) of private renters and 55% of social renters expecting to buy thought that it would be five years or more before they did so.
Length of time in current accommodation and tenure
1.70 In 2021-22, owner occupiers had lived at their current address for an average of 17.6 years. Not surprisingly, outright owners lived in their current home for longer than mortgagors (24.5 years compared with 9.4 years), Annex Table 1.22.
1.71 There has been an increase in the average number of years that owner occupiers have spent in their current address, from 16.0 years in 2020-21 to 17.6 years in 2021-22. Length of time at current address has also increased for social renters, from 10.8 years in 2020-21 to 12.7 years in 2021-22. The change in average number of years in current home for private renters (from 4.2 to 4.4) is not statistically significant.
1.72 While social renters lived at their current address for an average of 12.7 years, this masks variation between local authority and housing association renters. Households that rent from local authorities lived at their current address for 14.3 years, higher than housing association renters, where the average was 11.6 years.
1.73 Private renters had, on average, lived in their current home for 4.4 years. For private renters who had been resident for less than 1 year in 2021-22, 65% were in private rented housing previously. Of social renters who had been residents for less than a year, 55% were previously tenants of social housing, Annex Table 1.23.
Household moves
1.74 In 2021-22, approximately 1.8 million households had moved home in the previous 12 months. Of these, 363,000 were new households, 1.1 million were moves within tenure and the remaining 378,000 were moves between tenures, Annex Table 1.23.
1.75 The largest number of household moves occurred within, into or out of the private rented sector. In total, 620,000 households moved within the tenure (from one privately rented home to another) and 219,000 new households moved into the private rented sector. There were 116,000 moves into the sector from other tenures, of which 79% (91,000) were from owner occupied households. There were 242,000 moves out of the sector, with 79% (192,000) of these moving to owner occupied accommodation, Figure 1.10.
1.76 There was much less movement in the social rented sector. In 2021-22, 115,000 households moved from one social rented property to another, and 36,000 new households moved into the sector. There were 59,000 households that moved into the sector from other tenures, 51,000 of which were from the private rented sector. There were 25,000 households that left the social rented sector to move to the private rented sector.
1.77 In the owner occupied sector, 361,000 households moved within the tenure and 109,000 new households were created. There were 192,000 households that moved into the tenure from the private rented sector. There were too few households to report the number that left the social rented sector to owner occupation. Around 99,000 households moved out of the sector, with 92% of these (91,000) moving to the private rented sector[footnote 6].
Figure 1.10: Household moves, by tenure, 2021-22

Diagram showing the number of owner occupied, social rented, and private rented households, the number of moves between tenures, the number of moves within tenure, and new households formed in each tenure.
Base: household reference persons resident less than a year
Notes:
1) underlying data are presented in Annex Tables 1.1 and 1.23
2) a small number of cases with inconsistent responses have been omitted
3) survey cannot identify the number of households which have ended
4) to safeguard against data disclosure, findings derived from unweighted cell counts of less than 5 and more than 0 are replaced with a “u”
Source: English Housing Survey, full household sample
Overcrowding and under-occupation
1.78 Levels of overcrowding and under-occupation are measured using the bedroom standard (see glossary for more detail). This is essentially the difference between the number of bedrooms needed to avoid undesirable sharing (given the number, ages and relationship of the household members) and the number of bedrooms actually available to the household.
1.79 Since the number of overcrowded households included in each survey year is too small to enable reliable overcrowding estimates for any single year, data from the three most recent survey years were combined to produce the overcrowding estimates in this section.
1.80 The overall rate of overcrowding in England in 2021-22 was 3%, with approximately 732,000 households living in overcrowded conditions. This is similar to 2020-21 where 3% of households were overcrowded (around 738,000 households), Annex Table 1.24.
1.81 Overcrowding was more prevalent in the rented sectors than for owner occupiers. In 2021-22, 1% of owner occupiers (170,000 households) were overcrowded compared with 8% of social renters (325,000) and 5% of private renters (237,000). Overcrowding was more prevalent in the social rented sector than in the private rented sector.
1.82 Changes seen in overcrowding rates between 2020-21 and 2021-22 in the private and social rented sectors were not statistically significant.
Figure 1.11: Overcrowding, by tenure, 1995-96 to 2021-22

Line chart showing the change in the number of households which are overcrowded for owner occupiers, private renters, and social renters from 1995-96 to 2021-22.
Base: all households
Notes:
1) data are based on three year averages, which are the average of the three years up to and including the labelled date
2) underlying data are presented in Annex Table 1.24
Sources:
1995-96 to 2007-08: Survey of English Housing;
2008-09 onwards: English Housing Survey, full household sample
1.83 The overall rate of under-occupation in England in 2021-22 was 39% with around 9.3 million households living in under-occupied homes (i.e. with two or more spare bedrooms), Annex Table 1.25.
1.84 Under-occupation was much more prevalent among owner occupiers than in the rented sectors. Over half (53%) of owner occupied households (8.3 million households) were under-occupied in 2021-22 compared with 15% of private rented (684,000) and 10% of social rented (408,000) households.
1.85 The overall proportion of under-occupied households among owner occupiers in England increased between 2011-12 and 2021-22 from 49% (7.0 million households) to 53% (8.3 million households). No change was seen among renters over the same time period, Figure 1.12.
Figure 1.12: Under-occupation, by tenure, 1995-96 to 2021-22
Line chart showing the change in the number of households which are under-occupied for owner occupiers, private renters, and social renters from 1995-96 to 2021-22.
Base: all households
Note: underlying data are presented in Annex Table 1.25
Sources:
1995-96 to 2007-08: Survey of English Housing
2008-09 onwards: English Housing Survey, full household sample
Well-being and loneliness
1.86 In the EHS, well-being is measured using the following four measures of personal well-being:
- Overall, how satisfied are you with your life nowadays? Referred to as ‘life satisfaction’
- Overall, to what extent do you feel the things you do in your life are worthwhile? Referred to as ‘life is worthwhile’
- Overall, how happy did you feel yesterday? Referred to as ‘happiness’
- Overall, how anxious did you feel yesterday? Referred to as ‘anxiety’
For most questions, respondents are asked to give their answers on a scale of 0 to 10 where 0 is ‘not at all’ and 10 is ‘completely’[footnote 7]. These questions have been included in the EHS since 2013-14.
1.87 Loneliness is not measured on a scale of 0 to 10, and instead by asking respondents how often they feel lonely. Here, we focus on those who say they are lonely often or always[footnote 8]. This question was included in the EHS for the first time in 2019-20.
1.88 Personal well-being increased in 2021-22 compared to 2020-21. For all households, the average life satisfaction score increased from 7.3 to 7.5, the average score for thinking ‘life is worthwhile’ increased from 7.6 to 7.8, and average happiness scores increased from 7.2 to 7.5. Anxiety (where a higher score indicates higher levels of anxiety) remained similar at 3.0 compared to 3.1 in 2020-21. These increases were seen for both owner occupiers and social renters across all measures, except anxiety, which remained similar to 2020-21. There was no statistically significant difference for private renters in 2021-22 compared to 2020-21 in any measure.
1.89 Personal well-being scores varied by tenure. Owner occupiers had higher scores for life satisfaction (7.8), thinking life is worthwhile (8.0), and happiness (7.7), and lower scores for anxiety (2.7), than the private rented sector (7.2; 7.6; 7.3; 3.3). In turn, private renters report higher well-being scores than social renters (7.0; 7.4; 7.0; 3.6). Among owner occupiers, outright owners showed higher scores than mortgagors for life satisfaction (7.8 compared with 7.7) and happiness (7.8 compared with 7.6), and lower scores for anxiety (2.6 compared with 2.9), Annex Table 1.26.
Figure 1.13: Well-being, by tenure, 2021-22
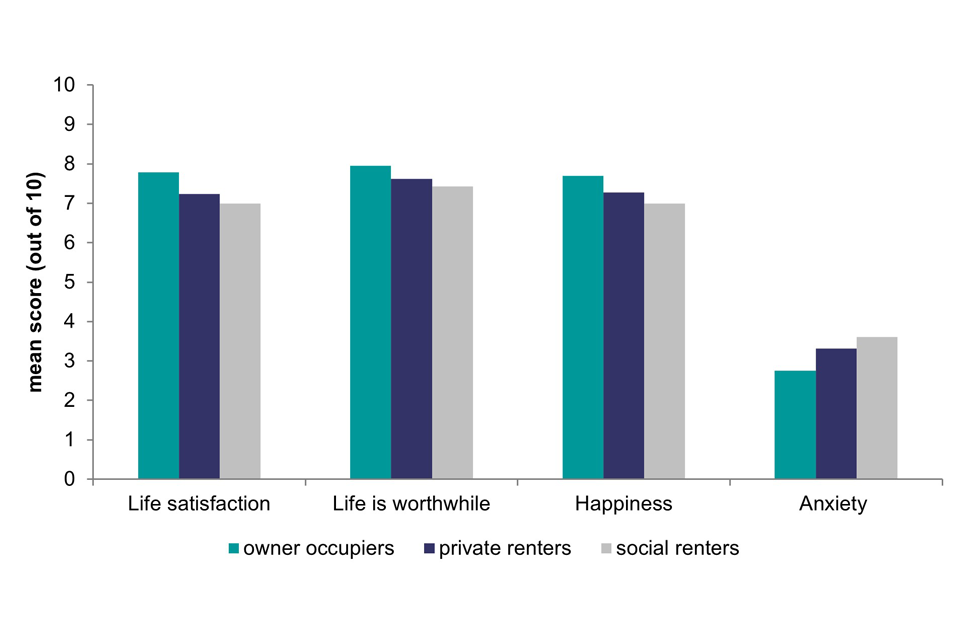
Bar chart comparing mean scores out of ten for life satisfaction, thinking life is worthwhile, happiness, and anxiety for owner occupiers, private renters, and social renters.
Base: all household reference person
Note: underlying data are presented in Annex Table 1.26
Source: English Housing survey, full household sample
1.90 These findings may suggest that there is a direct relationship between well-being and tenure. However, there were important differences between the types of households that typically live in each tenure, and these differences may be related to well-being. For example, social renters were more likely to be unemployed or ‘other inactive’ (this includes long-term sick or carers) than owner occupiers or private renters, as well as being more likely to be in the lowest income quintiles, Annex Table 1.3. Social renters are also more likely than private renters to have been in arrears in the past 12 months, Annex Table 1.14.
1.91 Overall, 7% of HRPs reported that they were lonely often or always, decreasing from 9% in 2020-21. This varied by tenure with social renters more likely to report that they were often or always lonely (14% compared with 5% of owner occupiers and 10% of private renters), Annex Table 1.27.
Section 2: Housing stock
2.1 This section begins with an overall profile of the English housing stock, including the age, type and size of dwellings by tenure and whether homes have outside space. It then reports on house condition, including the prevalence of damp and the extent to which the English housing stock meets the Decent Homes Standard. The energy efficiency of the English housing stock is also explored, followed by a section on electric smart meters, smoke and carbon monoxide alarms.
2.2 Results in this section of the report are predominantly presented for ‘2021’ and are based on fieldwork carried out between April 2020 and March 2022 (a mid-point of April 2021 - see Technical report for more details) .
2.3 As a result of COVID-19 restrictions, internal inspections of properties were replaced with external inspections, where the inspection was restricted to an assessment of the exterior of the dwelling and supplemented by information about the interior of the dwelling the surveyor collected (socially distanced) at the doorstep. In some instances, we have been able to model data to provide headline figures for this report. We indicate where this has been done at the beginning of each topic area. The majority of the findings in this section are based on a sample that excludes vacant dwellings because interviewers did not visit the sampled addresses and therefore could not identify which were vacant. This is different to previous reports, where the physical survey data included both occupied and vacant dwellings.
Stock profile
2.4 In 2021, there were an estimated 23.7 million occupied residential dwellings in England. Of these, 15.5 million (65%) were owner occupied, 4.3 million (18%) were private rented, 1.5 million (6%) were local authority and 2.4 million (10%) were housing association homes, Figure 2.1 and Annex Table 2.1.
Figure 2.1: Occupied dwellings, by tenure, 2021
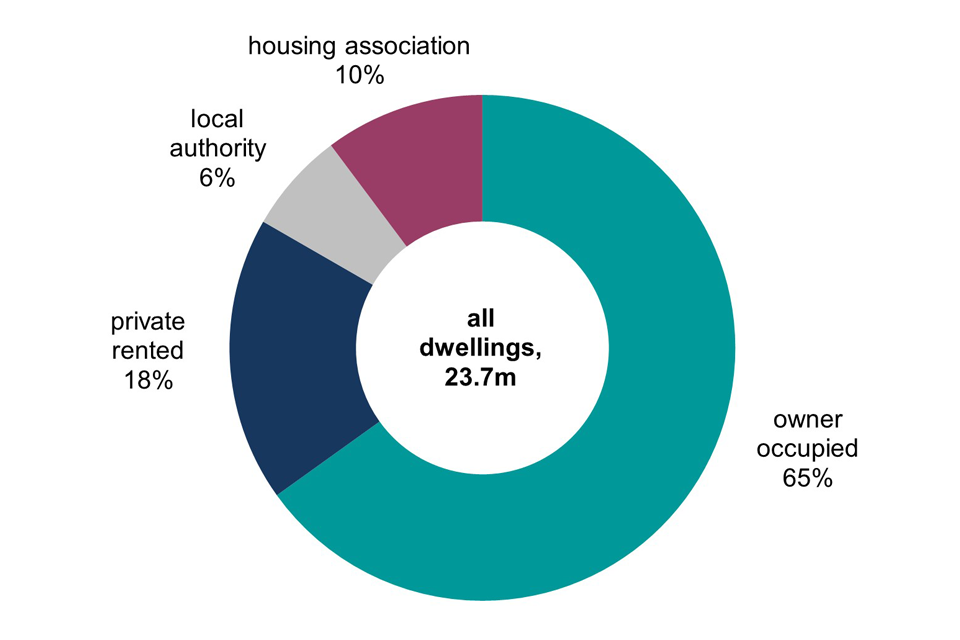
Pie chart of the percentage of occupied dwellings in England by tenure in 2021-22.
Base: Occupied dwellings
Notes:
1) the 2021 dwelling sample is for occupied properties only. Due to the COVID-19 pandemic, it was not possible for EHS surveyors to conduct a full internal inspection of vacant properties in 2021
2) underlying data are presented in Annex Table 2.1
Source: English Housing survey, dwelling sample
Dwelling age
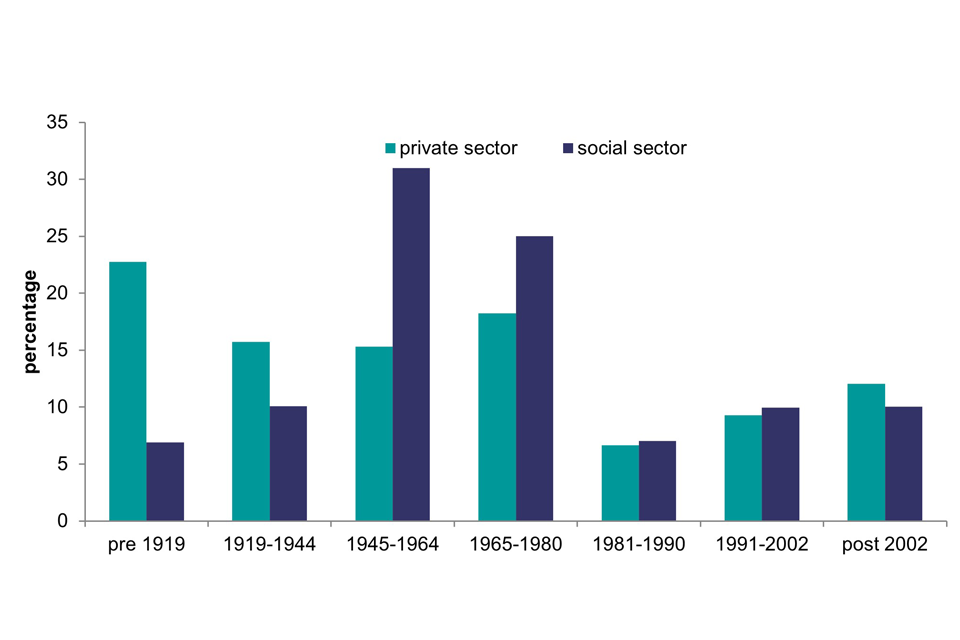
2.5 The age of dwellings in England varied by tenure, with private rented dwellings tending to be older. Almost two fifths of dwellings (39%) in the private sector were built before 1945 compared with 17% in the social sector. In contrast, more than half of dwellings (56%) in the social sector were built between 1945-1980 compared with just over a third (34%) in the private sector, Figure 2.2 and Annex Table 2.1.
2.6 Within the social sector, housing association stock tends to be newer. Almost two fifths of housing association dwellings (38%) were built after 1980 compared with just 10% of local authority dwellings, Annex Table 2.1.
Figure 2.2: Occupied dwelling age, by tenure, 2021
Bar chart comparing the percentage of occupied dwellings in each age grouping in the private and social tenures.
Base: Occupied dwellings
Notes:
1) the 2021 dwelling sample is for occupied properties only. Due to the COVID-19 pandemic, it was not possible for EHS surveyors to conduct a full internal inspection of vacant properties in 2021
2) underlying data are presented in Annex Table 2.1
Source: English Housing survey, dwelling sample
Dwelling type
2.7 While the majority of dwellings in both the private and social sector are houses and bungalows, the proportion of flats is almost twice as high in the social sector (45%) than in the private sector (18%), Figure 2.3 and Annex Table 2.1.
2.8 This is particularly pronounced for low rise purpose built flats, which make up almost two fifths (38%) of dwellings in the social sector compared to 11% in the private sector. Local authority dwellings were more likely to be low rise purpose built flats (42%) than housing association dwellings (36%).
2.9 In 2021, high rise purpose built flats made up 3% of the total housing stock (616,000 dwellings). This type of dwelling is more prevalent in the social sector than the private sector (5% compared to 2%), however there were no significant differences between the proportion of high rise flats within local authority and housing association stock.
2.10 The proportion of converted flats remains higher in the private rented sector (14%) than in the social rented (3%) and owner occupied stock (2%).
Figure 2.3: Occupied dwelling type, by tenure, 2021

Bar chart comparing the percentage of occupied dwellings in each dwelling type in private and social tenures
Base: Occupied dwellings
Notes:
1) the 2021 dwelling sample is for occupied properties only. Due to the COVID-19 pandemic, it was not possible for EHS surveyors to conduct a full internal inspection of vacant properties in 2021
2) underlying data are presented in Annex Table 2.1
3) Dwelling type figures do not match live table DA1101 due to different variable used for bungalows
Source: English Housing survey, dwelling sample
Dwelling size
2.11 In 2021, the average (mean) usable floor space of all dwellings was 97m2. Social rented homes tended to be smaller (67m2) than private rented homes (75m2). Owner occupied homes were larger (111m2) than all private and social rented homes, Annex Table 2.1.
2.12 Almost a quarter of homes in the social sector (24%) had a usable floor space of less than 50m2 compared with 18% of private rented and 3% of owner occupied homes. This reflects the predominance of flats in the social sector compared to houses and bungalows in the private sector.
Figure 2.4: Usable floor area for occupied dwellings, by tenure, 2021

Bar chart comparing the percentage of owner occupied, private rented, and social sector dwellings in each category of useable floor area.
Base: Occupied dwellings
Notes:
1) the 2021 dwelling sample is for occupied properties only. Due to the COVID-19 pandemic, it was not possible for EHS surveyors to conduct a full internal inspection of vacant properties in 2021
2) underlying data are presented in Annex Table 2.1
Source: English Housing survey, dwelling sample
Plots and outside space
2.13 The English Housing Survey records a number of details relating to the land immediately surrounding a dwelling, referred to as the dwelling’s plot. The plot may be private (exclusive access) or shared. The plot may consist of hard landscaping, soft landscaping, or a combination.
2.14 In 2021, the majority of dwellings in England (81%) had a private plot (for the sole use of the dwelling) and 13% had a shared plot. While the proportion of dwellings with shared outside space has decreased from 16% in 2020, the proportion with no shared or private plot at all has increased from 3% in 2020 (773,000 dwellings) to 5% in 2021 (1.27 million dwellings), Annex Table 2.2.
2.15 Almost all houses and bungalows had a private plot (99%) while over half of flats had a shared plot (57%), Figure 2.5.
2.16 Owner occupied dwellings were more likely to have a private plot (91%) than social rented and private rented dwellings (both 63%). Around one in three social rented dwellings (29%) had a shared plot, a higher proportion than private rented homes (23%). The opposite was true for no plot, where private rented dwellings were almost twice as likely (14%) as dwellings in the social sector (8%) to have no private or shared plot.
2.17 Dwellings in London were much less likely (56%) than the rest of England (86%) to have a private plot and 19% had no plot at all, up from 12% in 2020. Dwellings in London were more likely (25%) than all other regions to have access to a shared plot (ranging from 5% to 14%).
Figure 2.5: Presence of plot in occupied dwellings, by dwelling type, tenure and region, 2021

Bar chat comparing the proportion of dwellings with a private plot, shared plot, or no plot for dwelling type (house / bungalow or flat), tenure (owner occupied, private rented, or social rented), and region (London or Rest of England)
Base: Occupied dwellings
Notes:
1) The 2021 dwelling sample is for occupied properties only. Due to the COVID-19 pandemic, it was not possible for EHS surveyors to conduct a full internal inspection of vacant properties in 2021
2) The EHS records a number of details relating to the land immediately surrounding a dwelling, referred to as the dwelling’s plot. The plot may be private (exclusive access) or shared. The plot may consist of hard landscaping, soft landscaping, or a combination.
3) Underlying data are presented in Annex Table 2.2
Source: English Housing Survey, dwelling sample
House condition
2.18 In 2021-22, due to COVID-19 restrictions, it was not possible to collect all the detailed data required to derive key housing quality variables. As such, predictive modelled estimates, at occupied dwelling level, were produced to indicate whether or not a dwelling met the Decent Homes Standard, HHSRS Category 1 hazard and damp (see the Technical report for more details).
Decent homes
2.19 For a dwelling to be considered ‘decent’ under the Decent Homes Standard it must:
- meet the statutory minimum standard for housing (the Housing Health and Safety System (HHSRS) since April 2006), homes which contain a Category 1 hazard under the HHSRS are considered non-decent
- provide a reasonable degree of thermal comfort
- be in a reasonable state of repair
- have reasonably modern facilities and services
2.20 In 2021, 14% or 3.4 million occupied dwellings failed to meet the Decent Homes Standard. Between 2011 and 2019, there was a notable reduction in the prevalence of non-decent dwellings across all tenures, Annex Table 2.3. While data collected during the COVID-19 period is for occupied dwellings only, and therefore not directly comparable with pre-pandemic data, it is nonetheless consistent with the overall trend.
2.21 The private rented sector had the highest proportion of non-decent homes (23%) while the social rented sector had the lowest (10%). Among owner occupied homes, 13% failed to meet the Decent Homes Standard, Figure 2.6.
Figure 2.6: Non-decent homes, by tenure, 2011 to 2021
Line chart showing the change in percentage of private rented, social rented, and owner occupied dwellings that are classed as non-decent from 2011 to 2021.
Base: 2011-2019, All dwellings; 2020-2021, Occupied dwellings
Notes:
1) 2020 and 2021 figures are estimated based on dwelling level modelled data
2) 2020 have been revised from extrapolated to dwelling modelled data and marked with an (R)
3) In 2018 RdSAP changed to version 9.93 and improvements were made to the modelling
4) 2013-2019 uses SAP12
5) 2010-2012 uses SAP09
6) underlying data are presented in Annex Table 2.3
Sources:
2011-2019 English Housing Survey, dwelling sample
2020-2021 English Housing Survey, modelled data based on occupied dwelling sample
2.22 Local Authority Housing Statistics (LAHS), published alongside this report, show that 8% of local authority homes did not meet the Decent Homes Standard in 2022 (compared to 7% in 2021). The LAHS figures show a lower proportion of non-decent homes because only the properties that local authorities have been made aware of (e.g. after a property is vacated or if the tenant raises an issue) are included in the count. Cases where tenants have refused improvement work are also excluded[footnote 9].
Housing Health and Safety Rating System (HHSRS)
2.23 In 2021-22, due to COVID-19 restrictions it was not possible to collect all the detailed data required to derive key housing quality variables. As such, predictive modelled estimates, at occupied dwelling level, were produced to indicate whether or not a dwelling had a HHSRS Category 1 hazard (see the Technical report for more details).
2.24 The HHSRS is a risk-based assessment that identifies hazards in dwellings and evaluates their potential effects on the health and safety of occupants and their visitors, particularly vulnerable people. The most serious hazards are called Category 1 hazards and where these exist in a home, it fails to meet the statutory minimum standard for housing in England.
2.25 In 2021, 9% of occupied dwellings in England had a HHSRS Category 1 hazard. Such hazards were more prevalent in the private rented sector (14%) than owner occupied homes (10%) and the social rented sector (4%), Annex Table 2.4 and Figure 2.7.
Figure 2.7: Homes with Category 1 hazards, by tenure, 2011 to 2021

Line chart showing the change in percentage of dwellings with a Category 1 hazard in the private rented, social rented, and owner occupied tenures from 2011 to 2021.
Base: 2011-2019, All dwellings; 2020-2021, Occupied dwellings
Notes:
1) 2020 and 2021 figures are estimated based on dwelling level modelled data
2) 2020 have been revised from extrapolated to dwelling modelled data and marked with an (R)
3) underlying data are presented in Annex Table 2.4
Sources:
2011-2019 English Housing Survey, dwelling sample
2020-2021 English Housing Survey, modelled data based on occupied dwelling sample
Damp
2.26 In 2021-22, due to COVID-19 restrictions it was not possible to collect all the detailed data required to derive key housing quality variables. As such, predictive modelled estimates at dwelling level were produced to indicate whether or not a dwelling has any type of damp. Individual types of damp could not be modelled, therefore only ‘all damp’ is presented in this report for 2021 (see the Technical report for more details).
2.27 In the English Housing Survey, a home is considered to have damp/a problem with damp if the surveyor records damp which is significant enough to be taken into consideration when making their HHSRS assessments. Therefore, minor issues of damp are not recorded and, for consistency, would not be part of the modelled data.
2.28 In 2021, 4% of occupied dwellings had a problem with damp. Between 1996 and 2019, there was a sizable reduction in the prevalence of all dwellings with any damp problems, Annex Table 2.5 and Figure 2.8.
Figure 2.8: Damp problems, 1996 to 2021
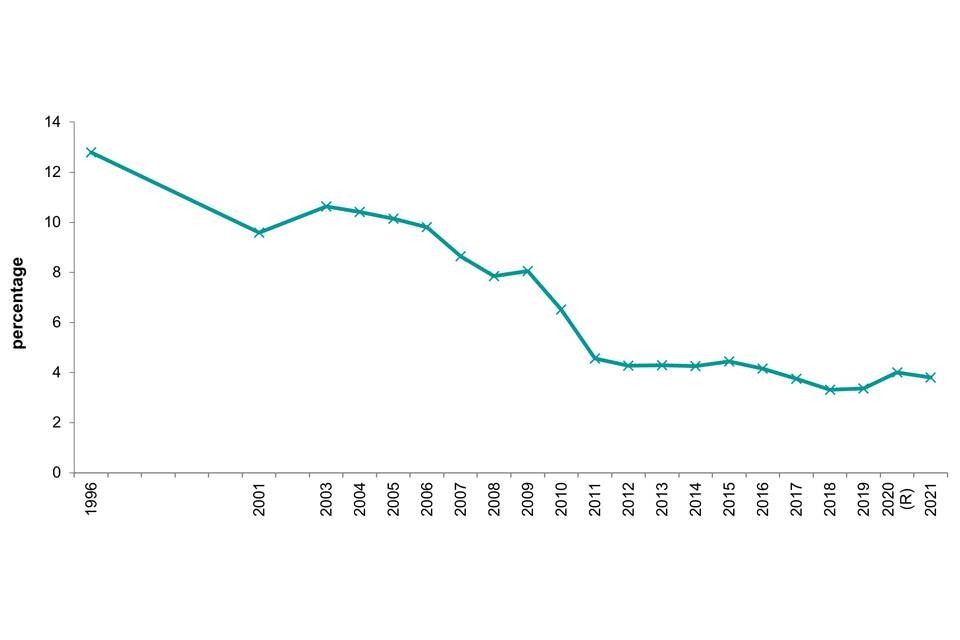
Line chart showing the change in dwellings with any damp problems from 1996 to 2021.
Base: 1996-2019, All dwellings; 2020-2021, Occupied dwellings
Notes:
1) 2020 and 2021 figures are estimated based on dwelling level modelled data
2) 2020 have been revised from extrapolated to dwelling modelled data and marked with an (R)
3) underlying data are presented in Annex Table 2.5
Sources:
1996-2007: English House Condition Survey, dwelling sample
2010-2019 English Housing Survey, dwelling sample
2020-2021 English Housing Survey, modelled data based on occupied dwelling sample
2.29 Damp was more prevalent in the private rented sector, with 11% of dwellings having a problem in 2021. In comparison just 2% of owner occupiers were estimated to have damp and 4% of social renters, Annex Table 2.6 and Figure 2.9.
Figure 2.9: Occupied dwellings with any damp problems, 2021
Bar chart comparing the percentage of owner occupied, private rented, local authority, and housing association dwellings with any damp problems.
Base: Occupied dwellings
Notes:
1) 2021 figures are estimated based on dwelling level modelled data
2) underlying data are presented in Annex Table 2.6
Source: English Housing Survey, modelled data based on occupied dwelling sample
Energy efficiency
Energy efficiency rating
2.30 The Government’s Standard Assessment Procedure (SAP) is used to monitor the energy efficiency of homes. It is an index based on calculating annual space and water heating costs for a standard heating regime and is expressed on a scale of 1 (highly inefficient) to 100 (highly efficient, with 100 representing zero energy costs). Findings presented in this report were calculated using Reduced Data SAP (RdSAP) version 9.93.
2.31 In 2021-22, due to the COVID-19 pandemic, some physical data could not be collected at all as it relies on a surveyor’s assessment of the inside of a home. Instead, respondents were asked for details of items usually captured by the survey e.g. heating systems. Where the data were missing (i.e. loft insulation present but no insulation thickness), the EHS model imputed default values, consistent with the approach used in a full survey year (see the Technical report for more details).
2.32 The energy efficiency of the English housing stock has continued to improve. In 2021, the average SAP rating of English dwellings was 66 points, up from 45 points in 1996, Annex Table 2.7. This longer-term upward trend was evident in all tenures and largely driven by improvements in the prevalence of the most common energy efficiency measures across the stock, particularly cavity wall insulation, boiler upgrades from standard to condensing combi and full double glazing.
2.33 In 2021, the social sector had the highest mean SAP rating of the tenures with housing associations and local authorities both at 70. Owner occupied dwellings averaged a rating of 66 and private rented dwellings scored the lowest at 65. This is not surprising given the age and type of dwellings in the private rented sector. The social sector contains a higher proportion of purpose built flats compared to the private sector, which have less exposed surface area (external walls and roofs) through which heat can be lost, than detached or semi-detached houses, Annex Table 2.1.
Figure 2.10: Mean SAP rating, by tenure, 1996 to 2021
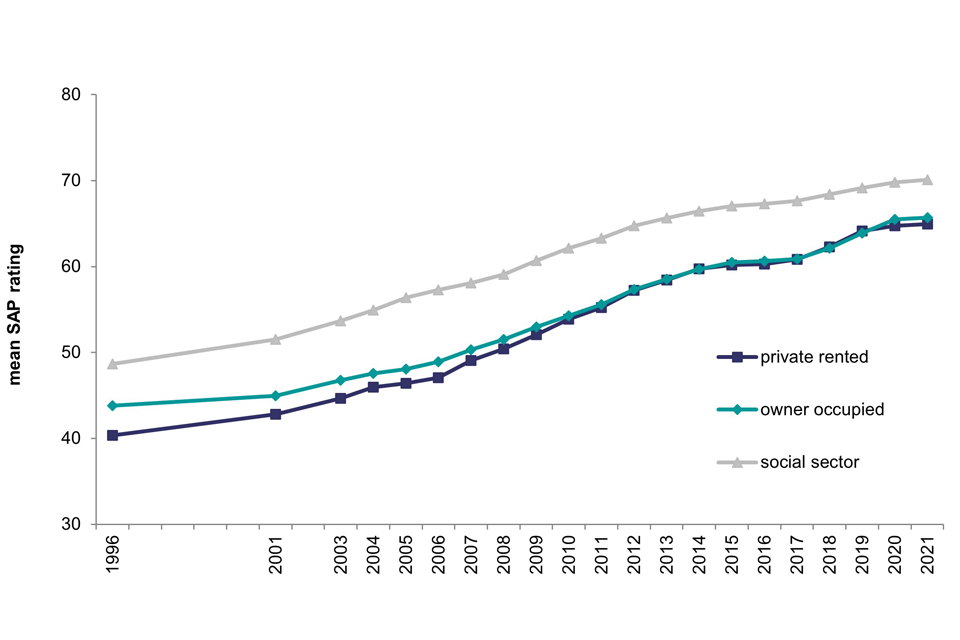
Line chart showing the change in mean SAP ratings for private rented, owner occupied, and social rented sector dwellings from 1996 to 2021.
Base: 1996-2019, All dwellings; 2020-2021, Occupied dwellings
Notes:
1) 2010-2012 uses SAP09
2) 2013-2018 uses SAP12. In 2018 RdSAP changed to version 9.93 and improvements were made to the modelling, which has led to a larger increase in the mean SAP rating compared to previous years.
3) underlying data are presented in Annex Table 2.7
Sources:
1996-2007: English House Condition Survey, dwelling sample
2008-2019: English Housing Survey, dwelling sample
2020-2021: English Housing Survey, modelled data based on occupied dwellings
2.34 The proportion of dwellings in the highest SAP energy efficiency rating (EER) bands A to C increased considerably between 2011 and 2021 from 16% to 47%. Over the same period, the proportion of dwellings in the lowest three bands (E, F and G bands) fell significantly. The percentage in band E alone dropped from 26% in 2011 to 7% in 2021. The majority of dwellings (87%) were in EER bands C and D, compared with the majority being in D and E in 2011, Annex Table 2.8.
2.35 Although the average SAP ratings for owner occupied and private rented dwellings were similar (Figure 2.10), the distribution across the EER bands varied. The most common band for owner occupiers was band D (47%) compared with 42% of private rented dwellings. Also, there were a higher proportion of dwellings in the lowest two bands in the private rented sector, (4% in F and 1 % in G) compared with the other two tenures, Figure 2.11.
Figure 2.11: Energy efficiency rating bands for occupied dwellings, by tenure, 2021

Bar chart showing the percentage of owner occupied, private rented, and social rented dwellings in each energy efficiency band.
Base: Occupied dwellings
Notes:
1) In 2018 RdSAP changed to version 9.93 and improvements were made to the modelling, which has led to a larger increase in the mean SAP rating compared to previous years
2) underlying data are presented in Annex Table 2.8
Source: English Housing Survey, dwelling sample
2.36 There are two key methods of increasing the energy efficiency of existing dwellings: upgrading the dwelling’s heating system and increasing insulation.
Heating system
2.37 Between 1996 and 2021, the proportion of dwellings with central heating as the main heating source increased from 80% to 92%. Over the same period, the proportion of dwellings using a storage heater decreased from 8% to 5%. Similarly, the proportion using a portable heater decreased (from 12% to 3%). The main heating system in properties has remained unchanged in the past 5 years, Annex Table 2.9.
2.38 In 2021, almost all local authority (97%) and owner occupied dwellings (95%) had central heating, followed by 89% of housing association dwellings and 82% of private rented homes, Annex Table 2.10.
2.39 While just 3% (or 671,000 dwellings) of all housing stock in England used a portable heater as their main heating source, this is the least cost-effective and most inefficient method of heating. More dwellings in the private rented sector used a fixed room or portable heater (7%) than those in both the social sector (1%) and owner occupied homes (2%).
2.40 Housing association dwellings were more likely to have a portable heater as the main heating source (48,000 homes) than those in local authority properties (6,000 homes), Annex Table 2.10.
2.41 Standard boilers tend to be older and less efficient than condensing boilers, which have been mandatory for new and replacement models since the mid-2000s. The proportion of dwellings with a standard boiler decreased from 9% in 2020 to 7% in 2021, while the proportion with a condensing-combination boiler has increased from 57% to 59% in the same period, reflecting the continuation of a longer-term trend, Figure 2.12 and Annex Table 2.11.
Figure 2.12: Boiler types, 1996 to 2021

Line chart of the percentage of boiler types in dwellings over time from 1996 to 2021
Base: 2011-2019, All dwellings; 2020-2021, Occupied dwellings
Notes:
1) Condensing and condensing-combination boilers were rare in 1996, so data collection did not start until 2001
2) Underlying data are presented in Annex Table 2.11
Sources:
1996-2007: English House Condition Survey, dwelling sample
2008-2019: English Housing Survey, dwelling sample
2020-2021: English Housing Survey, dwelling sample
2.42 When looking across tenures however, dwellings within the private sector are four times as likely to still have standard boilers (8%) than those in the social sector (2%). Whereas dwellings in the social sector are more likely than those in the private sector to have newer, more efficient condensing or condensing-combination boilers (82% compared to 77%), Annex Table 2.12. This may reflect the age and type of dwellings across tenures.
Insulation
2.43 The second main method of increasing a dwelling’s energy performance is by increasing or improving insulation. Standard insulation measures include cavity or solid wall insulation, loft insulation and double glazing. Installation of these measures has increased in the last 10 years.
2.44 In 2021, 87% of homes in England had full double glazing, up from 76% of homes in 2011. Just over half (52%) of dwellings had cavity or solid wall insulation (up from 43% in 2011) and 39% had 200mm or more of loft insulation (up from 30% in 2011), Figure 2.13 and Annex Table 2.13. The increase in dwellings with wall insulation is driven predominantly by an increase in cavity wall insulation. Solid wall insulation involves changing the appearance of the property and is more costly than insulating cavity walls.
Figure 2.13: Insulation measures, 2011 to 2021
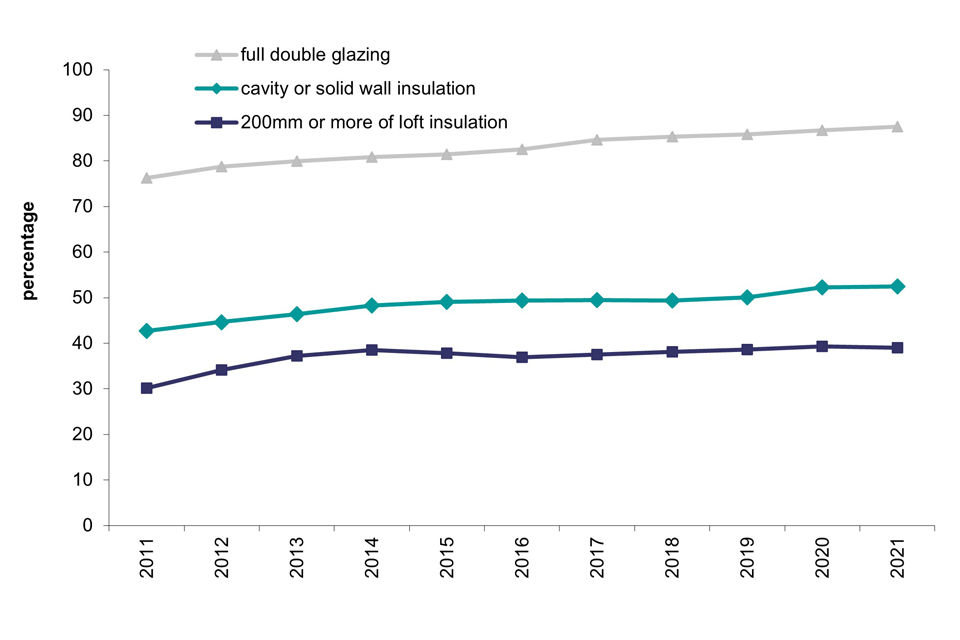
Line chart of the percentage of dwellings with insulation measures by insulation type over time from 2011 to 2021
Base: 2011-2019, All dwellings; 2020-2021, Occupied dwellings
Notes:
1) Percentages are based on all dwellings, including those with no loft or other wall type.
2) Underlying data are presented in Annex Table 2.13. See footnotes in this table for further detail on methodology for cavity and solid wall insulation.
Sources:
2011-2019: English Housing Survey, dwelling sample
2020-2021: English Housing Survey, dwelling sample
2.45 Looking at dwellings with predominantly cavity or solid walls separately, 70% of dwellings with predominantly cavity walls had insulation compared with only 11% of dwellings with predominantly solid walls, Annex Table 2.14.
2.46 Among dwellings with solid walls, the social rented sector had a higher proportion with solid wall insulation (27%) than both private rented (10%) and owner occupied dwellings (8%), Figure 2.14.
2.47 Among dwellings with cavity walls, private rented dwellings had a lower proportion of dwellings with cavity insulation (61%) than other tenures (71% of owner occupied dwellings and 77% of social rented dwellings).
2.48 Within the social sector, housing association properties were more likely to have solid walls with insulation (32%) than local authority dwellings (21%). However, the proportion of properties with cavity insulation was similar between the two tenures (both 77%).
Figure 2.14: Wall insulation in occupied dwellings, by main wall type and tenure, 2021

Bar chart of the percentage of wall insulation in occupied dwellings by main wall type and tenure in 2021
Base: occupied dwellings with predominantly cavity walls (green); occupied dwellings with predominantly solid walls (blue)
Note: underlying data are presented in Annex Table 2.14
Source: English Housing Survey, dwelling sample
Smart meters and electricity payment methods
2.49 The replacement of traditional meters with smart meters is a national infrastructure upgrade that will make the country’s energy system cheaper, cleaner and more reliable. Smart meters are the next generation of meters and offer a range of intelligent functions. For example, they can tell residents how much energy they are using in pounds and pence via an In-Home Display. This information helps customers manage their energy use, save money and reduce emissions. Smart meters communicate automatically with energy suppliers, which avoids manual meter reads and provides customers with accurate bills.
2.50 The English Housing Survey asks residents whether they have a smart meter. Previously the presence of gas and electricity smart meters was reported on in the Headline Report, however due to COVID-19 the surveyor was unable to carry out an assessment of the inside of a home, therefore this section of the report is based on the resident being asked whether they have a smart meter in their home and particularly focusses on electricity meters only.
2.51 In 2021-22, almost half of households in England reported having an electricity smart meter (45%)[footnote 10], Annex Table 2.15.
2.52 Owner occupiers and social renters were more likely to report having an electricity smart meter (47% and 48% respectively) compared to private renters (36%), Figure 2.15.
Figure 2.15: Electricity smart meters, 2021-22

Bar chart of the percentage of households with electricity smart meters by tenure in 2021-22
Base: all households
Notes:
1) self reported presence of electric smart meters
2) underlying data are presented in Annex Table 2.15
Source: English Housing Survey, full household
2.53 Residents who paid for their electricity by direct debit (46%), or pre-payment token (45%) were more likely to report having an electricity smart meter than residents who paid on receipt of the bill (39%) or other methods (29%) e.g. included in the rent, fixed annual bill.
Subjective overheating
2.54 The English Housing Survey includes a subjective measure for gauging whether residents feel that any part of their home gets uncomfortably hot and, if so, which parts. The EHS also collects data on the potential risk of harm from excessively high indoor temperatures as part of the HHSRS, though, due to the small numbers of dwellings meeting this threshold these figures are not reported here.
2.55 In 2021, 9% of residents reported that at least one part of their home got uncomfortably hot. Those in the private sector (10%) were more likely to report that at least part of their home got uncomfortably hot than those in the social sector (7%). Additionally, a higher percentage of those in detached houses (11%) reported overheating in their homes, compared with only 7% in small terraced houses and 9% in low-rise flats, Annex Table 2.16.
2.56 Residents in newer homes were more likely to report overheating than those in older homes. Older homes can be more difficult and costly to insulate compared to new homes. In 2021, 11% of residents in homes built from 2003 onwards and 12% of those in homes built between 1991 and 2002 reported that at least one part of their home got uncomfortably hot. Significantly higher than those in homes built between 1919 and 1944 (7%) and 1945 and 1964 (9%).
Smoke and carbon monoxide alarms
Smoke alarms
2.57 In 2021-22, 93% of households had at least one working smoke alarm. The proportion of households with working smoke alarms varied by tenure. Social renters were most likely to have at least one working smoke alarm (96%), compared with 93% of owner occupiers, and 93% of private renters, Annex Table 2.17 and Figure 2.16.
2.58 Between 2011-12 and 2021-22, the proportion of households with a working smoke alarm increased from 87% to 93%.
Figure 2.16: Households with at least one working smoke alarm, by tenure, 2008-09 to 2021-22

Line chart of the percentage of households with at least one working smoke alarm by tenure over time from 2008-09 to 2021-22
Base: all households
Notes:
1) data was not collected in 2009-10
2) underlying data are presented in Annex Table 2.17
Source: English Housing Survey, full household
2.59 While the proportion of households with smoke alarms has increased over the last decade, over a fifth of households (21%) reported that they had never tested their smoke alarm, Annex Table 2.18[footnote 11] .
2.60 In 2021-22, 27% of private renters and 27% of social renters reported that they had never tested their smoke alarm, higher than the proportion of owner occupiers who had never tested their smoke alarm (17%).
Carbon monoxide alarms
2.61 These data have been modelled due to the restrictions of COVID-19. Instead, figures for this measure have been extrapolated from previous EHS trends (see the Technical report for more details).
2.62 In 2021, 47% of all dwellings had a carbon monoxide alarm, Annex Table 2.19.
2.63 Of dwellings with a solid fuel burning appliance, such as a coal fire or wood burning stove, 54% had a carbon monoxide alarm, whereas 46% of dwellings with no solid fuel appliance had an alarm.
Technical notes
1. Results for the first section of this report, on households, are presented for ‘2021-22’ and are based on fieldwork carried out between April 2021 and March 2022 on a sample of 9,752 households. Throughout the report, this is referred to as the ‘full household sample’.
2. Results in the second section of the report, which relate to the physical dwelling, are presented for ‘2021’ and are based on fieldwork carried out between April 2020 and March 2022 (a mid-point of April 2020). The sample comprises 10,572 occupied dwellings only where a physical inspection was carried out. Due to COVID-19 restrictions, the sample does not include vacant dwellings, where in previous years it did. Throughout the report, this is referred to as the ‘dwelling sample’.
3. In a normal year, the dwelling sample is based on data collected by a qualified surveyor in the home. Due to COVID-19 restrictions in 2020-21 and 2021-22 it was not possible to collect data in this way. Internal inspections of properties were instead replaced with external inspections, where the inspection was restricted to an assessment of the exterior of the dwelling and supplemented by information about the interior of the dwelling that the surveyor collected (socially distanced) at the doorstep. There were also some data we were unable to collect at all, in which case predictive modelled estimates at dwelling level were produced to supplement the ‘external plus’ inspection and indicate whether or not a dwelling: had damp problems; had any Category 1 hazards assessed through the Housing Health and Safety Rating System (HHSRS); or met the Decent Homes Standard.
4. The reliability of the results of sample surveys, including the English Housing Survey, is positively related to the unweighted sample size. Results based on small sample sizes should therefore be treated as indicative only because inference about the national picture cannot be drawn. To alert readers to those results, percentages based on a row or column total with unweighted total sample size of less than 30 are italicised. To safeguard against data disclosure, the cell contents of cells where the cell count is less than 5 are replaced with a “u”.
5. Where comparative statements have been made in the text, these have been significance tested to a 95% confidence level. This means we are 95% confident that the statements we are making are true.
6. Additional annex tables, including the data underlying the figures and charts in this report are published on the English Housing Survey page alongside many supplementary live tables, which are updated each year but are too numerous to include in our reports.
7. A more thorough description of the English Housing Survey methodology is provided in the Technical Report which is published annually . The 2020-21 Technical Report includes further details of the impact the COVID-19 on the 2020-21 survey. A full account of data quality procedures followed to collect and analyse English Housing Survey data can be found in the Quality Report, which is also updated and published annually .
Glossary
Arrears: If the HRP or partner are not up to date with rent or mortgage payments they are considered to be in arrears.
Bedroom standard: The ‘bedroom standard’ is used by government as an indicator of occupation density. A standard number of bedrooms is calculated for each household in accordance with its age/sex/marital status composition and the relationship of the members to one another. A separate bedroom is allowed for each married or cohabiting couple, any other person aged 21 or over, each pair of adolescents aged 10-20 of the same sex, and each pair of children under 10. Any unpaired person aged 10-20 is notionally paired, if possible, with a child under 10 of the same sex, or, if that is not possible, he or she is counted as requiring a separate bedroom, as is any unpaired child under 10.
This notional standard number of bedrooms is then compared with the actual number of bedrooms (including bed-sitters) available for the sole use of the household, and differences are tabulated. Bedrooms converted to other uses are not counted as available unless they have been denoted as bedrooms by the respondents; bedrooms not actually in use are counted unless uninhabitable.
Households are said to be overcrowded if they have fewer bedrooms available than the notional number needed. Households are said to be under-occupying if they have two or more bedrooms more than the notional needed.
Boiler type: The report covers a number of boiler types:
- standard: provides hot water or warm air for space heating with the former also providing hot water via a separate storage cylinder.
- back: located behind a room heater and feeds hot water to a separate storage cylinder. They are generally less efficient than other boiler types.
- combination: provides hot water or warm air for space heating and can provide hot water on demand negating the need for a storage cylinder, therefore requiring less space.
- condensing: standard and combination boilers can also be condensing. A condensing boiler uses a larger, or dual, heat exchanger to obtain more heat from burning fuel than an ordinary boiler, and is generally the most efficient boiler type.
Damp (condensation and mould): In 2020-21 and 2021-22, COVID-19 restrictions prevented surveyors from completing an assessment of the inside of homes. As such, the statistics on damp are based on modelled data (see the Technical report for more details).
Decent home: Decent Homes statistics are based on modelled data due to COVID-19 restrictions preventing surveyors from entering homes (see the Technical report for more details). A home that meets all of the following four criteria:
- it meets the current statutory minimum standard for housing as set out in the Housing Health and Safety Rating System (HHSRS – see below).
- it is in a reasonable state of repair (related to the age and condition of a range of building components including walls, roofs, windows, doors, chimneys, electrics and heating systems).
- it has reasonably modern facilities and services (related to the age, size and layout/location of the kitchen, bathroom and WC and any common areas for blocks of flats, and to noise insulation).
- it provides a reasonable degree of thermal comfort (related to insulation and heating efficiency).
The detailed definition for each of these criteria is included in A Decent Home: Definition and guidance for implementation, Ministry of Housing, Communities and Local Government, June 2006.
Dependent children: Any person aged 0 to 15 in a household (whether or not in a family) or a person aged 16 to 18 in full-time education and living in a family with his or her parent(s) or grandparent(s). It does not include any people aged 16 to 18 who have a spouse, partner or child living in the household.
Double glazing: This covers factory made sealed window units only. It does not include windows with secondary glazing or external doors with double or secondary glazing (other than double glazed patio doors, which are surveyed as representing two windows).
Dwelling: A unit of accommodation which may comprise one or more household spaces (a household space is the accommodation used or available for use by an individual household). A dwelling may be classified as shared or unshared. A dwelling is shared if:
- the household spaces it contains are ‘part of a converted or shared house’, or
- not all of the rooms (including kitchen, bathroom and toilet, if any) are behind a door that only that household can use, and
- there is at least one other such household space at the same address with which it can be combined to form the shared dwelling.
Dwellings that do not meet these conditions are unshared dwellings.
The EHS definition of dwelling is consistent with the Census 2011.
Dwelling age: The date of construction of the oldest part of the building.
Dwelling type: Dwellings are classified, on the basis of the surveyor’s inspection, into the following categories:
- small terraced house: a house with a total floor area of less than 70m² forming part of a block where at least one house is attached to two or more other houses. The total floor area is measured using the original EHS definition of usable floor area, used in EHS reports up to and including the 2012 reports. That definition tends to yield a smaller floor area compared with the definition that is aligned with the Nationally Described Space Standard and used on the EHS since 2013. As a result of the difference between the two definitions, some small terraced houses are reported in the 2014 Housing Supply Report as having more than 70m².
- medium/large terraced house: a house with a total floor area of 70m² or more forming part of a block where at least one house is attached to two or more other houses. The total floor area is measured using the original EHS definition of usable floor area which tends to yield a small floor area compared with the definition used on the EHS since 2013.
- end terraced house: a house attached to one other house only in a block where at least one house is attached to two or more other houses.
- mid terraced house: a house attached to two other houses in a block.
- semi-detached house: a house that is attached to just one other in a block of two.
- detached house: a house where none of the habitable structure is joined to another building (other than garages, outhouses etc.).
- bungalow: a house with all of the habitable accommodation on one floor. This excludes chalet bungalows and bungalows with habitable loft conversions, which are treated as houses.
- converted flat: a flat resulting from the conversion of a house or former non-residential building. Includes buildings converted into a flat plus commercial premises (such as corner shops).
- purpose built flat, low rise: a flat in a purpose built block less than six storeys high. Includes cases where there is only one flat with independent access in a building which is also used for non-domestic purposes.
- purpose built flat, high rise: a flat in a purpose built block of at least six storeys high.
Economic status: Respondents self-report their situation and can give more than one answer.
- working full-time/part-time: full-time work is defined as 30 or more hours per week. Part-time work is fewer than 30 hours per week. Where more than one answer is given, ‘working’ takes priority over other categories (with the exception that all those over State Pension Age (SPA) who regard themselves as retired are classified as such, regardless of what other answers they give).
- unemployed: this category covers people who were registered unemployed or not registered unemployed but seeking work.
- retired: this category includes all those over the state pension age who reported being retired as well as some other activity. For men the SPA is 65 and for women it is 60 if they were born before 6th April 1950. For women born on or after the 6th April 1950, the state pension age has increased incrementally since April 2010.
- full-time education: education undertaken in pursuit of a course, where an average of more than 12 hours per week is spent during term time.
- other inactive: all others; they include people who were permanently sick or disabled, those looking after the family or home and any other activity.
On occasions, full-time education and other inactive are combined and described as other economically inactive.
Energy efficiency rating (EER, also known as SAP rating): A dwelling’s energy costs per m2 of floor area for standard occupancy of a dwelling and a standard heating regime and is calculated from the survey using a simplified form of SAP. The energy costs take into account the costs of space and water heating, ventilation and lighting, less cost savings from energy generation technologies. They do not take into account variation in geographical location. The rating is expressed on a scale of 1-100 where a dwelling with a rating of 1 has poor energy efficiency (high costs) and a dwelling with a rating of 100 represents zero net energy cost per year. It is possible for a dwelling to have an EER/SAP rating of over 100 where it produces more energy than it consumes, although such dwellings will be rare within the English housing stock.
The detailed methodology for calculating SAP to monitor the energy efficiency of dwellings was updated in 2012 to reflect developments in the energy efficiency technologies and knowledge of dwelling energy performance. These changes in the SAP methodology were relatively minor compared with previous SAP methodology updates in 2005 and 2009. It means, however that a SAP rating using the 2009 method is not directly comparable to one calculated under the 2012 methodology, and it would be incorrect to do so. All SAP statistics used in reporting from 2013 are based on the SAP 2012 methodology and this includes time series data from 1996 to the current reporting period (i.e. the SAP 2012 methodology has been retrospectively applied to 1996 and subsequent survey data to provide consistent results in the 2013 and following reports).
Energy efficiency rating (EER)/SAP bands: The 1-100 EER/SAP energy efficiency rating is also presented in an A-G banding system for an Energy Performance Certificate, where Band A rating represents low energy costs (i.e. the most efficient band) and Band G rating represents high energy costs (the least efficient band). The break points in SAP (see below) used for the EER Bands are:
- Band A (92–100)
- Band B (81–91)
- Band C (69–80)
- Band D (55–68)
- Band E (39–54)
- Band F (21–38)
- Band G (1–20)
Ethnicity: Classification according to respondents’ own perceived ethnic group.
First time buyer: First time buyers are defined as households that have purchased a property that is their main home in the last three years, and in which neither the HRP or partner have previously owned a property. It includes households who have purchased their property outright as well as those who are buying with the help of a mortgage or loan.
Gross income of the HRP and partner: The gross annual income of the HRP and partner from wages, pensions, other private sources, savings and state benefits. This does not include any housing related benefits or allowances. This measure is divided by 52 to calculate weekly income. Income is presented in quintiles throughout this report (see income quintiles definition – below).
Gross household income: The gross annual income of all adults living in a household from wages, pensions, other private sources, savings and state benefits. This does not include any housing related benefits or allowances. This measure is divided by 52 to calculate weekly income. Income is presented in quintiles throughout this report (see income quintiles definition – below).
Heating system: There are three main types of heating covered in this report:
- central heating system: most commonly a system with a gas fired boiler and radiators which distribute heat throughout the dwelling (but also included in this definition are warm air systems, electric ceiling/underfloor and communal heating). It is generally considered to be a cost effective and relatively efficient method of heating a dwelling. Communal systems use heat generated in a centralized location for residential space and water heating. This could be from: a central boiler using any fuel which supplies a number of dwellings; waste heat from power stations distributed through community heating schemes; or heat from a local CHP (combined heat and power) system.
- storage heaters: predominately used in dwellings that have an off-peak electricity tariff. Storage heaters use off-peak electricity to store heat in clay bricks or a ceramic material, this heat is then released throughout the day. However, storage heating can prove expensive if too much on peak electricity is used during the day.
- room heaters: this category includes all other types of heaters such as fixed gas, fixed electric or portable electric heaters. This type of heating is generally considered to be the least cost effective of the main systems and produces more carbon dioxide emissions per kWh.
Household: One person or a group of people (not necessarily related) who have the accommodation as their only or main residence, and (for a group) share cooking facilities and share a living room or sitting room or dining area.
The EHS definition of household is slightly different from the definition used in the 2011 Census. Unlike the EHS, the 2011 Census did not limit household membership to people who had the accommodation as their only or main residence. The EHS included that restriction because it asks respondents about their second homes, the unit of data collection on the EHS, therefore, needs to include only those people who have the accommodation as their only or main residence.
Household reference person (HRP): The person in whose name the dwelling is owned or rented or who is otherwise responsible for the accommodation. In the case of joint owners and tenants, the person with the highest income is taken as the HRP. Where incomes are equal, the older is taken as the HRP. This procedure increases the likelihood that the HRP better characterises the household’s social and economic position. The EHS definition of HRP is not consistent with the Census 2011, in which the HRP is chosen on basis of their economic activity. Where economic activity is the same, the older is taken as HRP, or if they are the same age, HRP is the first listed on the questionnaire.
Household type: The main classification of household type uses the following categories; some categories may be split or combined in different tables:
- couple no dependent child(ren)
- couple with dependent child(ren)
- couple with dependent and independent child(ren)
- couple with independent child(ren)
- lone parent with dependent child(ren)
- lone parent with dependent and independent child(ren)
- lone parent with independent child(ren)
- two or more families
- lone person sharing with other lone persons
- one male
- one female
Housing Benefit: A benefit that is administered by local authorities, which is designed to assist people who rent their homes and have difficulty meeting their housing costs. Council tenants on Housing Benefit receive a rent rebate which means that their rent due is reduced by the amount of that rebate. Private and social housing tenants usually receive Housing Benefit (or rent allowance) personally, although sometimes it is paid direct to the landlord.
Housing support: a means tested welfare benefit that can help those who are unemployed, on a low income, or receiving other benefits pay their rent (and some service charges if the landlord is a Housing Association or Local Authority). Housing support includes all housing related benefits, such as Housing Benefit or the housing element of Universal Credit.
Housing Health and Safety Rating System (HHSRS): A risk assessment tool used to assess potential risks to the health and safety of occupants in residential properties in England and Wales. It replaced the Fitness Standard in April 2006.
In 2020-21 and 2021-22, COVID-19 restrictions prevented surveyors from completing an assessment of the inside of homes. As such, the statistics on HHSRS are based on modelled data (see the Technical report for more details).
The purpose of the HHSRS assessment is not to set a standard but to generate objective information in order to determine and inform enforcement decisions. There are 29 categories of hazard, each of which is separately rated, based on the risk to the potential occupant who is most vulnerable to that hazard. The individual hazard scores are grouped into 10 bands where the highest bands (A-C representing scores of 1,000 or more) are considered to pose Category 1 hazards. Local authorities have a duty to act where Category 1 hazards are present, and may take into account the vulnerability of the actual occupant in determining the best course of action.
For the purposes of the decent homes standard, homes posing a Category 1 hazard are non-decent on its criterion that a home must meet the statutory minimum requirements.
The EHS is not able to replicate the HHSRS assessment in full as part of a large scale survey. Its assessment employs a mix of hazards that are directly assessed by surveyors in the field and others that are indirectly assessed from detailed related information collected. For 2006 and 2007, the survey (the then English House Condition Survey) produced estimates based on 15 of the 29 hazards. From 2008, the survey is able to provide a more comprehensive assessment based on 26 of the 29 hazards. See the EHS Technical Note on Housing and Neighbourhood Conditions for a list of the hazards covered.
Income quintiles: All households are divided into five equal groups based on their income (i.e. those in the bottom 20%, the next 20% and so on). These groups are known as quintiles. These can be used to compare income levels of particular groups to the overall population.
Insulation: There are two main types of insulation covered in this report:
- wall insulation
cavity walls: where a dwelling has external walls of predominantly cavity construction, it is defined as having cavity wall insulation if at least 50% of the cavity walls are filled with insulation. This could have been fitted during construction or retrospectively injected between the masonry leaves of the cavity wall.
solid walls: where a dwelling has external walls of predominantly masonry solid construction, it is defined as having solid wall insulation if at least 50% of the solid walls are fitted with insulation. This could be applied either externally (e.g. insulated board attached to the external face with a render finish) or internally (e.g. insulated plasterboard fitted to the external walls inside each room, with a plaster finish).
other walls: these are any dwellings with predominantly non-cavity or masonry solid walls (e.g. timber, metal or concrete frames). If at least 50% of the walls are fitted with insulation, the dwelling is defined as having other wall insulation.
- loft insulation: the presence and depth of loft insulation is collected for all houses and top-floor flats. Insulation could be found between joists above the ceiling of the top floor of the dwelling or between the roof timbers where the loft has been converted to a habitable space. Where insulation could not be observed, information was taken from the householder or from imputed estimates based on the age and type of the dwelling.
Insulation – new cavity wall insulation variable: For the 2015 Headline Report, the English Housing Survey introduced a new measure of cavity wall insulation (variable wins95x). This new measure incorporates more up-to-date information regarding the insulation of buildings built since 1991 and aligns the English Housing Survey methodology to a common method for calculating energy efficiency of buildings.
In compliance with new Building Regulations, an increasing proportion of dwellings built in 1991 or after with cavity walls had insulation fitted at the time of construction (known as ’as built‘ cavity wall insulation), although compliance could also be achieved through other techniques. The non-intrusive survey undertaken in the EHS would not always be able to identify as built insulation, and the Survey has to assume that these properties have insulation. To align with current RdSAP methodology and to improve our methodology, the English Housing Survey has for 2015 data introduced a new variable, which assumes that properties built in 1995 or after has as built insulation. This is the assumption used in the RdSAP model, which in turn reflects that cavity wall insulation was not used as often as previously thought to comply with the new Building Regulations in the early 1990s.
In the earlier variable (wins90x), properties built in 1991 or after were assumed to be insulated, as it was thought builders used cavity wall insulation to comply with the new Building Regulations. Due to changes in data collection the new variable can only be taken back to 2008. Trends from earlier reports hold, though the exact numbers produced by the new variable are lower (as properties built in 1991 up to 1995 without evidence of retrofitted cavity wall insulation are no longer assumed to be insulated).
Loneliness: Respondents are asked how often they feel lonely, with the response options, ‘Often or Always’, ‘Some of the time’, ‘Occasionally’, ‘Hardly ever’, ‘Never’.
New household: Where neither the household reference person (HRP) nor their spouse/partner occupied the HRP’s previous permanent accommodation, in either of their names. The EHS does not differentiate between previous accommodation within England and outside of England (including abroad).
Non-dependent children: any person aged over 18 or those aged 16-18 who are not in full-time education living in a family with his or her parent(s) or grandparent(s).
Overcrowding: Households are said to be overcrowded if they have fewer bedrooms available than the notional number needed according to the bedroom standard definition. See bedroom standard.
Plot: The EHS records a number of details relating to the land immediately surrounding a dwelling, referred to as the dwelling’s plot. The plot may be private (exclusive access) or shared (shared access, for example where a block of flats have a shared garden). The plot may consist of hard landscaping (e.g. concrete, tarmac, paving, gravel), soft landscaping (e.g. lawn, flower/vegetable beds), or a combination.
Private accommodation: The majority of homes in all three tenures, excluding hotels, bed and breakfast accommodation and institutional residences such as student halls, army barracks and care homes. The EHS only covers private accommodation.
Size: The total usable internal floor area of the dwelling as measured by the surveyor, rounded to the nearest square metre. It includes integral garages and integral balconies but excludes stores accessed from the outside only, the area under partition walls and the stairwell area.
Standard Assessment Procedure (SAP): The Standard Assessment Procedure (SAP) is the methodology used by the Government to assess and compare the energy and environmental performance of dwellings. The SAP is used to calculate the energy efficiency rating (EER) of dwellings, also known as the SAP rating. The EER is an index based on calculated energy costs for a standard heating regime and is expressed on a scale of 1 (highly inefficient) to 100 (highly efficient with 100 representing zero energy cost). It is possible for a dwelling to have a rating of over 100 where it produces more energy than it consumes, although such dwellings will be rare within the English housing stock.
Reduced Data SAP (RdSAP) was introduced in 2005 as a lower cost method of assessing the energy performance of existing dwellings. RdSAP is used in the calculation of the energy ratings on the Energy Performance Certificate, a document which is required every time a home is put up for sale or rent. Since the 2015 survey, the EHS has provided a number of indicators on energy performance calculated using an approach which is in line with RdSAP 2012 version 9.92, since then a newer version has been released (version 9.93). In 2018 the methodology moved to using RdSAP version 9.93, which includes updated U-Values for cavity, solid and stone walls, both insulated and uninsulated, between age bands A and E. In addition to this methodological change, there have also been a number of improvements made to the energy model, such as aligning the calculation of ventilation parameters with RdSAP conventions and incorporating more detailed data into the modelling of water heating parameters. These updates were applied to dwellings from the 2018/19 EHS survey, making the 2019 combined year dataset the first dataset with these changes applied to both years. As such the full effect of this is seen in 2019 and is estimated to increase SAP by 0.7 SAP points, compared to 2017.
Social housing rents: Most social housing rents are calculated according to ‘rent restructuring’ policy, introduced in 2001. The overall intention of the policy was that similar properties in similar areas should have similar levels of rents. The formula calculates rents for each individual property based on 30% of the relative property values at 1999 levels, 70% on relative local earnings and the size of the property. The formula rent had been increased annually at the rate of Retail Price Index inflation at the previous September + 0.5% until 2015-16 when it was increased by CPI +1%.
In 2012, the government introduced Affordable Rent as another main type of social housing rents, which can be set at up to 80% of the market rate of the property, inclusive of service charges.
Between 2016-17 and 2019-20, social housing rents will be reduced by 1% a year, for 4 years except from supported housing, almshouses, community land trusts and fully mutual housing co-ops which will be excepted during the first year.
There is also a different arrangement for rents for intermediate rent properties (which falls within the statutory definition of social housing).
Tenure: In this report, households are typically grouped into three broad categories known as tenures: owner occupiers, social renters and private renters. The tenure defines the conditions under which the home is occupied, whether it is owned or rented, and if rented, who the landlord is and on what financial and legal terms the let is agreed.
- owner occupiers: households in accommodation which they either own outright, are buying with a mortgage or as part of a shared ownership scheme.
- social renters: this category includes households renting from Local Authorities (including Arms’ Length Management Organisations (ALMOs) and Housing Action Trusts) and Housing Associations, Local Housing Companies, co-operatives and charitable trusts.
A significant number of Housing Association tenants wrongly report that they are Local Authority tenants. The most common reason for this is that their home used to be owned by the Local Authority, and although ownership was transferred to a Housing Association, the tenant still reports that their landlord is the Local Authority. There are also some Local Authority tenants who wrongly report that they are Housing Association tenants. Data from the EHS for 2008-09 onwards incorporate a correction for the great majority of such cases in order to provide a reasonably accurate split of the social rented category.
- private renters: this sector covers all other tenants including all whose accommodation is tied to their job. It also includes people living rent-free (for example, people living in a flat belonging to a relative).
Under-occupation: Households are said to be under-occupying their property if they have two or more bedrooms more than the notional number needed according to the bedroom standard definition. See bedroom standard.
Usable floor area: The total usable internal floor area of the dwelling as measured by the surveyor, rounded to the nearest square metre.
For previous years a new modelling approach adopted since the 2013 report used assumptions aligned with the Nationally Described Space Standard which was published as part of the Housing Standards Review. It excludes integral garages, balconies, stores accessed from the outside only and the area under external walls. The area remaining represents the total of all room areas, hallways and circulation space including cupboards and stairs. The area under internal partition walls is also included. Loft space is not included unless the loft is habitable, with a fixed stair in place to access it. Dwellings are also grouped into the following five categories:
- less than 50m2
- 50 to 69m2
- 70 to 89m2
- 90 to 109m2
- 110m2 or more.
Vacant dwellings: The assessment of whether or not a dwelling is vacant is made at the time of the interviewer’s visit. In 2020-21 and 2021-22, due to COVID-19 restrictions, interviewers did not visit addresses and therefore could not identify which were vacant. Where statistics have been modelled e.g. decent homes, vacant dwellings have been included in the modelling.
Well-being: There are four measures of personal well-being in the EHS, to which respondents are asked to give their answers on a scale of 0 to 10 where 0 is ‘not at all’ and 10 is ‘completely’.
- Overall, how satisfied are you with your life nowadays?
- Overall, to what extent do you feel the things you do in your life are worthwhile?
- Overall, how happy did you feel yesterday?
- Overall, how anxious did you feel yesterday?
-
First time buyers are households that have purchased a property that is their main home in the last three years. A three year threshold is used to ensure that the sample is large enough for analysis. ↩
-
Cases where the respondent paid a deposit amount of 0% or 100% of their purchase price have been excluded. ↩
-
There are differences in the methodology of the English Housing Survey compared with ONS experimental quarterly Index of Private Housing Rental Prices (IPHRP). The English Housing Survey average weekly private rents over time reflect changes in price, quality and composition of the private rented stock. In contrast, the IPHRP specifically excludes both changes in composition and quality to ensure only pure price change is captured. See: Index of Private Housing Rental Prices, UK Statistical bulletins for more information. ↩
-
Due to a change in question wording in 2021-22, the findings are not comparable to previous years. ↩
-
Benefit receipt is reported on a household level, and households will be counted as in receipt of benefit if at least one person in the household receives support for housing costs. More than one person in the household could be in receipt of support. EHS figures may differ from those published by the Department of Work and Pensions, because we define households differently. For more information, please see the Glossary. ↩
-
The 674,000 moves into and within the owner occupied sector represent only household moves, and do not capture buy-to-let or second home purchases, property transfer transactions or sitting tenant purchases (such as through Right to Buy). ↩
-
These questions are the standard well-being questions developed by the Office for National Statistics (ONS) for the Measuring National Well-being Programme which aims to produce accepted and trusted measures on well-being in the UK. See ONS: Well-being for further information. ↩
-
This loneliness question is from the National Indicators of Loneliness and is a standard question used to measure loneliness. ↩
-
See Live tables on dwelling stock (including vacants) Table 119: stock of non-decent homes England 2001-2022 for further details. ↩
-
The EHS results are broadly in line with smart meter statistics from the Department for Business, Energy and Industrial Strategy (BEIS). Differences between EHS and BEIS statistics are likely to reflect the different time periods for data collection. ↩
-
This was explored in more detail in the 2014-15 Smoke Alarms in English Homes Report. ↩