Energy Performance of Buildings Certificates Statistical Release: October to December 2022 England and Wales
Published 26 January 2023
Applies to England and Wales

© Crown copyright 2023
This publication is licensed under the terms of the Open Government Licence v3.0 except where otherwise stated. To view this licence, visit nationalarchives.gov.uk/doc/open-government-licence/version/3 or write to the Information Policy Team, The National Archives, Kew, London TW9 4DU, or email: psi@nationalarchives.gov.uk.
Where we have identified any third party copyright information you will need to obtain permission from the copyright holders concerned.
This publication is available at https://www.gov.uk/government/statistics/energy-performance-of-building-certificates-in-england-and-wales-october-to-december-2022/energy-performance-of-buildings-certificates-statistical-release-october-to-december-2022-england-and-wales
Date of next publication: It is expected that Energy Performance of Buildings Certificates Statistics: January to March 2023 England and Wales will be published on 27 April 2023.
Key statistics
England and Wales
In the quarter October to December 2022, 438,000 Energy Performance Certificates (EPCs) were lodged on the Energy Performance of Buildings Register in England and Wales, a 6% increase compared to the same quarter 2021.
England
In October to December 2022, 388,000 domestic EPCs were lodged on the Register, an increase of 4% on the same quarter in 2021.
The number of EPCs for new dwellings (66,000) increased by 9% while the number of existing domestic EPCs (321,000) increased by 4% compared to the same quarter last year.
In the 12 months to December 2022, 253,000 EPCs were lodged for new build dwellings, an increase of 4% on the previous year.
From October to December 2022, 87% of new properties were given an A or B rating, an increase from 84% in the same quarter in 2021.
In quarter 4 2022, the region with the largest increase in EPCs lodged for new dwellings compared to the same quarter in 2021 was in the East of England (23%), while the largest decrease was in Yorkshire and The Humber (-1%).
Wales
In October to December 2022, 18,000 EPCs were lodged on the Register covering domestic dwellings. This is a decrease of 6% compared to the same quarter in 2021.
Of the 18,000 domestic properties lodged, 16,000 were for existing properties, a 9% decrease, while 2,000 were for new properties (including new builds, conversions and change of use), a 20% increase.
From October to December 2022, 83% of new domestic properties received an energy efficiency rating of A (the highest) or B, whilst only 14% received a rating of C or D.
In quarter 4 2022, the largest increases in EPCs lodged for new dwellings compared to the same quarter in 2021, was in Wrexham (169%) and Bridgend (139%), while the largest decrease was in Denbighshire (-60%).
Introduction
This statistical release presents Experimental Official Statistics based on Energy Performance Certificates (EPCs) issued for domestic and non-domestic buildings and Display Energy Certificates (DECs) issued for buildings occupied by public authorities. The certificates are lodged on the Energy Performance of Buildings Register (The Register) for England and Wales.
Through most of the release, the figures have been split into England only and Wales only. If England and Wales combined figures are required, they are available in the ‘live’ tables published alongside this release. Throughout the report, numbers have been rounded to the nearest thousand. Percentage changes have been calculated using unrounded figures. Due to rounding, individual figures may not add up to the total.
Energy Performance Certificates
An Energy Performance Certificate (EPC) indicates the energy efficiency of a building. The assessments are banded from A to G, where A (or A+ for non-domestic properties) is the most efficient in terms of likely fuel costs and carbon dioxide emissions. An EPC is required when a building is constructed, sold, or let and if a valid certificate is not already in place. The purpose of an EPC is to show prospective tenants or buyers the energy efficiency of the property. The requirement for EPCs was introduced in phases and fully implemented for all properties by autumn 2008. EPCs are valid for 10 years.
Experimental Official Statistics
Experimental Official Statistics are defined in the Code of Practice for Statistics as “new official statistics undergoing evaluation”. They are published in order to involve users and stakeholders in their development and as a means to build in quality at an early stage.
These statistics are based on information from EPCs lodged on the Register. This administrative data is subject to continuing quality assurance and improvement (see Technical Notes on Data Quality). They have been released because they have been judged to be of immediate value to interested parties and to encourage user feedback.
Display Energy Certificates
A Display Energy Certificate (DEC) is only required for buildings occupied by public authorities over 250 square meters where that building is frequently visited by the public.
DECs show the actual energy consumption of a building and are accompanied by reports which provide recommendations on potential energy saving measures. DECs last for one year for buildings with a total useful floor area more than 1,000 square metres, or 10 years when the total useful floor area is over 250 square metres and up to 1,000 square metres.
DECs that can be identified as ‘voluntary’ - some private sector organisations may choose to have a DEC even though they are not mandated by the regulations - may affect statistical and data outputs. Therefore, ‘voluntary DECs are excluded from the published dataset.
Coverage
The Register does not hold records for all dwellings in England and Wales, as not every dwelling has an EPC (these are only required when a dwelling is constructed, sold or let).
Some dwellings may have changed tenure since the date of their latest EPC. For instance, dwellings that had an EPC for reasons other than being let may have since entered the private or social rented sector.
ONS have led on an exploratory look at the EPC data comparing with Valuation Office Agency (VOA) council tax data to determine the coverage of EPCs across England and Wales. Based on their analysis EPCs cover around 60% of the housing stock in England and just less than 60% in Wales. There is a similar proportion across all regions in England.
How the data should be used
How the data should be used
- To evaluate trends in the energy performance of buildings in England and Wales that have had an Energy Performance Certificate (EPC)
- To assess changes in the number of EPCs between the same quarters across years e.g. Q4 2021 and Q4 2020
- As an early indication of new housing supply
How the data should not be used
- To count the total building stock in England and Wales. The Register does not hold data for every building, only those with an EPC
- To compare across quarters within a year. The data have a seasonal pattern and should only be compared between the same quarters across years e.g. Q4 2022 and Q4 2021
- The data are aggregated and will not comment on individual buildings
- To track energy prices. The methodology used to assess energy efficiency does not take into account changes in energy prices
England and Wales
In the quarter October to December 2022, 438,000 EPCs were lodged on the Register for both domestic and non-domestic properties in England and Wales, a 6% increase from quarter 4 in 2021 (Live Table A1).
In October to December 2022, the total number of EPCs lodged for new dwellings in England and Wales increased by 9% to 69,000, compared to the equivalent quarter in 2021 (Live Table NB1). There was a 3% increase to 337,000 for existing dwellings EPCs lodged for that quarter (Live Table EB1).
England quarterly figures
Quarterly figures are not seasonally adjusted and should be compared to the same quarter as the previous year to see trends.
New and existing dwellings
From October to December 2022, 388,000 EPCs were lodged on the Register covering all domestic dwellings (sales, lets and new dwellings) in England. This represents an increase of 4% on the same quarter 2021, when there were 371,000 domestic lodgements (Live Table D1).
The majority of domestic EPCs were for the sale or let of existing dwellings. In October to December 2022, 321,000 EPCs for existing dwellings were lodged on the Register in England, an increase of 4%, while 66,000 EPCs were lodged for new dwellings (including new builds, conversions and change of use), a 9% increase on the same quarter 2021 (Live Table EB1 and NB1).
Table 1: Number of EPCs for new and existing dwellings, England, October to December 2022
| New dwellings: Number | New dwellings: Change since equivalent quarter | Existing dwellings: Number | Existing dwellings: Change since equivalent quarter | All domestic dwellings: Number |
|---|---|---|---|---|
| 66,000 | 9% | 321,000 | 4% | 388,000 |
Source: Live Tables, D1, EB1 and NB1
Note: New dwellings and existing dwellings may not add up to all domestic dwellings due to rounding
Energy Performance Certificates for domestic properties show an Energy Efficiency Rating (EER) based on estimated fuel costs and an Environmental Impact Rating (EIR) based on CO2 emissions. Both measures are estimated from the characteristics of the property. The numerical ratings are then banded A to G, with A being the most energy efficient and G the least. In general, the higher the EER or EIR rating, the lower the fuel bills and CO2 emissions are likely to be.
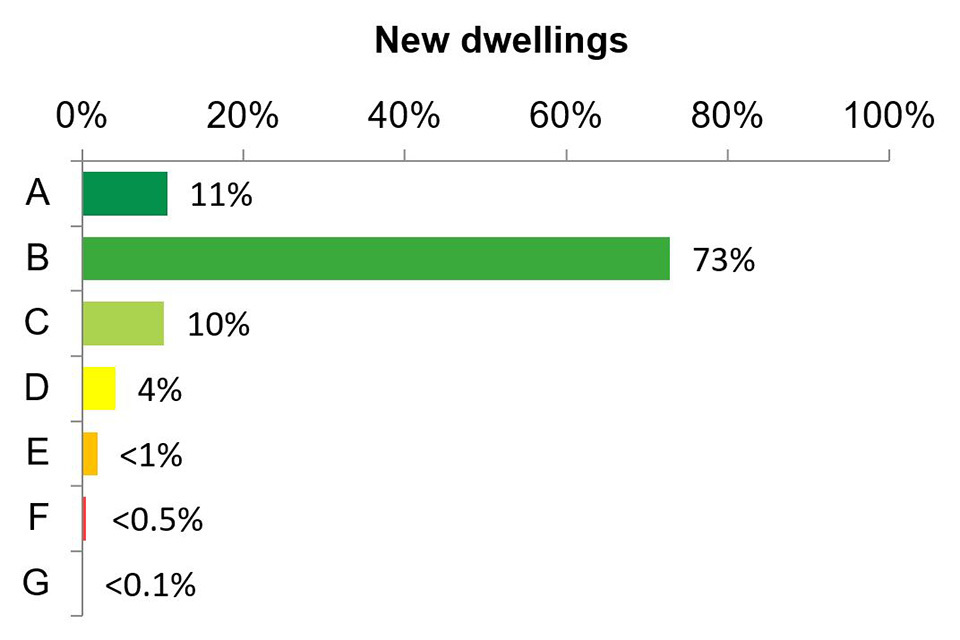
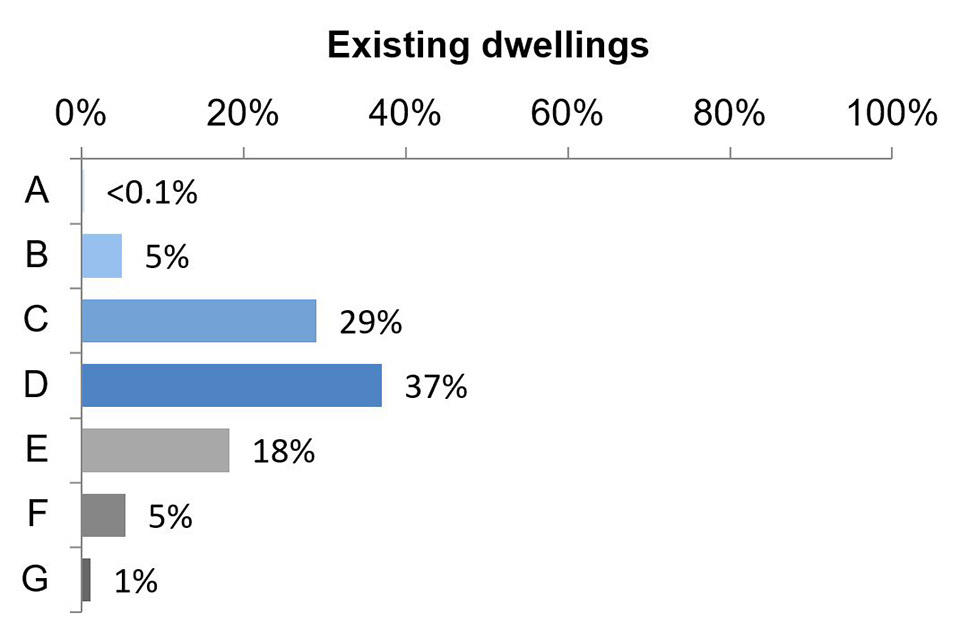
For both the EER and the EIR, the largest proportion of lodgements for existing domestic properties in England were in bands C and D. New properties in England tended to be more energy efficient, with the majority in band B (Figures 1 and 2).
In England, from October to December 2022, most (84%) new properties were given a B EER rating. Existing dwellings were more likely to be given a C or D EER (85%), compared to 12% of new dwellings. (Live Tables EB1 and NB1).
Figure 1: Energy efficiency ratings (EER): existing and new domestic properties, England, October to December 2022
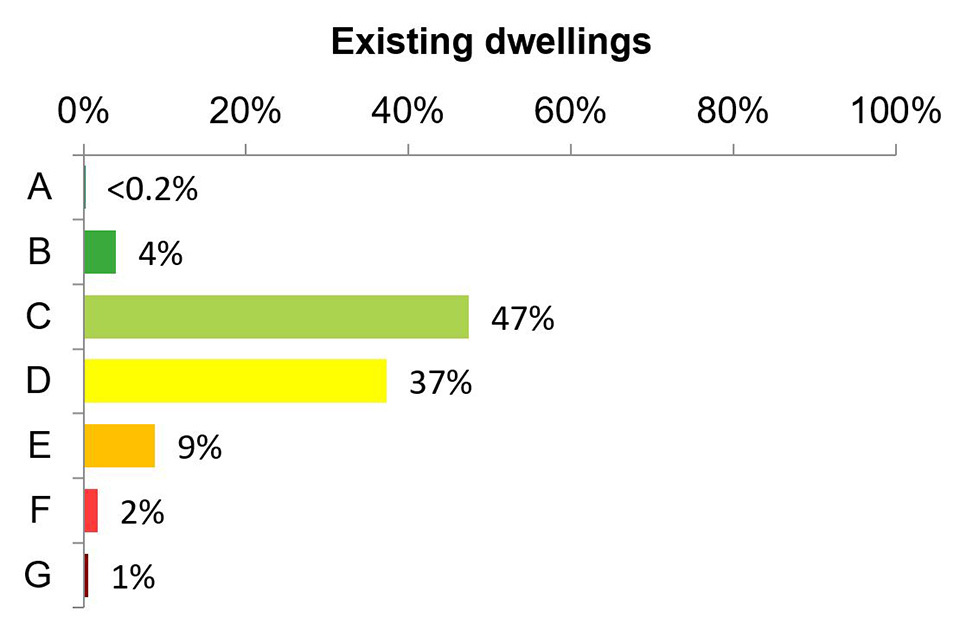
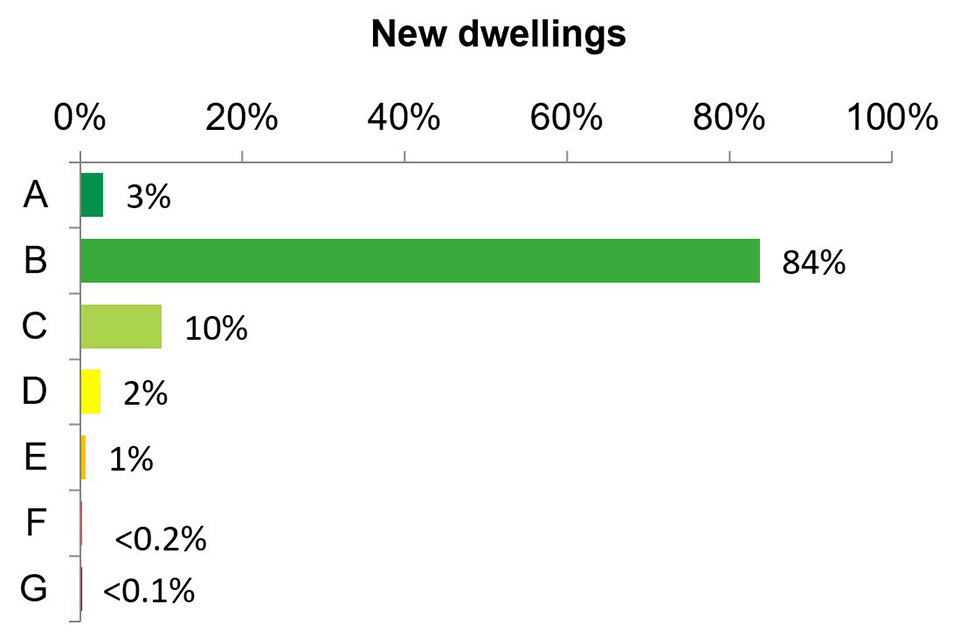
Source: Live Tables EB1 and NB1
Note: Percentage changes have been calculated using unrounded figures, therefore proportions may not add to 100%.
Figure 2: Environmental impact ratings (EIR): existing and new domestic properties,
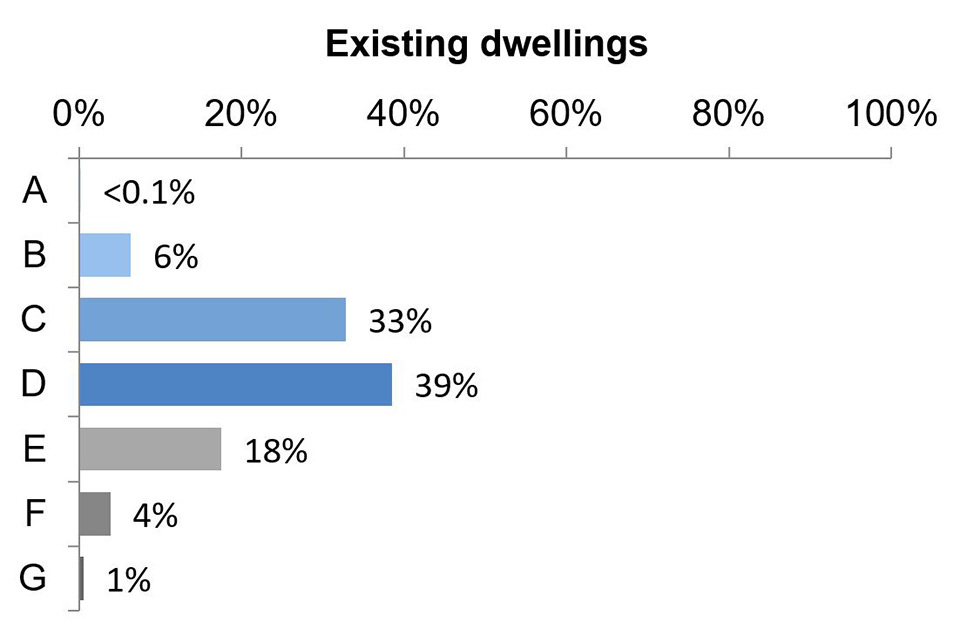
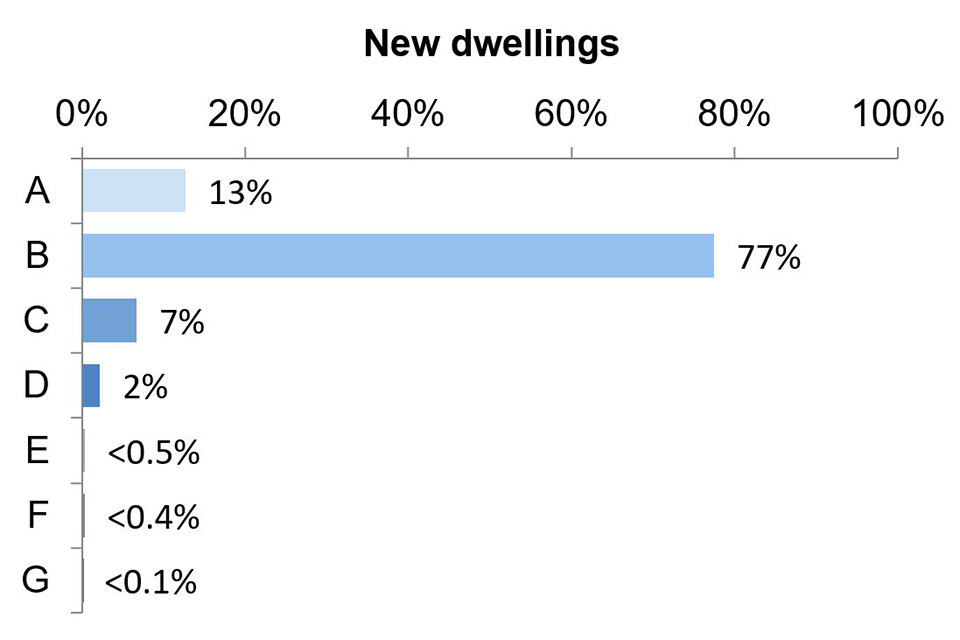
England, October to December 2022
Source: Live Tables EB2 and NB2
Note: Percentage changes have been calculated using unrounded figures, therefore proportions may not add to 100%.
Non-domestic properties
A non-domestic property is a building that is not a dwelling, such as a retail unit or office.
In October to December 2022, 31,000 EPCs were lodged for non-domestic properties, an increase of 43% compared with the corresponding quarter in 2021.
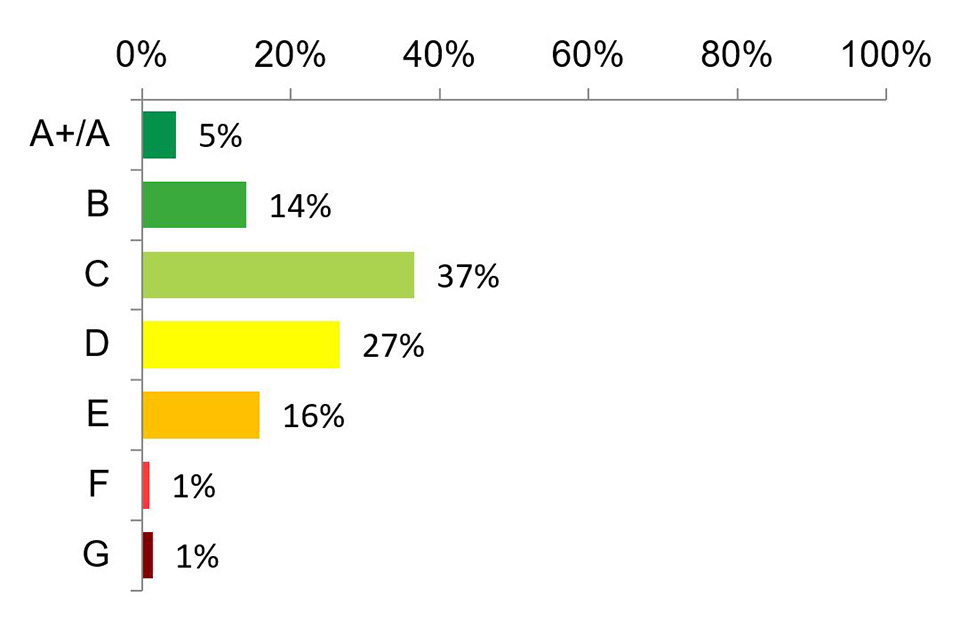
The distribution by EPC band is shown in Figure 3. Non-domestic buildings have an additional A+ band but numbers are too small to report so are combined with those receiving an A rating. An A+, A or B rating was given to 36% of properties (Live Table A).
Figure 3: Energy performance asset ratings for non-domestic properties, England, October to December 2022
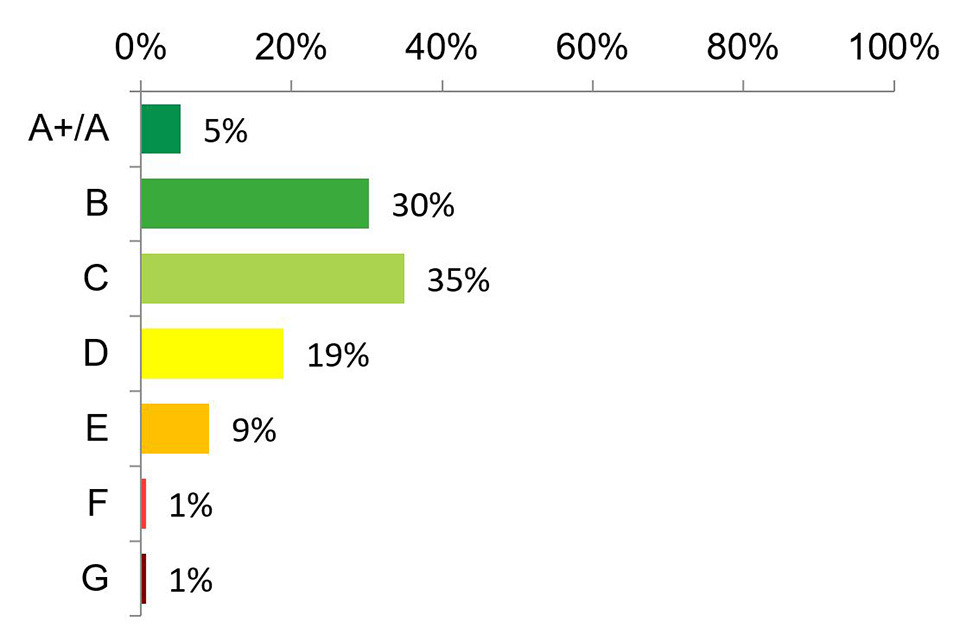
Source: Live Table A
Note: Percentage changes have been calculated using unrounded figures, therefore proportions may not add to 100%.
Display Energy Certificates (DECs)
Properties over 250 square meters occupied by a public authority and frequently visited by the public must display a Display Energy Certificate (DEC). DECs show the actual energy consumption of a building and are accompanied by reports which provide recommendations on potential energy saving measures.
From October to December 2022, 9,000 DECs were lodged in England, less than 1% increase compared with the corresponding quarter in 2021 (Live Table DEC1).
The distribution of DECs by Energy Performance Operational Ratings is shown in Figure 4. The highest proportion of DECs (34%) were in band D.
Figure 4: Energy Performance Operational Ratings: Display Energy Certificates, England, October to December 2022
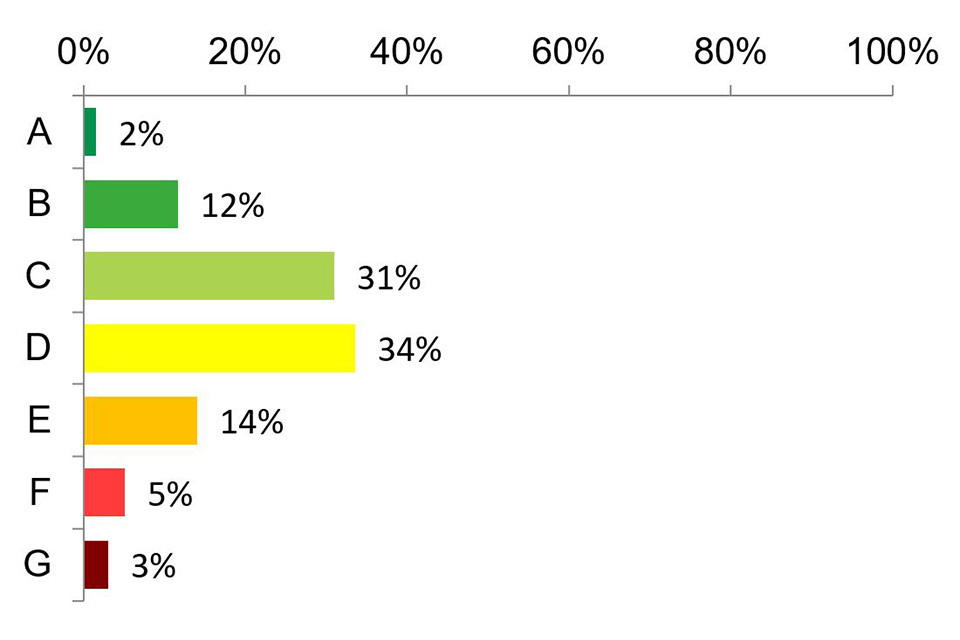
Source: Live Table DEC1
Note: Percentage changes have been calculated using unrounded figures, therefore proportions may not add to 100%.
Long term trends by transaction type
Figure 5 shows the number of domestic EPCs by transaction type, i.e. the reason for the EPC being produced, as well as the total number. The transaction types have been grouped. For example, lodgements for social and private rentals are grouped together.
The chart shows fluctuations in different transaction types based on the total number of EPCs lodged. For example, there is a seasonal pattern with fewer home sales at Christmas, which can be seen in the number of EPC lodgements. This seasonality affects the total for EPCs, particularly up to the end of 2012. At the end of 2012 the recast of EU Directive also led to changes to the Energy Performance of Buildings regulations (the regulations). It also shows how the total number of EPCs were influenced by lodgements made for energy efficiency programmes and similar schemes, as well as lodgements for other reasons, particularly in 2013, 2014 and 2015.
Figure 5: Number of domestic EPCs lodged from October 2008 to end of December 2022, by transaction type, England
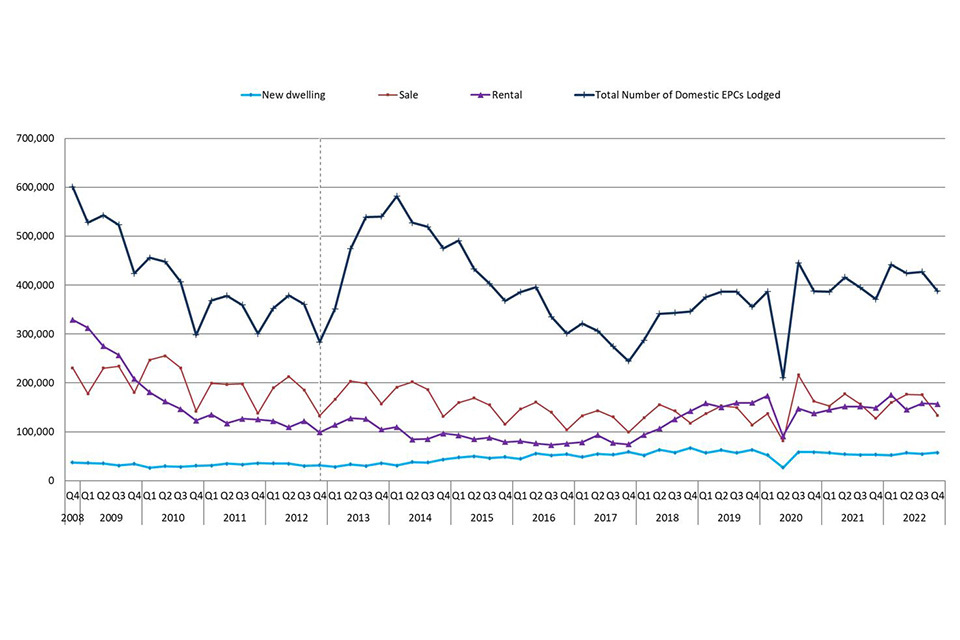
Source: Live Table D4a and D4b. The categories collected changed in 2012, leading to a break in the chart indicated by the line.
England annual figures
New and Existing dwellings
These figures are not seasonally adjusted and give annual estimates for the number of energy performance certificates over a rolling 12-month period. These can be used to make year on year comparisons.
In the 12 months to December 2022, in England, 1,681,000 domestic EPCs were lodged, an increase of 7% on the previous 12 months (Live Table D1).
In the year to December 2022, 1,429,000 EPCs for existing dwellings were lodged on the register in England, an increase of 8% on the equivalent 12 months preceding December 2021. EPCs for new dwellings (including new builds, conversions and change of use) increased by 4% to 253,000 (Live Tables EB1 and NB1).
Non-domestic properties
In the year ending December 2022, 108,000 non-domestic EPCs were lodged, an increase of 29% on the number lodged during the previous year (Live Table A).
Display Energy Certificates (DECs)
In the year ending December 2022, 31,000 DECs were lodged in England, representing a decrease of 3% compared with the previous year (Live Table DEC1).
England sub-national figures
This section presents a quarterly snapshot of domestic EPCs at sub-national level in England. For data at a local authority level with maps, see the EPC interactive dashboard
Regional figures
There is much variability across regions in the energy efficiency of dwellings, this is largely related to the type and age of the dwelling stock.
In the quarter ending December 2022, the largest increase in EPCs lodged for new dwellings compared to the same quarter in 2021, was in the East of England (23%), while the largest decrease was in Yorkshire and The Humber (-1%) (Live Table NB1). For existing dwellings, the largest increase was 54% in the North East (Live Table EB1). The largest decrease was in the South West (-19%).
Table 2: Quarterly percentage change of EPCs for new and existing dwellings, by region, England, October to December 2022
| New dwellings: Number | New dwellings: Change since equivalent quarter | Existing dwellings: Number | Existing dwellings: Change since equivalent quarter | |
|---|---|---|---|---|
| East of England | 9,000 | 23% | 33,000 | -1% |
| East Midlands | 6,000 | 9% | 27,000 | -2% |
| London | 10,000 | -0.1% | 51,000 | 7% |
| North East | 3,000 | 7% | 22,000 | 54% |
| North West | 8,000 | 5% | 38,000 | -14% |
| South East | 12,000 | 15% | 52,000 | 6% |
| South West | 7,000 | 11% | 28,000 | -19% |
| West Midlands | 6,000 | 5% | 37,000 | 27% |
| Yorkshire and the Humber | 5,000 | -1% | 31,000 | 9% |
Source: Live Tables, EB1 and NB1
Wales quarterly figures
Quarterly figures are not seasonally adjusted and should be compared to the same quarter in the previous year to see trends.
New and existing dwellings
From October to December 2022, 18,000 EPCs were lodged on the Register covering domestic properties (sales, lets and new dwellings) in Wales. This represents a decrease of 6% on the same quarter 2021, when there were 19,000 domestic lodgements (Live Table D1).
The majority of domestic EPCs were for the sale or let of existing properties. From October to December 2022, 16,000 EPCs for existing dwellings were lodged on the Register in Wales, a decrease of 9%, while 2,000 EPCs were lodged for new dwellings (including new builds, conversions and change of use), a 20% increase compared to the same quarter in 2021 (Live Table EB1 and NB1).
Table 3: Number of EPCs for new and existing dwellings, Wales, October to December 2022
| New dwellings: Number | New dwellings: Change since equivalent quarter | Existing dwellings: Number | Existing dwellings: Change since equivalent quarter | All domestic dwellings: Number |
|---|---|---|---|---|
| 2,000 | -20% | 16,000 | -9% | 18,000 |
Source: Live Tables, D1, EB1 and NB1
Note: New dwellings and existing dwellings may not add up to all domestic dwellings due to rounding
Energy Performance Certificates for domestic properties show an Energy Efficiency Rating (EER) based on estimated fuel costs and an Environmental Impact Rating (EIR) based on CO2 emissions. Both measures are estimated from the characteristics of the property. The numerical ratings are then banded A to G, with A being the most energy efficient and G the least. In general, the higher the EER or EIR rating, the lower the fuel bills and CO2 emissions are likely to be.
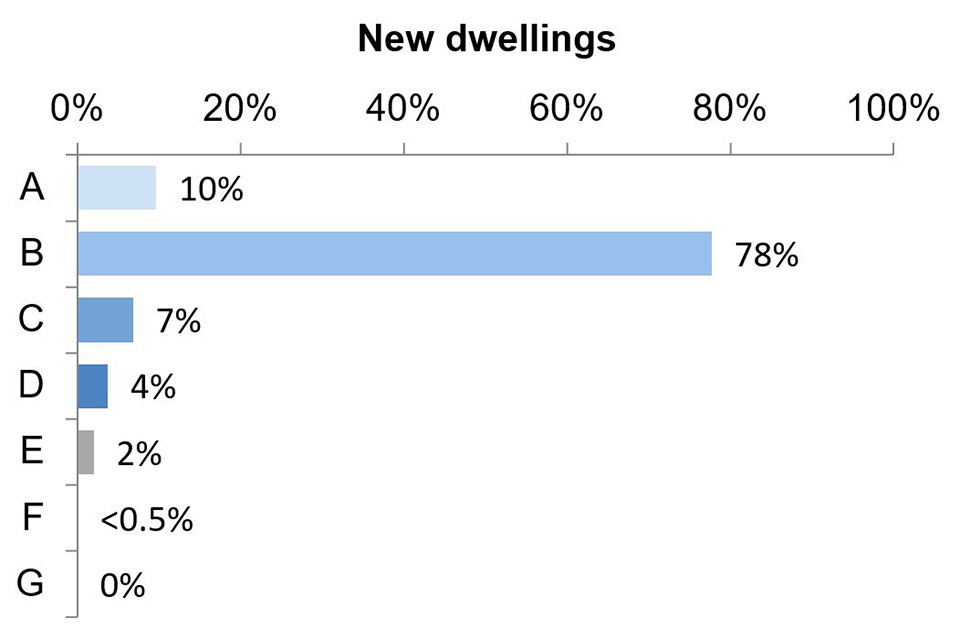
For both the EER and the EIR, the largest proportion of lodgements for existing domestic properties in Wales were in bands C and D. New properties in Wales are more energy efficient than existing, with the majority in band B (Figures 7 and 8).
In Wales, from October to December 2022, the majority of new properties were given a B EER (73%). Existing dwellings were more likely to receive a C (44%) or D (37%) rating. (Live Tables EB1 and NB1).
Figure 6: Energy efficiency ratings (EER): existing and new domestic properties, Wales, October to December 2022
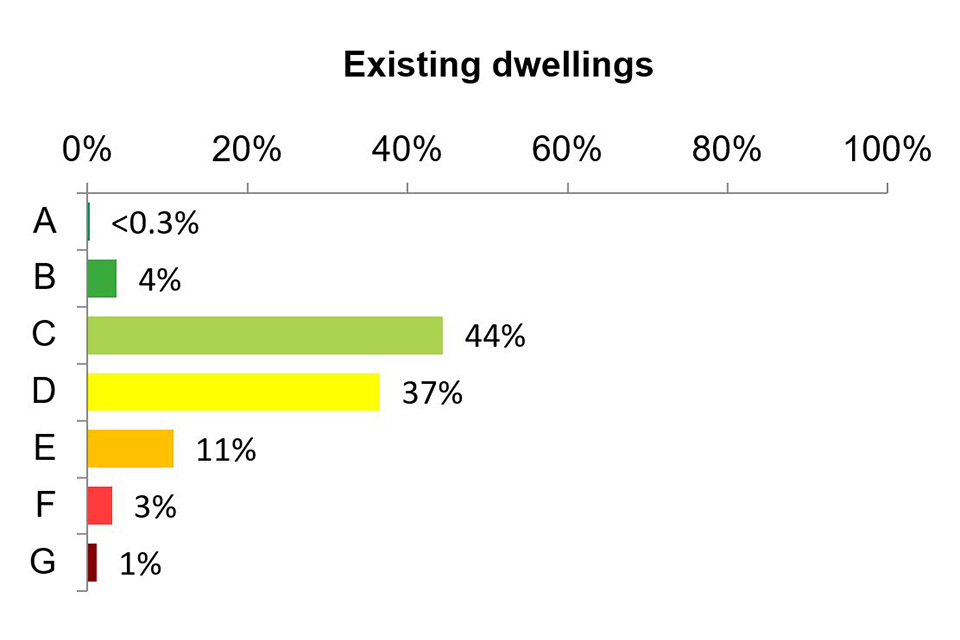
Source: Live Tables EB1 and NB1
Note: Percentage changes have been calculated using unrounded figures, therefore proportions may not add to 100%.
Figure 7: Environmental impact ratings (EIR): existing and new domestic properties, Wales, October to December 2022
Source: Live Tables EB2 and NB2
Note: Percentage changes have been calculated using unrounded figures, therefore proportions may not add to 100%.
Non-domestic properties
During October to December 2022 lodgements for non-domestic properties in Wales increased by 26% compared to the corresponding quarter in 2021 (Live Table A).
The distribution by EPC band is shown in Figure 9. Non-domestic buildings have an additional A+ band but numbers are too small to report. From October to December 2022, an A+, A or B rating was given to 19% of properties. (Live Table A).
Figure 8: Energy performance asset ratings – non- domestic properties, Wales, October to December 2022
Source: Live Table A
Note: Percentage changes have been calculated using unrounded figures, therefore proportions may not add to 100%.
Display Energy Certificates (DECs)
Properties over 250 square meters occupied by a public authority and frequently visited by the public must display a Display Energy Certificate (DEC). DECs show the actual energy consumption of a building and are accompanied by reports which provide recommendations on potential energy saving measures.
From October to December 2022, 500 DECs were lodged, more than double (increase of 169%) the number of EPCs lodged in the corresponding quarter in 2021.
The distribution of DECs by Energy Performance Operational Ratings is shown in Figure 9. The highest proportions were in bands C (33%) and D (24%).
Figure 9: Energy Performance Operational Ratings: Display Energy Certificates, Wales, October to December 2022
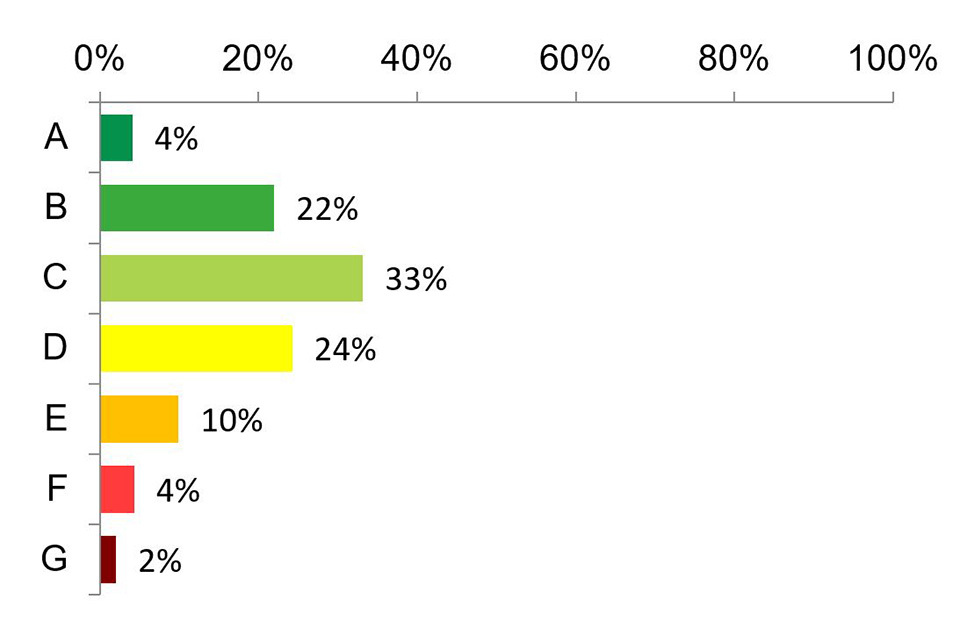
Source: Live Table DEC1
Note: Percentage changes have been calculated using unrounded figures, therefore proportions may not add to 100%.
Long term trends by transaction type
Figure 10 shows the number of domestic EPCs by transaction type, i.e., the reason for the EPC being produced, as well as the total number. The transaction types have been grouped. For example, lodgements for social and private rentals are grouped together.
The chart shows fluctuations in different transaction types based on the total number of EPCs lodged. For example, there is a seasonal pattern with fewer home sales at Christmas, which can be seen in the number of EPC lodgements. This seasonality affects the total for EPCs, particularly up to the end of 2012. At the end of 2012 the recast of EU Directive also led to changes to the regulations. It also shows how the total number of EPCs were influenced by lodgements made for energy efficiency programmes and similar schemes, as well as lodgements for other reasons, particularly in 2013, 2014 and 2015.
Figure 10: Number of domestic EPCs lodged from October 2008 to end of December 2022, by transaction type, Wales
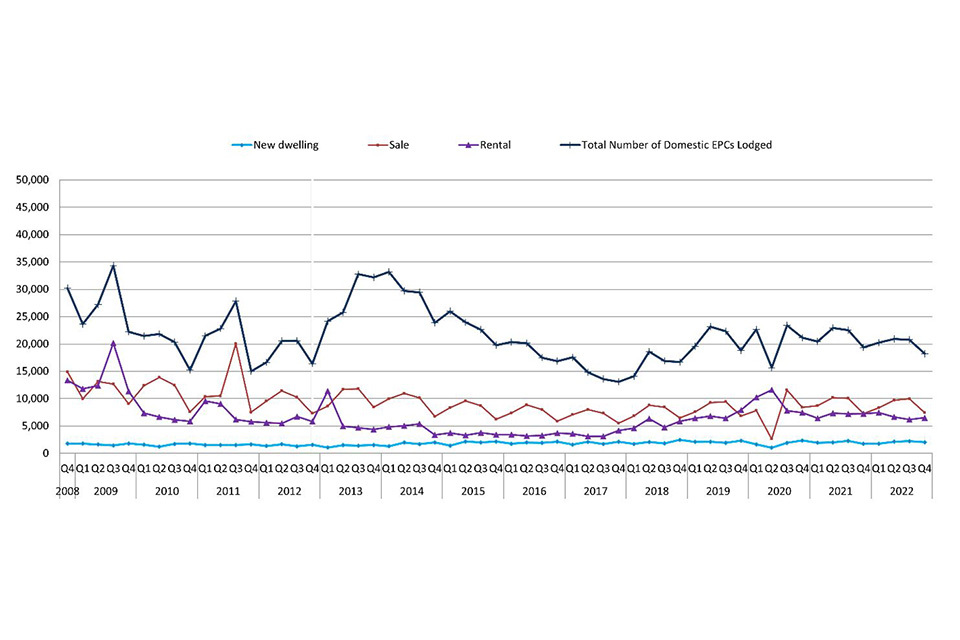
Source: Live Table D4a and D4b. The categories collected changed in 2012, leading to a break in the chart indicated by the line.
Wales annual figures
New and existing properties
In the 12 months to December 2022, in Wales, 80,000 domestic EPCs were lodged a decrease of 6% on the previous 12 months (Live Table D1).
Of which, 71,000 EPCs were lodged on the register for existing dwellings down 6%, while 9,000 EPCs were lodged for new dwellings (including new builds, conversions and change of use) down 4% on the previous year (Live Tables EB1 and NB1).
Non-domestic properties
In the year ending December 2022, 5,000 non-domestic EPCs were lodged, an increase of 10% on the number lodged during the previous year (Live Table A).
Display Energy Certificates (DECs)
Properties over 250 square meters occupied by a public authority and frequently visited by the public must display a Display Energy Certificate (DEC). DECs show the actual energy consumption of a building and are accompanied by reports which provide recommendations on potential energy saving measures.
In year ending December 2022, 2,000 DECs were lodged in Wales, representing an increase of 30% compared with the previous year (Live Table DEC1).
Wales sub-national figures
This section presents a quarterly snapshot of domestic EPCs at sub-national level in Wales.
Local authority figures
There is much variability across local authorities in Wales.
Table 4: Quarterly percentage change of EPCs for new and existing dwellings, by local authority in Wales, October to December 2022
| New dwellings: Number | New dwellings: Change since equivalent quarter | Existing dwellings: Number | Existing dwellings: Change since equivalent quarter | |
|---|---|---|---|---|
| Blaenau Gwent | 56 | 51% | 337 | 23% |
| Bridgend | 136 | 139% | 698 | 9% |
| Caerphilly | 94 | 119% | 790 | -8% |
| Cardiff | 501 | 66% | 1,859 | -16% |
| Carmarthenshire | 121 | 29% | 927 | -11% |
| Ceredigion | 52 | -16% | 471 | -21% |
| Conwy | 30 | -59% | 650 | -41% |
| Denbighshire | 54 | -60% | 537 | -27% |
| Flintshire | 88 | -17% | 1,212 | 37% |
| Gwynedd | 37 | 54% | 683 | -24% |
| Isle of Anglesey | 53 | 23% | 333 | -31% |
| Merthyr Tydfil | 26 | 136% | 278 | -37% |
| Monmouthshire | 87 | -32% | 359 | 3% |
| Neath Port Talbot | 43 | 126% | 558 | -6% |
| Newport | 159 | 3% | 761 | -6% |
| Pembrokeshire | 137 | 78% | 530 | -25% |
| Powys | 84 | -27% | 681 | -9% |
| Rhondda Cynon Taf | 93 | -21% | 1,320 | 10% |
| Swansea | 69 | -5% | 1,207 | -1% |
| Torfaen | 42 | -7% | 583 | 53% |
| Vale of Glamorgan | 141 | 31% | 599 | -8% |
| Wrexham | 140 | 169% | 601 | -10% |
Source: Live Tables, EB1 and NB1
Changes to this release
This release is now published in HTML format to make it more accessible. Quarterly and annual figures have been presented separately, and Wales figures at local authority level are now included.
Future developments
Following user engagement, we are proposing to make some changes to the statistical release to put more of a focus on energy efficiency and change over time. In addition, we’d like to be able to offer more splits of the data e.g. tenure, property type. We are also developing a RAP process to improve the efficiency and quality of the analyses.
We would welcome any comments on this: EPBStats@levellingup.gov.uk
Accompanying tables
Note to users: Based on feedback and to meet legal accessibility regulations, we have made some changes to the live tables to make them more accessible to our users. We would be keen to hear your thoughts or comments on these: EPBStats@levellingup.gov.uk
See the Live Tables for the underlying data:
Previous DLUHC statistical releases can be found at the link provided.
EPCs – All Properties (non-domestic and domestic)
Table A1: Number of Energy Performance Certificates lodged on the Register and Total Floor Area, by Type of Property – in each Year/Quarter.
EPCs – All Domestic Properties
Table D1: Number of Domestic Energy Performance Certificates lodged on the Register, by Energy Efficiency Rating – in each Year/Quarter.
Table D2: Number of Domestic Energy Performance Certificates lodged on the Register, by Environmental Impact Rating – in each Year/Quarter.
Table D3: Floor Area, Size, Energy Use, Carbon Dioxide Emissions and Fuel Costs of Dwellings assessed and lodged on the Register - in each Year/Quarter.
Table D4a: Number of Domestic Energy Performance Certificates lodged on the Register by, Type of Transaction – in each Year/Quarter – up to and including 30 March 2012.
Table D4b: Number of Domestic Energy Performance Certificates lodged on the Register, by Type of Transaction – in each Year/Quarter – from 30 March 2012 to latest quarter.
EPCs – All Existing Domestic Properties
Table EB1: Number of Existing Domestic Properties Energy Performance Certificates lodged on the Register, by Energy Efficiency Rating – in each Year/Quarter.
Table EB2: Number of Existing Domestic Properties Energy Performance Certificate lodged on the Register, by Environmental Impact Rating – in each Year/Quarter.
Table EB3: Floor Area, Size, Energy Use, Carbon Dioxide Emissions and Fuel Costs of Existing Dwellings assessed - in each Year/Quarter.
Table EB4: Number of Existing Domestic Properties Energy Performance Certificates lodged on the Register and Total Floor Area, by Type of Property – in each Year/Quarter.
Table EB7: Number of Existing Domestic Properties Energy Performance Certificates lodged on the Register, by Type of Property and Average Energy Use, Carbon Dioxide Emissions and Fuel Costs per dwelling – in each Year/Quarter.
EPCs – All New Domestic Properties
Table NB1: Number of New Domestic Properties Energy Performance Certificates lodged on the Register, by Energy Efficiency Rating – in each Year/Quarter.
Table NB2: Number of New Domestic Properties Energy Performance Certificate lodged on the Register, by Environmental Impact Rating – in each Year/Quarter.
Table NB3: Floor Area, Size, Energy Use, Carbon Dioxide Emissions and Fuel Costs of New Dwellings assessed - in each Year/Quarter.
Table NB4: Number of New Domestic Properties Energy Performance Certificates lodged on the Register and Total Floor Area, by Type of Property – in each Year/Quarter.
Table NB7: Number of New Domestic Properties Energy Performance Certificates lodged on the Register, by Type of Property, and Average Energy Use, Carbon Dioxide Emissions and Fuel Costs per dwelling – in each Year/Quarter.
EPCs – Non-Domestic Properties
Table A: Number of Non-Domestic Energy Performance Certificates lodged on the Register, by Energy Performance Asset Rating - in each Year/Quarter.
DECs – Display Energy Certificates
Table DEC1: Number of Display Energy Certificates lodged on the Register, by Local Authority and Energy Performance Operational Rating - in each Year/Quarter.
Open data
EPC data at address level in a fully open data format are available at Open Data Communities. Where possible, data are updated within two weeks of this release and as of November 2021 include Unique Property Reference Numbers (UPRNs). To note: local authority allocation is based on ONS geography as at July 2020, whereas this release is based on a more up to date list. Therefore, allocations for authorities within Northamptonshire will differ due to the merger in July 2021. In addition, EPC certificates lodged on the Register and published in the open data does not reflect the recent increase in energy prices.
Related links
Housing supply: indicators of new supply
Quarterly figures on EPCs lodged for new dwellings have followed a similar trend to quarterly new build dwelling completions since 2009-10. The number of new dwelling EPCs lodged are higher than quarterly new build completions as they comprise of new build dwellings plus dwelling conversions (for example a house into flats) and change of use of an existing building (for example a shop into a house or a barn conversion).
The English Housing Survey is a continuous national survey commissioned by the Department for Levelling Up, Housing and Communities (DLUHC). It collects information about people’s housing circumstances and the condition and energy efficiency of housing in England. It can be used for understanding the energy efficiency of the whole stock as well as the household characteristics of the people living in the homes.
Welsh Housing Conditions Survey
The Welsh Housing Conditions Survey collects information about the condition and energy efficiency of all types of housing in Wales:
- details of energy saving measures installed in dwellings and breakdowns of construction types
- the number of dwellings making use of renewable energy
- heating systems, main fuel type and type of boilers used
- comparisons between tenures, dwelling types and urban/rural areas
- comparisons with other UK nations and changes over time.
Scottish House Condition Survey
The Scottish House Condition Survey contains statistics on energy efficiency, based on an annual survey sample of around 3,000 dwellings. This is the primary source of data at a national level on the energy efficiency of the Scottish housing stock.
Northern Ireland Housing Statistics
The Northern Ireland Housing Statistics report contains information and statistics relating to domestic energy and energy efficiency of homes in Northern Ireland.
Energy Efficiency of Housing in England and Wales: 2021
The Office for National Statistics (ONS) published an article using DLUHC EPC data to provide an insight into the energy efficiency, environmental impact, carbon dioxide emissions, estimated energy cost and central heating main fuel type for new and existing homes by property type, tenure and property age.
Technical notes
Please see the accompanying technical notes document published alongside this release for further details.
Information on Official Statistics is available via the UK Statistics Authority website
Information about statistics at DLUHC is available via the DLUHC website