Employment Data Lab Interim Analysis: Nottingham Works 4You programme
Published 25 March 2025

© Crown copyright 2025
This publication is licensed under the terms of the Open Government Licence v3.0 except where otherwise stated. To view this licence, visit nationalarchives.gov.uk/doc/open-government-licence/version/3 or write to the Information Policy Team, The National Archives, Kew, London TW9 4DU, or email: psi@nationalarchives.gov.uk.
Where we have identified any third party copyright information you will need to obtain permission from the copyright holders concerned.
This publication is available at https://www.gov.uk/government/statistics/employment-data-lab-interim-analysis-nottingham-works-4you-programme/employment-data-lab-interim-analysis-nottingham-works-4you-programme
This Employment Data Lab report presents preliminary estimates of the impact of the Nottingham Works 4You (NW4You) programme, on the benefit and employment outcomes of the programme participants. The NW4You programme is aimed at supporting 16–24-year-olds who face barriers getting into work or education.
The results in this report have been generated using quasi-experimental techniques which introduce some uncertainty. The results should be used with a degree of caution. Further information can be found in section 6, and in an associated methodology report.
Headline statistics
Increase in employment at 24 months
Between 1 and 8 percentage points more programme participants were classed as employed two years after starting the programme, than had they not participated. This result was statistically significant.
Education and training are also key outcomes for participants; however, they are not included in this preliminary evaluation as, at the time this evaluation was undertaken, participants’ education and training outcomes data was only available up to the end of the 2021 to 2022 academic year.
- the main analysis focuses on a sub-group of 710 evaluated participants (out of 3,699) who were between the ages of 18 and 24 when they started the programme and started between April 2021 and April 2022 (for more information about exclusions from the evaluation see Who was evaluated as part of the analysis?)
- for this report the Employment Data Lab team used administrative data to analyse participants’ labour market outcomes for two years after starting the programme
- participants were compared to a comparison group of similar individuals to evaluate the programme
- the headline statistic was chosen before starting the analysis as the primary outcome measure to assess the success of the programme
- progressing into education or training were also considered successful outcomes for participants, but it was not possible to estimate the impact of the programme on these outcomes because, at the time the evaluation was conducted, data was only available up to the end of the 2021 to 2022 academic year
- this preliminary analysis can be followed up with more comprehensive analysis looking at education and training outcomes, as well as longer term employment outcomes, in the future when more data is available
1. What you need to know
What is the Employment Data Lab?
The Employment Data Lab is a service provided by a team of analysts at the Department for Work and Pensions (DWP). The Data Lab provides group-level benefits and employment information to organisations who have worked with people to help them into employment. The purpose is to provide these organisations with information to help them understand the impact of their programmes.
What was the NW4You programme?
The NW4You programme was a partnership project led by Nottingham City Council, that supported young people aged 16 to 24, who were not in employment, education or training (NEET), into education, training or work (or self-employment) in the City of Nottingham. Nottingham City Council worked alongside 21 delivery partners to deliver the programme.
As part of the programme, participants received one-to-one support from an advisor to help reduce their barriers to employment and progress into employment, education, or training. This could include employment support such as assistance with CV writing, help searching and applying for jobs, interview skill practice, career and educational route planning advice, and employability skills training. Support could also include financial support such as support to attend interviews, courses, or employment before first pay day as well as support with housing issues and help to access appropriate support for mental and physical health issues.
Who was evaluated as part of this analysis?
Data was shared on 3,699 participants who took part in the programme between April 2021 and September 2023. The main impact analysis focusses on a subset of 710 participants who were between 18 and 24 when they started the programme. Others were excluded from the analysis for various reasons, mainly because: we were unable to match their details to the records we hold; they were aged under 18 when they started the intervention and thus have no labour market history; they started after April 2022, so they do not have two full years of employment outcomes. For more details see Appendix A.
Participant information
Of the 710 participants included in this analysis, the available administrative data indicated:
- 58% were male and 42% were female
- average age was 20 years
- 60% were white
- 12% had claimed Personal Independence Payment (PIP) in the 2 years before starting the programme.
- 47% had previously been eligible for Free School Meals (FSM)
- 40% had previously had Special Educational Needs (SEN) provisions
- 9% had been in care at some point
- 20% had been classed as a Child in Need
- 15% had claimed Housing Benefit in the 2 years before starting the programme
Further information on those who were and were not included as part of the analysis and missing markers in the administrative data can be found in Appendix A and Appendix B.
The analysis in this report
This report presents analysis on the impact of the NW4You programme by comparing employment and benefit outcomes of participants to those of a matched comparison group who did not participate. The comparison group is used to estimate the outcomes of participants had they not participated in the programme and was created using a method called propensity score matching (PSM). Further information about how the analysis was conducted can be found in the associated methodology document.
The following primary outcome measure was selected for this evaluation before the analysis was undertaken.
The main analysis in this report (section 2 and section 3) presents the impacts of an individual participating in the NW4You programme.
Primary outcome measures
The percentage of the group classed as employed two years after starting on the programme.
Education and training are also key outcomes for participants; however, they are not included in this preliminary evaluation as participants’ education and training outcomes data is currently unavailable.
2. The labour market impacts of the programme over time
This report uses four categories of labour market status in this analysis (see section 6 for more details).
The results show that the programme led to:
- More classed as employed, at two years
- More classed as looking for work, at two years
- Fewer classed as inactive, at two years
- Fewer classed as other, at two years
An increase in employment, at two years
Between 1 and 8 percentage points more programme participants were classed as employed two years after starting the programme, than had they not participated. This result was statistically significant.
More classed as looking for work, at two years
Between 6 and 13 percentage points more programme participants were classed as being on looking-for-work benefits two years after starting the programme, than had they not participated. This result was statistically significant.
Fewer classed as inactive, at two years
Between 3 and 10 percentage points fewer participants were classed as being on inactivity benefits, two years after start. This result was statistically significant.
Fewer classed as “other”, at two years
Between 3 and 7 percentage points fewer participants were classed as “other”, two years after start. This result was statistically significant.
The figures and tables in this section show the impact of the programme on the numbers of people in each labour market category over the two years after starting the intervention. The participants are compared to a comparison group used to estimate the outcomes they would have achieved had they not participated in the programme. The difference between the groups can be interpreted as the impact of the programme.
Figure 1 shows the percentages of the participant and comparison groups in each labour market category in the two years after participants started the programme. Table 1 provides a breakdown of the participant and comparison groups’ labour market status at two different points in time (12 and 24 months after start).
To explore the labour market impacts further, Table 2 shows an additional labour market impact measure - the percentage of each group who were in work at any point during the one and two years after starting the programme. The results indicate the programme led to a statistically significant increase in people having some experience of work during the two years after starting the programme. The results show that the programme led to a statistically significant increase in employment for its participants in the two years after start; although, the impact of the programme on employment declined between year one and year two after start. The impact of the programme on employment two years after start was approximately half of the impact at one year after start.
Further variables can be found in Table 8 in Appendix E.
Figure 1: Plots showing the impact of the programme on the numbers in each labour market category over time
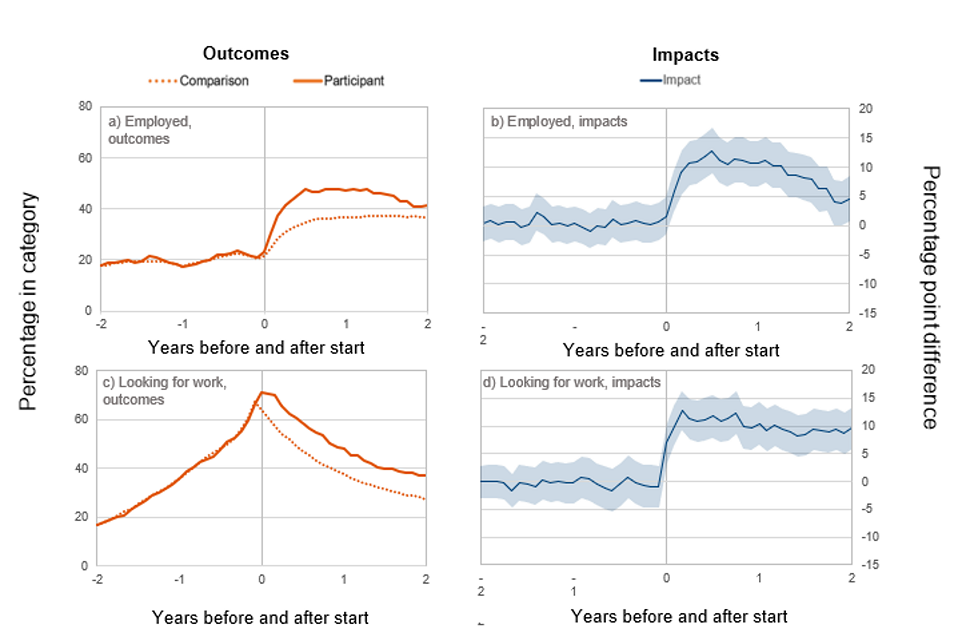
The plots on the left (in orange) show the percentages of the participant and comparison groups in each category. The difference (or impact of the programme) is shown on the right in blue. The darker blue line shows the central estimate, and the shaded blue area is the 95% confidence interval.
1(a & b) – Employed: The impact plot (b) shows the programme had a positive and statistically significant effect on the percentage of participants who were employed in the two years following programme start. Plot (a) shows the percentage of the participant and comparison group employed at start is similar but the percentages increase at a faster rate for the participant group over the one year after start. Plot (a) then shows that the percentage of participants in employment declines between year one and year two after start, while the percentage of the comparison group in employment remains constant over that time.
1(c & d) – Looking for work: The impact plot (d) shows the programme resulted in a statistically significant increase in those on looking-for-work benefits. Plot (c) shows a decrease in the percentage of both groups in the ‘looking for work’ category over the two years after starting.
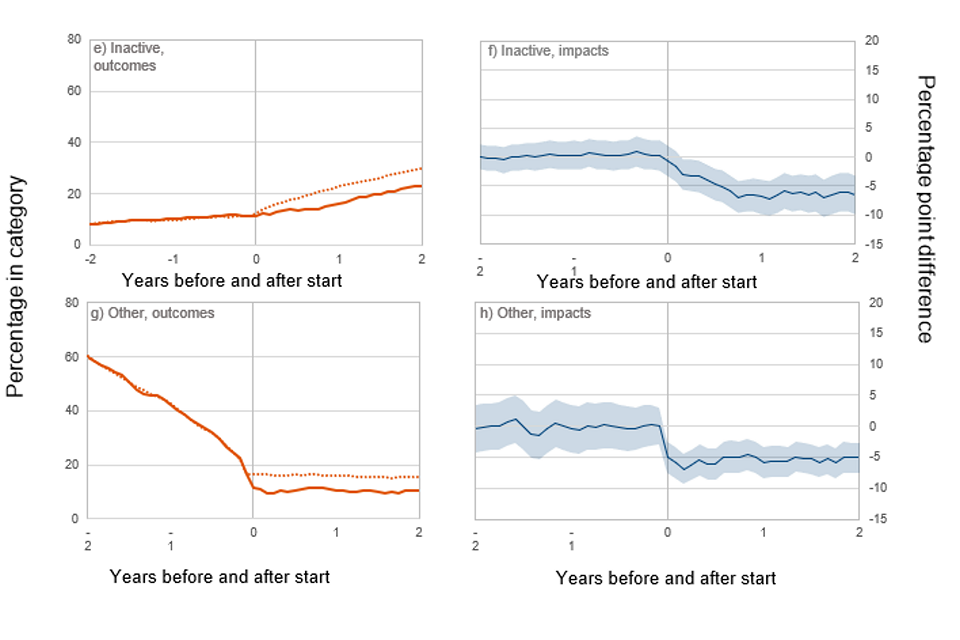
1(e & f) – Inactive: The impact plot (f) shows that the programme led to a statistically significant reduction in the percentage of participants in receipt of ‘inactive’ benefits, that was sustained over the two-year follow-up period. Plot (e) shows the percentage of both groups on ‘inactive’ benefits increased in the two years after start.
1(g & h) – Other: The impact plot (h) shows that the programme led to a statistically significant and sustained reduction in the percentage of participants in the ‘other’ category. Plot (g) shows the percentage of the participant group classed as ‘other’ dropped sharply prior to programme start, before remaining constant, at a lower percentage to the comparison group.
Table 1: Showing the percentage of each group in each category at one and two years after starting the programme. The impact, or difference, is shown along with an indication of statistical significance
The impact, or difference, is shown along with an indication of statistical significance. The “upper” and “lower” values give the confidence interval around the central estimate of the impact. Percentage points are denoted by ppt.
| Percentage of group in category | Participant group (%) | Comparison group (%) | Impact: Central (ppt) | Impact: Lower (ppt) | Impact: Upper (ppt) | Sig. |
|---|---|---|---|---|---|---|
| Employed (1 year) | 47 | 37 | 11 | 7 | 14 | yes |
| Looking for work (1 year) | 48 | 38 | 10 | 7 | 14 | yes |
| Inactive (1 year) | 16 | 23 | -7 | -10 | -4 | yes |
| Other (1 year) | 10 | 17 | -6 | -8 | -4 | yes |
| Employed (2 years) | 41 | 37 | 5 | 1 | 8 | yes |
| Looking for Work (2 years) | 37 | 28 | 10 | 6 | 13 | yes |
| Inactive (2 years) | 23 | 30 | -7 | -3 | -10 | yes |
| Other (2 years) | 10 | 16 | -5 | -7 | -3 | yes |
Table 2: Showing the percentage of the participant and comparison groups in the Employed category at any point during the 12 and 24 months after start
| Percentage of group employed at any point | Participant group (%) | Comparison group (%) | Impact: Central (ppt) | Impact: Lower (ppt) | Impact: Upper (ppt) | Sig. |
|---|---|---|---|---|---|---|
| Employed (at any point in the 12 months after start) | 67 | 51 | 16 | 12 | 19 | yes |
| Employed (at any point in the 24 months after start) | 72 | 58 | 13 | 10 | 17 | yes |
Benefits and Employment Overlap
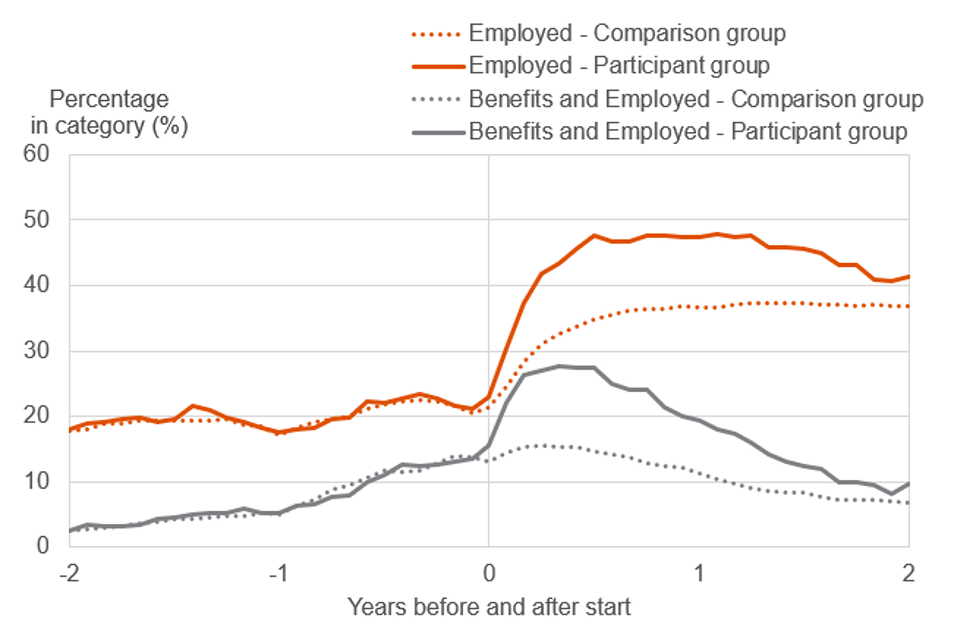
It is important to note that the employed category includes those in low levels of work and receiving benefits such as JSA (Jobseeker’s Allowance) or UC (Universal Credit). The plot in Figure 2 shows the percentage of the participant and comparison group with an employment record as well as the percentages who are employed and in receipt of looking-for-work benefits. It shows that a large percentage of the increase in employment immediately after start relates to participants entering low level employment where people are also in receipt of benefits. However, the percentage of participants in receipt of looking-for-work benefits and in employment decline around six months after start while the overall percentage of participants in employment remains flat until around one year after start.
For more information on categories see section 6.
Figure 2: Plot showing the percentages of the participant and comparison group in the Employed category and the Looking for Work and Employed category
3. Participation in other employment programmes
The analysis in this report estimates the impact of the NW4You programme in a real-life context where both the participants and the individuals in the comparison group are free to participate in other employment support programmes, either provided by DWP or external providers. The analysis controls for participation in other DWP programmes in the run-up to starting the programme but not after starting the programme.
The results in Table 3 show that the majority (51%) of participants went on another DWP programme during the year after starting the NW4You programme. Those who started on NW4You were between 24 and 32 percentage points more likely than the comparison group to participate in another DWP programme in the one year after starting the programme. This impact was statistically significant and sustained through the second year after start.
It is possible that participation in these other programmes may have contributed to the observed impacts presented in this report and should be considered when interpreting these results, particularly as participants during the evaluation period (April 2021-April 2022) would have been eligible for the Kickstart[footnote 1] programme after they had completed the NW4You programme. The Kickstart programme ran from September 2020 to September 2022, with the programme closing to new entrants in March 2022. The Kickstart programme offered six month paid job placements alongside training and support from an employer.
Table 4 shows that 26% of participants went on the Kickstart programme at some point during the one year after starting on the NW4You programme, and that participants were between 16 and 22 percentage points more likely than the comparison group to go on Kickstart. However, the NW4You programme may have led to an increase in confidence and motivation[footnote 2] among participants which made them more suitable for other employment programmes. If this were the case, then positive impacts on employment from subsequent participation in other programmes may still be interpreted as a positive outcome of the NW4You programme.
Table 3: Showing the percentage of the participant and comparison groups on other DWP employment programmes in the two years after start
| Percentage of group on another DWP programme | Participant group (%) | Comparison group (%) | Impact: Central (ppt) | Impact: Lower (ppt) | Impact: Upper (ppt) | Sig. |
|---|---|---|---|---|---|---|
| at any point in the one year after start | 51 | 23 | 28 | 24 | 32 | yes |
| at any point in the two years after start | 59 | 32 | 27 | 23 | 31 | yes |
Table 4: Showing the percentage of the participant and comparison groups on the Kickstart programme in the one year after start
| Percentage of group on Kickstart programme | Participant group (%) | Comparison group (%) | Impact: Central (ppt) | Impact: Lower (ppt) | Impact: Upper (ppt) | Sig. |
|---|---|---|---|---|---|---|
| at any point in the one year after start | 26 | 7 | 19 | 16 | 22 | yes |
4. How to use the results of this report?
One primary outcome measure was chosen to assess the success of this programme. The results suggest that the programme had a positive statistically significant impact on this measure. This suggests the programme has been successful at:
- increasing the percentage of participants in employment 24 months after starting the programme
As this programme was aimed at young people not in education, employment or training, progression into education and training is also a target outcome for the programme. Due to a lack of available education and training outcomes data at the time of the evaluation, it was not possible to estimate the impact of the programme on those outcomes. Further analysis may be conducted in future, when more outcomes data is available, to estimate the impact of the programme on participation in education and training.
A range of secondary outcome measures were also analysed in this report (see Appendix E and can be used to learn more about the impacts of the programme. Results marked as statistically significant indicate an estimate that is unlikely to have occurred by chance (and more likely to be a causal impact of the programme). If a result is not statistically significant it does not mean that there was no impact, it just means there was insufficient evidence to verify this to the required threshold.
The estimates in this report were generated using quasi-experimental methods that can be less reliable than experimental methods such as a randomised control trial. The results should be used with a degree of caution.
The estimates were also generated using a subset of NW4You participants, notably those in the age range of 18 to 24 who participated in the programme before April 2022. Care should be taken in generalising the results to those outside of this group.
The estimates relate to a programme working in a particular context. This report makes no assessment as to whether these impacts are generalisable to different contexts. The estimates were also made in a “business as usual” setting where participants and comparators were free to go on to access other support. Notably 51 percent of the 710 evaluated programme participants went on to participate in a DWP related programme in the year after starting NW4You. For the comparison group the figure was 23 percent. This difference was statistically significant.
5. Nottingham City Council in their own words
Our organisation
“Nottingham City Council’s Nottingham Works 4You (NW4You) project was a vital initiative aimed at supporting young people aged 16-24 who are not in education, employment, or training (NEET) across Nottingham. Funded by the European Social Fund (ESF), NW4You focused on breaking down barriers to employment and education through tailored, person-centred support. Our programme specifically engaged young people facing significant obstacles, including mental health challenges, low confidence, lack of qualifications, and socio-economic disadvantage. By delivering flexible, accessible, and responsive support, NW4You empowered participants to progress into sustainable employment, apprenticeships, or further education.
NW4You operated through a collaborative model, working with local delivery partners, including local charities, third sector organisations, training providers and services within Nottingham City Council to offer a comprehensive range of services. This included one to one mentoring and support with improving employability skills, job-searching and progression into education and training opportunities. Our advisors built trusted, supportive relationships with young people, guiding them through personalised action plans that addressed their unique needs and aspirations. By focusing on both personal development, employability skills and supported progression, NW4You ensured that young people were not only prepared to re-engage with education and training or enter the workforce but were equipped to sustain long-term success.”
Our response to the analysis
“We welcome the insights provided by the evaluation conducted by the Employment Data Lab and are encouraged by the positive findings regarding the Nottingham Works 4You project’s impact. This analysis provides valuable, evidence-based confirmation of our programme’s effectiveness in improving employment outcomes for young people in Nottingham. It highlights the statistically significant improvements in employment rates and reduction in economic inactivity rates among NW4You participants compared to non-participants, validating our holistic, person-centred approach.
The results demonstrate that NW4You successfully supported young people in overcoming the barriers preventing them from accessing the labour market. This is particularly significant given the diverse and complex challenges faced by our participants. Our model recognises that sustainable employment is achieved not only through having the relevant skills and experience but also by other barriers to employment such as addressing mental health, confidence, and social inclusion. The analysis affirms the impact of this approach, showing that our interventions result in increased employment rates and reduced economic inactivity across the city.
We are particularly encouraged by the evidence that the positive outcomes for NW4You participants are sustained over time. This finding reinforces the value of our support, including in work support for the initial period, which is critical in helping young people maintain their employment or placements.
It is important to note that this evaluation covers a period of significant external challenges, including the COVID-19 pandemic, which disproportionately affected young people’s employment prospects. Despite these challenges, the analysis shows that NW4You has been effective in helping participants adapt and find pathways into work. This resilience underscores the flexibility and responsiveness of our programme design.
The findings also highlight the importance of our outreach efforts to engage Hidden NEETs – young people who are not in contact with services and are not claiming benefits. We are committed to enhancing our outreach strategies through closer collaboration with community organisations, City Council services, including the Leaving Care service, Housing Aid, Children and Families Service to ensure that no young person in Nottingham was left behind.
Furthermore, the data indicates a positive reduction in benefit claims among participants, demonstrating that NW4You was successful in supporting young people in transitioning from financial dependency to economic independence. This transition not only benefits the individuals involved but also contributes to the wider economic and social well-being of Nottingham.
Our advisors were central to the success of the NW4You programme. Their ability to build trust and provide consistent, tailored support has been instrumental in achieving these positive outcomes. The analysis confirms that this relational, supportive model is effective in helping young people progress towards their goals.
In conclusion, we are greatly encouraged by the Employment Data Lab’s findings and are proud of the significant impact the Nottingham Works 4You project made to the lives of young people. The evidence affirms the effectiveness of our holistic, person-centred approach in improving employment outcomes. We would anticipate that a similar result would have been confirmed had the relevant education data been available at the time of the evaluation.
We are committed to building on this success and have continued to work with several of the delivery partners on UKSPF funded employment projects, following the end of the European Social Fund programme.
We intend to continue to adapt and enhance our partnership and our services, deepening our partnerships with local organisations and employers, and expanding our reach to engage and support more young people across Nottingham. Together, we will continue to create a more inclusive, supportive environment where every young person has the opportunity to thrive and build a brighter future.”
6. About these statistics
This report presents estimates of the impact of a programme. This is achieved by comparing the outcomes of the programme participants to a credible estimate of their outcomes had they not participated in the programme. This is often referred to as the counterfactual. In this report the counterfactual was generated using a quasi-experimental technique called propensity score matching (PSM). This involves constructing a comparison group of individuals, who did not participate in the programme but who are matched on key characteristics that affect whether an individual takes part in the programme and the outcomes that they experience as a result of participation.
Once this comparison group has been constructed the outcomes of the two groups can be compared to generate the estimate of the impact of the programme. More information about this technique and how it is used in the Data Lab can be found in the methodology report.
Categorisation
The analysis in this report is based on the labour market outcomes of the participants (and a matched comparison group) in the two years before and after starting the intervention. This report uses four categories of labour market status for the analysis, detailed below:
-
Employed: People who are either employed or self-employed
-
Looking for Work: People who are in receipt of Jobseeker’s Allowance (JSA), or in the Universal Credit (UC) “intensive work search”, “light touch out of work”, “light touch in work”, or “working enough” conditionality regimes.
-
Inactive: People who are in receipt of inactive benefits such as Employment and Support Allowance (ESA) or in the UC “no work requirements” or “work focussed interview” conditionality regimes. Several other benefits also fall into this category, though the numbers of people on these benefits is small. See methodology report for details.
-
Other: People who do not fall into the above three categories, this could include people who are in full-time education and not working or receiving benefits or those who are in custody.
These categories are not mutually exclusive, and it is possible to be in more than one category. For example, someone working fewer than 16 hours a week may also be in receipt of JSA and would be classed as “employed” and “looking for work”.
Statistical significance
The report highlights if the results are statistically significant or not. A statistically significant result is one that is unlikely to have occurred by chance because of sampling error. If a result is not statistically significant it does not mean that the intervention has no impact, it simply means that there is not enough evidence to verify this to a required threshold. In this report, unless otherwise stated, the threshold for significance is 95%.
This report sometimes presents the central estimate of a result along with the upper and lower confidence values. These upper and lower values create a range that you would expect the estimate to fall within if the test was to be redone, within a certain level of confidence. This level is set at 95% unless otherwise stated. The confidence intervals will typically be stated in the tables of results and be presented on graphs and plots as either error bars or shaded regions.
Limitations
The validity of the technique used in this report rests on the assumption that all the characteristics that are linked to a person’s participation in the programme and the outcome variables of interest have been sufficiently accounted for in the analysis, either explicitly or otherwise. This is a strong assumption that cannot be tested and depends on the data available and on the nature of each programme and its participants. This is reviewed on a case-by-case basis in the Data Lab and impact evaluations are only carried out where the validity of this assumption is plausible. That said, these are quasi-experimental techniques that tend to be less robust than true experimental methods, such as a randomised control trial, and the results must be treated with a degree of caution.
Particular caution should be applied when interpreting the education related data used in the matching. The reason for this stems from the fact that the education spells data relates to enrolment on a course, and actual attendance and/or drop-outs are not always captured and accounted for. This has the potential for someone to appear as though they are in education when in practice they are not (for example if they enrolled on a course and subsequently dropped out). Since the programme is aimed at people who are NEET, i.e. Not in Employment, Education or Training, it is possible that this issue would be more likely to affect the participant group than the comparison group, therefore introducing some bias into the results. Whilst there are indications in the data that this sort of bias may be present to a degree, sensitivity analyses have been conducted providing reassurance that the benefit and employment related impact estimates are robust.
Where to find out more
Read the Employment Data Lab analysis, information and guidance.
7. Statement of compliance with the Code of Practice for Statistics
The Code of Practice for Statistics (the Code) is built around 3 main concepts, or pillars:
- Trustworthiness – is about having confidence in the people and organisations that publish statistics
- Quality – is about using data and methods that produce statistics
- Value – is about publishing statistics that support society’s needs
The following explains how we have applied the pillars of the Code in a proportionate way.
Trustworthiness
Employment Data Lab reports, such as this, are published to provide User Organisations with an estimate of the impact of their programmes that support employment. Releasing them via an ad hoc publication will give equal access to all those with an interest in them.
Quality
The methodology used to produce the information in this report has been developed by DWP analysts in conjunction with the Institute for Employment Studies. The information is based on data from the User Organisation and Government administrative data. The calculations have been quality assured by DWP analysts to ensure they are robust.
Value
Producing and releasing these estimates provides User Organisations and the public with useful information about employment support provision that they may not have otherwise been able to generate or obtain.
Appendix A: Exclusions from the treatment group
Nottingham City Council shared data on 3,699 participants who took part in the programme between April 2021 and December 2023. The main impact analysis focussed on a subset of these participants who were aged between 18 and 24 years old when they started the programme and started the programme on or before 1 April 2022. This was to ensure that participants were unlikely to be in compulsory full-time education one year and two years after starting the programme and had at least two full years of labour market outcomes in the data available.
Figure 3 shows the distribution of programme start dates for all 3,699 programme participants, along with reasons for exclusion from the analysis. Blue bars show the start dates for the participants who could be matched to a National Insurance Number (NINO) and were 18 or older when they started the programme. For participants starting on or before April 2022, the start date distribution is fairly even, aside from an initial spike.
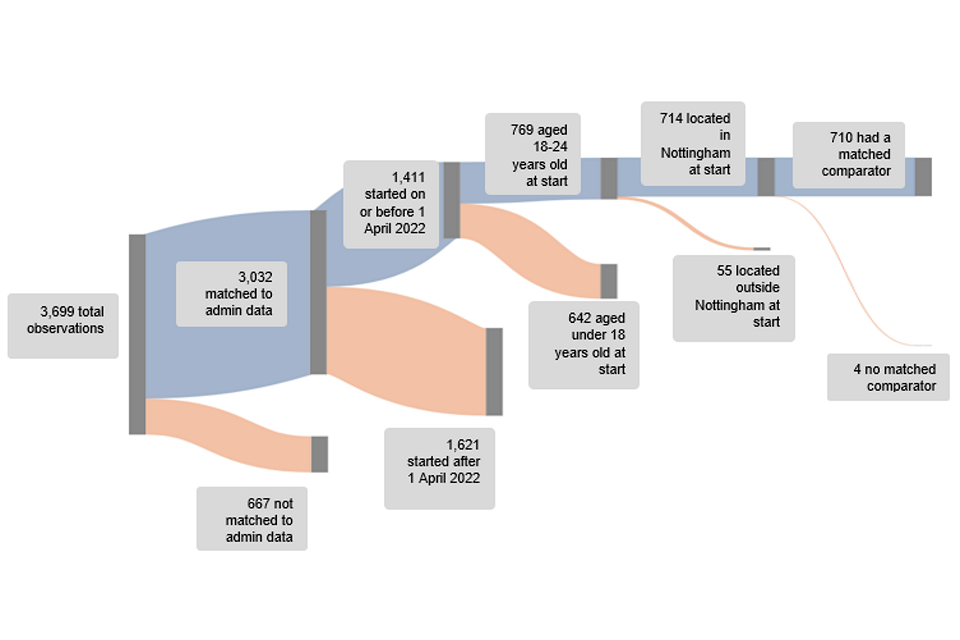
Figure 4 shows the stages that individuals were excluded from the analytical process. The final group of 710 participants, comprising the main analysis group used in the PSM, represent approximately 50% of the matched participants who took part during the relevant period.
Figure 3 shows the distribution of start dates of the programme participants
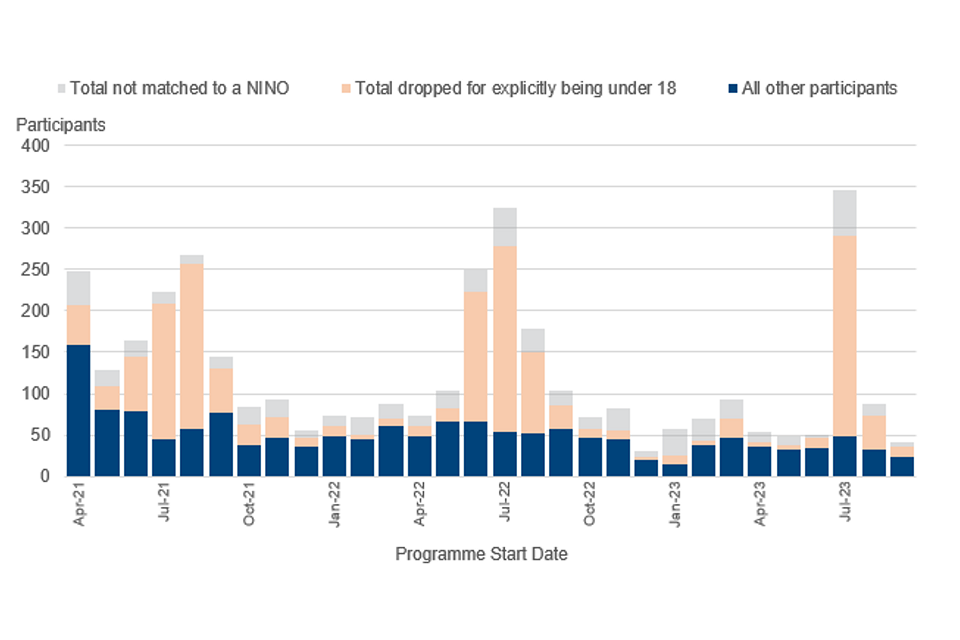
Figure 4 presents a diagram showing the numbers of participants and the stages at which they were excluded from the analysis
Appendix B: Participant group information
The following table displays the participant group information for the full analysis sample who could be matched to administrative data. This is then broken down into the “evaluated”; those who were selected for the evaluation, the “non-evaluated”; those who were excluded from the evaluation, and “all” of the participants, for whom data was available. This table only includes participants who could be linked to the administrative data.
Table 5: Showing characteristics, benefits and employment information for the participant group (%)
| Variable | Evaluated | Non-Evaluated | All |
|---|---|---|---|
| Observations | 710 | 2,322 | 3,032 |
| Age (mean years) | 20.4 | 17.5 | 18.2 |
| <18 years (%) | 0 | 67 | 51 |
| 18-24 years (%) | 100 | 33 | 49 |
| 25-30 years (%) | 0 | 0 | 0 |
| >30 years (%) | 0 | 0 | 0 |
| Male (%) | 58 | 58 | 58 |
| Dependent children marker (%) | x | x | x |
| SEN marker set (%) | 40 | 29 | 32 |
| FSM marker set (%) | 47 | 43 | 44 |
| Care leaver/adopted marker (%) | 9 | 7 | 8 |
| Child in need marker (%) | 20 | 16 | 17 |
| Exclusion marker (%) | 22 | 21 | 21 |
| Permanent exclusion marker (%) | x | x | 1 |
| Housing benefit marker (%) | 15 | 4 | 7 |
| DLA/PIP marker set (%) | 12 | 7 | 8 |
| White ethnicity (%) | 60 | 58 | 58 |
| Asian ethnicity (%) | 7 | 7 | 7 |
| Black ethnicity (%) | 9 | 10 | 10 |
| Mixed ethnicity (%) | 10 | 11 | 11 |
| Other ethnicity (%) | 14 | 14 | 14 |
| Entry level qualification (%) | 88 | 67 | 72 |
| Level 1 qualification (%) | 84 | 66 | 70 |
| Level 2 qualification (%) | 66 | 52 | 55 |
| Level 3 qualification (%) | 19 | 8 | 10 |
| Level 4 qualification (%) | 5 | 2 | 2 |
| Level 5 qualification (%) | 4 | 1 | 2 |
| Level 6 qualification (%) | x | x | x |
| Level 7 qualification (%) | x | x | x |
| Level 8 qualification (%) | x | x | x |
| Enrolled in education start (%)* | 28 | 24 | 25 |
| “Employed” in the month before start (%)* | 21 | 13 | 15 |
| “Looking for Work” in the month before start (%) | 66 | 18 | 30 |
| “Inactive” in the month before start (%) | 11 | 3 | 5 |
| “Other” in the month before start (%) | 17 | 69 | 57 |
| Number of months “Employed” in the previous two years | 5 | 3 | 3 |
| Number of months “Looking for Work” in the previous two years | 9 | 2 | 4 |
| Number of months “Inactive” in the previous two years | 2 | 1 | 1 |
| Number of months “Other” in the previous two years | 3 | 14 | 12 |
Note: Some figures which have been suppressed for disclosure control purposes are denoted by an x.
*Percentage enrolled in education is based on presence in certain administrative datasets and is not necessarily reflective of the results of NW4You referral assessments conducted by Nottingham City Council. For example, education flags may show individuals are present in administrative data but may not reflect actual school attendance.
*Employment flags are generated for individuals present in administrative datasets but may not reflect current employment status for some individuals such as those on zero hour contracts with no earnings.
Appendix C: Matching the comparison group
The analysis in the report uses a technique called propensity score matching to construct a comparison group of individuals that are matched on key characteristics that are linked to a person’s participation in the Programme and the outcome variables of interest. More information about this technique and how it is used in the Data Lab can be found in the methodology report.
Before proceeding with the analysis, the Data Lab team assessed the plausibility of constructing a comparison group that satisfies the conditional independence assumption that underlies PSM (see methodology report for more details). The programme was targeted at individuals with characteristics that were largely well represented in the available data.
The comparison pool was selected from the Department for Education’s (DfE) administration data and was restricted to only include individuals who were in the same age range as the participants at the time of the programme start. This group was then randomly assigned a pseudo-start date (in lieu of an actual start date) in a way that matched the distribution of participant start dates. This group was then reduced further in a number of steps:
- firstly, individuals who were known to have participated in other ESF programmes were excluded
- the group was then restricted to geographic locations that were similar to, but excluded, the locations that the programme was delivered in. The selection of these locations was based on cluster analysis that used local labour market characteristics and indicators to group Local Authorities in Great Britain into 14 groups. See Appendix D for more info
- the comparison pool was restricted further by stratified sampling that matched the distributions of the comparison and participant groups on their education and employment status at programme start/pseudo-start
These steps resulted in a comparison pool of approximately 43,000 individuals who were then used in the matching process.
The matching estimator used to generate the impact estimates presented in this report was nearest neighbour matching using 100 nearest neighbours and a bandwidth of 0.01. Nearest neighbour matching involves running through each participant and matching them with the closest eligible individuals from the comparison pool, determined by closeness of the propensity scores. The sensitivity of the impact estimates to the choice of matching estimator was tested using a range of estimators and found to be insensitive. Further information about matching estimators can be found in the methodology and literature review documents.
Table 6 below shows a sample of the variables used in the matching process and the mean values of these variables both before and after matching. The table shows that before matching, the participant and comparison groups are not well matched, or balanced, as shown by sizeable differences in the mean values. After matching, the mean values of the participant and comparison groups are much closer. The percent bias and p-value columns provide information on how big the residual difference is and if this difference is statistically significant. Ideally one would like the percent biases to be small (below 5%) and there to be no statistically significant differences i.e., p-values above 0.05 (the 95% confidence level threshold).
Table 7 also presents summary statistics that relate to how well matched the participant and comparison groups are for the main run. It shows values for Rubin’s B, Rubin’s R and the maximum and median percent biases, all of which meet commonly accepted thresholds for the selected approach (see the methodology report for more details). The table also shows there were only 4 participants (0.56%) who were off support (had no matched comparator). This is a sufficiently small percentage so as not to raise concerns about the representativeness of the results.
Table 6 showing mean value of each control variable for the main run, before and after matching
| Variable | Unmatched Comparison Group | Unmatched participant group | Matched comparison group | Matched participant group | Percent bias | P value |
|---|---|---|---|---|---|---|
| PIT_SANC_HIST | x | x | x | x | -3.8 | 0.58 |
| DFE_ETHNICITY_MISSING | 7.6 | 12.2 | 11.2 | 12.2 | 3.4 | 0.56 |
| DFE_FSM | 34.4 | 47.2 | 48.7 | 47.1 | -3.3 | 0.54 |
| DFE_CLA | 2.7 | 8.8 | 9.6 | 8.9 | -3.3 | 0.62 |
| SPELL_LFW_m6 | 17.5 | 47.8 | 49.1 | 47.7 | -3.2 | 0.59 |
| DFE_C_start | 16.2 | 19.3 | 18.1 | 19.3 | 3.2 | 0.56 |
| SPELL_LFW_m3 | 17.8 | 55.5 | 56.8 | 55.4 | -3.2 | 0.6 |
| CHAR_INT_MONTH_8 | 18.2 | 7.6 | 8.6 | 7.6 | -3.1 | 0.49 |
| SPELL_LFW_m9 | 16.2 | 42.6 | 43.8 | 42.5 | -3.1 | 0.61 |
| DFE_C_month_m_6 | 21.8 | 22.8 | 21.6 | 22.8 | 2.9 | 0.59 |
| DFE_C_week_m1 | 16.8 | 19.3 | 18.2 | 19.3 | 2.9 | 0.59 |
| SPELL_LFW_m1 | 18.3 | 66.2 | 67.3 | 66.1 | -2.8 | 0.63 |
| SPELL_LFW_m2 | 18.0 | 59.8 | 61.0 | 59.8 | -2.7 | 0.64 |
| DFE_A_month_m_12 | 20.9 | 23.4 | 22.2 | 23.3 | 2.7 | 0.61 |
| DFE_C_month_m_9 | 26.7 | 25.8 | 24.7 | 25.9 | 2.7 | 0.6 |
| SPELL_LFW_m18 | 8.9 | 25.4 | 26.1 | 25.2 | -2.6 | 0.68 |
| CHAR_INT_MONTH_12 | 3.4 | 4.9 | 4.4 | 4.9 | 2.6 | 0.64 |
| SPELL_LFW_m21 | 7.5 | 20.6 | 21.3 | 20.4 | -2.6 | 0.68 |
| DFE_CIN | 8.9 | 19.9 | 20.9 | 20.0 | -2.5 | 0.68 |
| DFE_SEN | 26.2 | 39.9 | 41.3 | 40.1 | -2.5 | 0.65 |
| DFE_C_month_m_3 | 20.2 | 21.8 | 20.8 | 21.8 | 2.4 | 0.65 |
| PIT_INT_START | 4.1 | 21.3 | 22.0 | 21.2 | -2.4 | 0.73 |
| CHAR_INT_MONTH_7 | 14.6 | 5.7 | 6.5 | 5.8 | -2.4 | 0.58 |
| SPELL_HIST_HB | 6.0 | 15.1 | 15.9 | 15.2 | -2.3 | 0.72 |
| SPELL_LFW_m12 | 14.4 | 36.1 | 36.9 | 36.0 | -2.1 | 0.74 |
| SPELL_HIST_PIP | 8.2 | 11.8 | 12.3 | 11.7 | -2 | 0.73 |
| dfe_level_1_start | 92.3 | 83.5 | 84.0 | 83.4 | -1.9 | 0.75 |
| SPELL_LFW_m15 | 11.8 | 30.5 | 31.1 | 30.4 | -1.9 | 0.76 |
| SPELL_WORK_m1 | 28.9 | 21 | 20.3 | 21.1 | 1.8 | 0.71 |
| DFE_A_start | 10.2 | 10.8 | 10.3 | 10.8 | 1.8 | 0.73 |
| SPELL_Inactive_m9 | 9.9 | 10.8 | 10.3 | 10.8 | 1.8 | 0.74 |
| DFE_ETHNICITY_OTHER | x | x | x | x | 1.7 | 0.72 |
| DFE_C_month_m_12 | 34.5 | 29 | 28.3 | 29.1 | 1.7 | 0.74 |
| DFE_exclusion | 12.7 | 21.6 | 22.1 | 21.5 | -1.6 | 0.79 |
| SPELL_WORK_m3 | 29.6 | 22.7 | 22 | 22.6 | 1.6 | 0.76 |
| CHAR_INT_MONTH_2 | 3.6 | 5.9 | 5.6 | 5.9 | 1.5 | 0.79 |
| SPELL_HIST_CTC | x | x | x | x | -1.5 | 0.81 |
| DFE_ETHNICITY_ASIAN | 24.2 | 7.4 | 8.0 | 7.5 | -1.5 | 0.71 |
| SPELL_Inactive_m6 | 10.6 | 11.2 | 10.8 | 11.3 | 1.5 | 0.78 |
| DFE_A_month_m_24 | 22.6 | 27.9 | 27.2 | 27.8 | 1.5 | 0.79 |
| DFE_ETHNICITY_MIXED | 5 | 9.9 | 10.2 | 9.8 | -1.4 | 0.82 |
| SPELL_Inactive_m3 | 11.4 | 11.6 | 11.2 | 11.7 | 1.4 | 0.79 |
| SPELL_Inactive_m12 | 9.2 | 10.1 | 9.7 | 10.1 | 1.3 | 0.8 |
| SPELL_WORK_m6 | 29 | 22 | 21.4 | 21.9 | 1.3 | 0.79 |
| SPELL_Inactive_m15 | 8.5 | 9.8 | 9.5 | 9.8 | 1.3 | 0.81 |
| SPELL_WORK_m2 | 29.4 | 21.6 | 21.1 | 21.7 | 1.3 | 0.8 |
| DFE_H_month_m_24 | 9.8 | 3.6 | 3.4 | 3.7 | 1.2 | 0.75 |
| CHAR_INT_MONTH_5 | 7.0 | 10.5 | 10.2 | 10.5 | 1.2 | 0.83 |
| SPELL_HIST_EMPLOYMENT | 46.3 | 45.4 | 44.7 | 45.3 | 1.2 | 0.82 |
| SPELL_OTHER_m9 | 49.5 | 36.7 | 36.1 | 36.7 | 1.2 | 0.82 |
| CHAR_INT_MONTH_4 | 14.2 | 21.3 | 20.8 | 21.2 | 1.1 | 0.84 |
| DFE_C_month_m_15 | 37.4 | 30.8 | 30.4 | 30.9 | 1.1 | 0.83 |
| dfe_level_0_start | 94.4 | 88.1 | 88.4 | 88.0 | -1.1 | 0.85 |
| SPELL_LFW_m24 | 6.3 | 17.2 | 17.4 | 17.0 | -1.1 | 0.86 |
| dfe_level_7_start | x | x | x | x | 1 | 0.77 |
| DFE_A_month_m_21 | 26.6 | 28.0 | 28.5 | 28.0 | -1 | 0.85 |
| SPELL_WORK_m18 | 29.2 | 19.5 | 19.1 | 19.5 | 1 | 0.83 |
| DFE_ETHNICITY_WHITE | 56.1 | 59.7 | 60.3 | 59.8 | -1 | 0.85 |
| SPELL_WORK_m21 | 29.2 | 19.5 | 19.1 | 19.5 | 1 | 0.84 |
| SPELL_Inactive_m2 | 11.7 | 11.3 | 11.1 | 11.4 | 1 | 0.86 |
| SPELL_HIST_ESA | x | x | x | x | -0.9 | 0.88 |
| CHAR_INT_MONTH_6 | 9.9 | 10.1 | 9.9 | 10.1 | 0.9 | 0.87 |
| SPELL_HIST_UC | 35.1 | 77 | 77.3 | 76.9 | -0.9 | 0.86 |
| CHAR_INT_YEAR_2021 | 87.0 | 80.5 | 80.9 | 80.6 | -0.9 | 0.88 |
| CHAR_INT_YEAR_2022 | 13.0 | 19.5 | 19.1 | 19.4 | 0.9 | 0.88 |
| CHAR_CHILDREN | x | x | x | x | -0.8 | 0.88 |
| SPELL_Inactive_m1 | 12.0 | 11.3 | 11.1 | 11.4 | 0.8 | 0.87 |
| SPELL_OTHER_m21 | 58.4 | 55.5 | 55.2 | 55.6 | 0.8 | 0.89 |
| DFE_C_month_m_21 | 41.5 | 36.0 | 36.4 | 36.0 | -0.8 | 0.88 |
| dfe_level_4_start | 9.2 | 4.5 | 4.3 | 4.5 | 0.7 | 0.86 |
| SPELL_HIST_DLA | 2.1 | 4.1 | 4.2 | 4.1 | -0.7 | 0.9 |
| DFE_H_month_m_6 | 15.8 | x | x | x | -0.7 | 0.78 |
| SPELL_OTHER_m6 | 47.6 | 32.1 | 31.7 | 32.1 | 0.7 | 0.89 |
| dfe_level_3_start | 49.5 | 18.6 | 18.2 | 18.6 | 0.7 | 0.88 |
| dfe_level_5_start | 8.1 | 3.6 | 3.5 | 3.7 | 0.7 | 0.86 |
| dfe_level_2_start | 84.4 | 66.4 | 66.1 | 66.4 | 0.7 | 0.91 |
| CHAR_SEX | 53.5 | 58.0 | 57.6 | 57.9 | 0.7 | 0.9 |
| SPELL_OTHER_m18 | 56.7 | 50.8 | 50.6 | 50.9 | 0.7 | 0.9 |
| SPELL_OTHER_m3 | 45.6 | 24.5 | 24.3 | 24.6 | 0.7 | 0.89 |
| DFE_ETHNICITY_BLACK | 5.0 | 9.2 | 9.0 | 9.1 | 0.7 | 0.91 |
| DFE_H_month_m_21 | 11.3 | 3.5 | 3.3 | 3.5 | 0.7 | 0.86 |
| SPELL_WORK_m24 | 27.6 | 17.9 | 17.7 | 18 | 0.7 | 0.89 |
| SPELL_HIST_IS | x | x | x | x | -0.6 | 0.92 |
| CHAR_AGE_SQ | 411.9 | 418.9 | 418.2 | 418.7 | 0.6 | 0.91 |
| DFE_H_month_m_3 | 15.8 | x | x | x | -0.6 | 0.79 |
| dfe_level_6_start | 7.4 | 3.4 | 3.2 | 3.4 | 0.6 | 0.89 |
| CHAR_AGE | 20.2 | 20.4 | 20.4 | 20.4 | 0.6 | 0.92 |
| SPELL_WORK_m12 | 28.4 | 17.4 | 17.2 | 17.4 | 0.6 | 0.91 |
| PIT_INT_HIST | 5.7 | 16.4 | 16.5 | 16.3 | -0.6 | 0.93 |
| DFE_H_week_m1 | 14.7 | x | x | x | -0.5 | 0.8 |
| SPELL_OTHER_m1 | 45.1 | 16.5 | 16.4 | 16.6 | 0.5 | 0.9 |
| DFE_H_month_m_9 | 14.2 | x | x | x | -0.5 | 0.84 |
| SPELL_OTHER_m2 | 45.4 | 22.4 | 22.1 | 22.4 | 0.5 | 0.91 |
| DFE_H_start | 14.6 | x | x | x | -0.5 | 0.82 |
| DFE_C_month_m_18 | 39.2 | 33.3 | 33.2 | 33.5 | 0.5 | 0.93 |
| SPELL_HIST_WTC | x | x | x | x | 0.5 | 0.93 |
| DFE_A_month_m_3 | 16.8 | 12.9 | 13.1 | 12.9 | -0.5 | 0.93 |
| DFE_H_month_m_15 | 12.7 | 3.4 | 3.5 | 3.4 | -0.5 | 0.9 |
| SPELL_Inactive_m18 | 7.7 | 9.7 | 9.6 | 9.7 | 0.4 | 0.94 |
| DFE_H_month_m_12 | 12.3 | 2.5 | 2.6 | 2.5 | -0.4 | 0.9 |
| SPELL_HIST_JSA | 0.6 | 4.6 | 4.3 | 4.4 | 0.4 | 0.95 |
| SPELL_OTHER_m15 | 54.3 | 45.8 | 45.7 | 45.9 | 0.4 | 0.94 |
| CHAR_INT_MONTH_11 | 5.1 | 6.0 | 6.0 | 6.0 | 0.4 | 0.95 |
| CHAR_INT_MONTH_9 | 10.2 | 9.7 | 9.8 | 9.7 | -0.4 | 0.95 |
| DFE_A_month_m_15 | 26.9 | 26.6 | 26.7 | 26.6 | -0.4 | 0.95 |
| CHAR_INT_MONTH_1 | 4.2 | 5.5 | 5.6 | 5.5 | -0.3 | 0.95 |
| SPELL_OTHER_m12 | 52.0 | 42.3 | 42.2 | 42.3 | 0.3 | 0.95 |
| SPELL_WORK_m15 | 28.6 | 19.6 | 19.6 | 19.7 | 0.3 | 0.95 |
| CHAR_INT_MONTH_3 | 5.1 | 7.7 | 7.7 | 7.6 | -0.3 | 0.96 |
| DFE_C_month_m_24 | 46.7 | 42.2 | 42.3 | 42.2 | -0.2 | 0.96 |
| SPELL_Inactive_m24 | 6.2 | 8.1 | 8.2 | 8.2 | -0.2 | 0.97 |
| DFE_H_month_m_18 | 12.5 | 3.1 | 3.1 | 3.1 | -0.2 | 0.96 |
| SPELL_WORK_m9 | 28.9 | 19.6 | 19.5 | 19.5 | 0.1 | 0.98 |
| SPELL_HIST_ICA | 2.8 | 3.5 | 3.5 | 3.5 | -0.1 | 0.98 |
| DFE_A_month_m_9 | 19.9 | 19.0 | 19.0 | 19.0 | -0.1 | 0.98 |
| CHAR_INT_MONTH_10 | 4.6 | 5.2 | 5.1 | 5.1 | -0.1 | 0.99 |
| DFE_A_month_m_6 | 19.1 | 17.9 | 17.8 | 17.9 | 0.1 | 0.99 |
| SPELL_OTHER_m24 | 61.5 | 59.8 | 59.9 | 59.9 | 0.1 | 0.99 |
| DFE_A_week_m1 | 10.8 | 10.2 | 10.3 | 10.3 | -0.1 | 0.99 |
| SPELL_Inactive_m21 | 6.9 | 8.4 | 8.5 | 8.4 | -0.1 | 0.99 |
| DFE_A_month_m_18 | 28.6 | 30.1 | 30.1 | 30.1 | 0 | 1 |
| DFE_permanent | x | x | x | x | 0 | 1 |
| CHAR_INT_YEAR_2023 | x | x | x | x | 0 | 1 |
| SPELL_HIST_CHB_PARENT | x | x | x | x | 0 | 1 |
| SPELL_HIST_BB | x | x | x | x | 0 | 1 |
| SPELL_HIST_BSP | x | x | x | x | 0 | 1 |
| SPELL_HIST_IB | x | x | x | x | 0 | 1 |
| SPELL_HIST_PIB | x | x | x | x | 0 | 1 |
| SPELL_HIST_SDA | x | x | x | x | 0 | 1 |
| SPELL_HIST_WB | x | x | x | x | 0 | 1 |
| PIT_REF_START | x | x | x | x | 0 | 1 |
| PIT_REF_START | x | x | x | x | 0 | 1 |
| DFE_ETHNICITY_CHINESE | x | x | x | x | 0 | 1 |
| dfe_level_8_start | x | x | x | x | 0 | 1 |
Note: Some figures which have been suppressed for disclosure control purposes are denoted by an x.
Note: The definition of the matching variables can be found in the methodology document.
Table 7: PSM summary statistics used to assess the success of the matching for the main analytical run
| Summary Statistics | |
|---|---|
| Matching estimator | 100 Nearest Neighbours |
| bandwidth/calliper | 0.01 |
| Rubin’s B | 13.82 |
| Rubin’s R | 0.92 |
| Max % bias | 3.98% |
| Median % bias | 0.87% |
| Number on support | 710 |
| Number off support | 4 |
| Percent off support | 0.56% |
Appendix D: Regional cluster analysis
For all of the analysis presented in this report the comparison pool was selected from outside the regions where the programme was implemented. As discussed in the methodology report, care must be taken when doing this as local factors such as the availability of employment and public transport, levels of disadvantage, etc. all have an impact on the likelihood of someone finding and maintaining employment.
This analysis took advantage of cluster analysis carried out within DWP that groups the Local Authorities of Great Britain into 14 groups based on a range of variables about key features of the local labour market. These include local employment rates, unemployment-related benefit caseload, qualification levels, variables related to mental and physical health / disability characteristics of the local population.
This cluster information was used as a way of selecting the comparison pool from “similar” regions of Great Britain, and as a control variable in the propensity score matching.
Appendix E: Tables of results
Table 8: Showing the full list of generated results for the main run featuring all participants aged 18 to 24 who started the programme before 1 April 2022
| Outcome measure | Participant group | Comparison group | Impact central | Impact lower | Impact upper | p-value |
|---|---|---|---|---|---|---|
| no. months at 1 year – “Employed” | 5.3 | 4.0 | 1.3 | 0.9 | 1.6 | 0.00 |
| no. months at 1 year – “Looking for “Work” | 7.0 | 5.7 | 1.3 | 1.0 | 1.7 | 0.00 |
| no. months at 1 year – “Inactive” | 1.7 | 2.2 | -0.6 | -0.9 | -0.3 | 0.00 |
| no. months at 1 year – “Other” | 1.3 | 2.0 | -0.7 | -0.9 | -0.4 | 0.00 |
| no. months at 2 years – “Employed” | 10.6 | 8.5 | 2.2 | 1.4 | 2.9 | 0.00 |
| no. months at 2 years – “Looking for Work” | 11.8 | 9.4 | 2.4 | 1.7 | 3.1 | 0.00 |
| no. months at 2 years – “Inactive” | 4.1 | 5.4 | -1.3 | -2.0 | -0.7 | 0.00 |
| no. months at 2 years – “Other” | 2.5 | 3.8 | -1.3 | -1.8 | -0.8 | 0.00 |
| % employed during 1 year | 66.9 | 51.1 | 15.8 | 12.1 | 19.5 | 0.00 |
| % employed during 2 years | 71.8 | 58.4 | 13.4 | 9.9 | 16.9 | 0.00 |
| % at 1 year – “Employed” | 47.3 | 36.7 | 10.7 | 6.8 | 14.5 | 0.00 |
| % at 2 years – “Employed” | 41.4 | 36.8 | 4.6 | 0.8 | 8.4 | 0.02 |
| % at 1 year – “Looking for Work” | 47.9 | 37.5 | 10.4 | 6.6 | 14.2 | 0.00 |
| % at 2 years – “Looking for Work” | 37.2 | 27.5 | 9.7 | 6.0 | 13.4 | 0.00 |
| % at 1 year – “Inactive” | 16.1 | 22.9 | -6.9 | -9.7 | -4.0 | 0.00 |
| % at 2 years – “Inactive” | 23.2 | 29.8 | -6.5 | -9.8 | -3.2 | 0.00 |
| % at 1 year – “Other” | 10.4 | 16.3 | -5.8 | -8.3 | -3.4 | 0.00 |
| % at 2 years – “Other” | 10.4 | 15.5 | -5.1 | -7.5 | -2.6 | 0.00 |
| % at 1 year – “Employed” only | 25.6 | 23.4 | 2.2 | -1.2 | 5.6 | 0.20 |
| % at 2 years – “Employed” only | 29.2 | 27.3 | 1.8 | -1.7 | 5.4 | 0.31 |
| % at 1 year – “Looking for Work” and “Employed” | 19.4 | 11.1 | 8.3 | 5.3 | 11.3 | 0.00 |
| % at 2 years – “Looking for Work” and “Employed” | 9.6 | 6.8 | 2.8 | 0.6 | 5.1 | 0.01 |
| % at 1 year – “Inactive” and “Employed” | x | x | 0.1 | -1.0 | 1.3 | 0.83 |
| % at 2 years – “Inactive” and “Employed” | x | x | 0.0 | -1.3 | 1.2 | 0.98 |
| % at 1 year – “Looking for Work” only | 28.5 | 26.3 | 2.2 | -1.3 | 5.6 | 0.22 |
| % at 2 years – “Looking for Work” only | 27.6 | 20.7 | 6.9 | 3.5 | 10.3 | 0.00 |
| % at 1 year – “Inactive” only | 13.8 | 20.8 | -7.0 | -9.7 | -4.3 | 0.00 |
| % at 2 years – “Inactive” only | 20.6 | 27.0 | -6.5 | -9.6 | -3.3 | 0.00 |
| % at 1 year – “Looking for Work” and “Inactive” | x | x | x | x | x | 0.04 |
| % at 2 years – “Looking for Work” and “Inactive” | x | x | x | x | x | 0.58 |
| % at 1 year – “Other” only | 10.4 | 16.3 | -5.8 | -8.3 | -3.4 | 0.00 |
| % at 2 years – “Other” only | 10.4 | 15.5 | -5.1 | -7.5 | -2.6 | 0.00 |
| % on other DWP intervention during 1 year after start | 51.0 | 23.1 | 27.9 | 24.1 | 31.6 | 0.00 |
| % on other DWP intervention during 2 years after start | 59.3 | 32.3 | 27.0 | 23.3 | 30.8 | 0.00 |
| % on Kickstart during the 1 year after start | 25.9 | 6.8 | 19.1 | 15.8 | 22.4 | 0.00 |
| % on Restart during the 1 year after start | 9.3 | 5.1 | 4.2 | 2.0 | 6.4 | 0.00 |
| % on Restart during the 2 years after start | 16.3 | 9.1 | 7.2 | 4.4 | 10.0 | 0.00 |
| % on Youth Offer during the 1 year after start | 11.0 | 10.1 | 0.9 | -1.5 | 3.3 | 0.45 |
| % on Youth Offer during the 2 years after start | 20.3 | 17.8 | 2.5 | -0.6 | 5.6 | 0.11 |
Note: Some figures which have been suppressed for disclosure control purposes are denoted by an x.
Appendix F: Glossary of Terms
| Term | Definition |
|---|---|
| Common support/ On Support/ Off support | Once propensity scores have been assigned for each observation, the overlap of propensity scores between the participants and comparison group is called ‘common support’. Those who fall in the overlap are referred to as ‘on support’, those who do not fall into the overlap are ‘off support’. |
| Comparison group | Carefully selected subset of the comparison pool, selected to have outcomes as similar as possible, to act as a counterfactual. |
| CIN | Child in Need |
| DfE | Department for Education |
| DLA | Disability Living Allowance |
| DWP | The Department for Work and Pensions |
| ESA | Employment and Support Allowance |
| ESF | European Social Fund |
| FSM | Free School Meals |
| NW4You | Nottingham Works 4You |
| JSA | Jobseeker’s Allowance |
| NEET | Not in Employment, Education or Training |
| Participant group | The people who took part in the programme being evaluated. |
| PIP | Personal Independence Payment |
| Programme | The employment support provision under investigation. |
| Pseudo-start date | Dates assigned to the comparison pool in lieu of the real programme start dates of the participant group. |
| PSM | Propensity Score Matching |
| Quasi-Experimental | An experimental technique that looks to establish a cause and effect relationship between two variables, where the assignment to the participant or comparison group is not random. |
| Rubin’s B & R | A test used to evaluate the matching in PSM. |
| SEN | Special Educational Needs |
| Statistically significant | Describes a result where the likelihood of observing that result by chance, where there is no genuine underlying difference, is less than a set threshold. In the Data Lab reports, this is set at 5%. |
| UC | Universal Credit |
| User Organisation | The organisation using the employment data lab service. |
-
See Kickstart Scheme: A Quantitative Impact Assessment - GOV.UK (www.gov.uk) for more details on the positive impact of Kickstart on participants’ employment outcomes. ↩
-
See European Social Fund and Youth Employment Initiative 2021 to 2023 Leavers Survey Report – GOV.UK for more information. ↩