Employment Data Lab Analysis: Generation You Employed UK
Published 20 November 2024

© Crown copyright 2024
This publication is licensed under the terms of the Open Government Licence v3.0 except where otherwise stated. To view this licence, visit nationalarchives.gov.uk/doc/open-government-licence/version/3 or write to the Information Policy Team, The National Archives, Kew, London TW9 4DU, or email: psi@nationalarchives.gov.uk.
Where we have identified any third party copyright information you will need to obtain permission from the copyright holders concerned.
This publication is available at https://www.gov.uk/government/statistics/employment-data-lab-analysis-generation-you-employed-uk/employment-data-lab-analysis-generation-you-employed-uk
This Employment Data Lab report presents descriptive statistics and outcomes information for participants of employment support programmes provided by registered charity Generation: You Employed, UK (henceforth referred to as Generation) between 5 March 2019 and 1 April 2022.
The main body of this report does not present an estimate of the impact of Generation’s programmes, so the outcomes presented cannot be used to infer the causal effect of the programme upon employment. The report does provide information about the participants and their labour market interactions before and after participation.
1. What you need to know
What is the Employment Data Lab?
The Employment Data Lab is a service provided by a team of analysts at the Department for Work and Pensions (DWP). The Data Lab provides group-level benefits and employment information to organisations who have worked with people to help them into employment. The purpose is to provide these organisations with information to help them understand the impact of their programmes. In this case an impact evaluation was not deemed feasible so only participant outcomes information has been provided (see Appendix A for more details).
Who are Generation?
Generation is a charity, incorporated in 2017, that primarily works with diverse, unemployed and underemployed people over the age of 18 facing barriers to employment. Generation delivers a model of free, profession-specific train-and-place training programmes, or “bootcamps”, of approximately 1 to 3 months in length with wrap-around pastoral support and supported job search including matchmade interviews with employer partners aiming to place participants in entry-level, middle-skill roles. They deliver at a national scale under the Department for Education’s “Skills Bootcamp” programme. Generation’s range of bootcamps span the digital and technology, healthcare, and customer services and sales sectors. At the time of analysis, they included:
-
cloud support engineer
-
software engineer pre-apprenticeship
-
data engineer
-
data analyst
-
IT support
-
healthcare assistant
-
customer support
-
retrofit advisor (a ‘green jobs’ programme)
The courses, delivered remotely, provide approximately 150 to 400 hours of learning to 20 to 25 learners at a time. They are practice-based, including real examples and real case studies from employers in the target sectors. Courses teach technical skills as well as, employability skills (for example, CV writing, interview skills), and behavioural skills and mindsets identified as key to securing and succeeding in target roles. Participants also have regular one-to-one sessions with mentors and coaches while on the programmes to make plans to manage and help them with any challenges to course attendance and success. This could include supporting with learning disabilities, mental health challenges, physical disabilities, and/or personal or family issues, for example. Where participants do not have access to the required technology, Generation provides laptops and Wi-Fi connections (via dongles) for learners to access courses.
Once they complete courses, participants receive post-programme support from employability coaches and placement managers as part of a ‘placement phase’. Here they are matched to employment opportunities with Generation’s employer partners and guided to apply for other course-relevant vacancies.
To be eligible for the programme individuals must:
-
be aged 18 or older
-
be living in the area a specific course is offered (Greater London, Greater Manchester, Scotland (Edinburgh/Glasgow), West Midlands, Leeds and Yorkshire)
-
have the legal right to live and work in the UK
-
not currently be in education or training
-
be unemployed, on a zero hour contract, or under-employed (a max of 16 hours per week)
-
be available for full time training over the entire duration of the course (4 to 12 weeks)
-
be ready to start a full-time job straight after the course
-
for some courses, be able to meet other funder requirements (for example, have lived in the UK/EEA for the past 3 years)
Applicants for Generation’s training programmes go through a multi-step application journey before enrolling on a course and receiving training and support. This process is designed to prioritise applicants who face barriers to employment, who have the levels of digital literacy required to succeed on courses and who demonstrate interest and/or motivation in the course and target role.
First individuals must submit an application form containing details to confirm eligibility based on the above criteria. Once the application form has been reviewed and the applicant has been deemed eligible, they can attend information sessions to learn more about the course. Applicants then book onto an interactive online meeting for a group task to look at communication and teamwork skills followed by an individual interview with a member of the Generation team. Applicants may be asked to complete a course-specific assessment typically in the form of a short online quiz. Generation state that these tests do not require prior knowledge, but check applicant ability and willingness to engage with course-relevant material.
If successful at the group task and interview, applicants are invited to have a conversation with someone from the Generation mentorship team to discuss support that would be needed if they are successful in gaining a place on the course. In selection processes, where there are more eligible applications than spaces available on courses Generation state, they prioritise learners facing more barriers to employment, without degrees and learners under the age of 35.
Who was evaluated as part of this analysis?
This analysis focuses on 1,090 individuals who were enrolled in a Generation course between 5 March 2019 and 1 April 2022, including those who did not complete courses.
This is a subset of the 1,588 participants whose data was originally shared with DWP. It does not include applicants who were not enrolled on a Generation training course. Applicants could be screened out before enrolment if they were deemed ineligible, voluntarily withdrew from the application process prior to successfully gaining a place on the course, or were deemed not a good fit for the programme during the group task, interview or other assessments (more information on this is included in Appendix A).
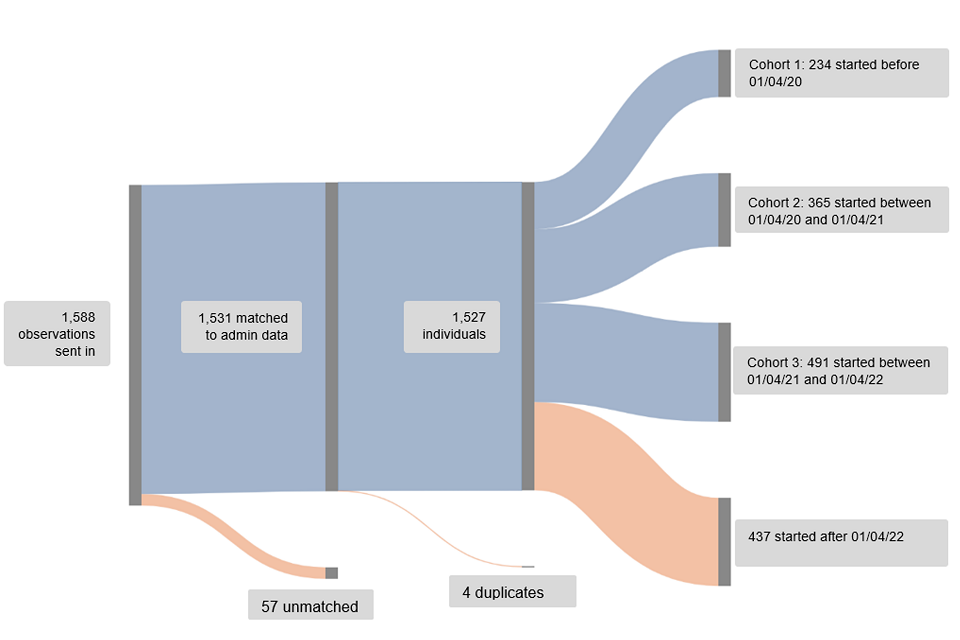
Figure 1 shows the numbers and reasons for course participant exclusions from the analysis. Primarily data was restricted to those who started on a programme before 1 April 2022 to ensure that one full year of employment follow-up data was available at the time of carrying out the analysis. This shows that most participants could be matched to the admin data and that of the excluded participants most were excluded because they started a course after 1 April 2022.
Figure 1: Sankey diagram showing the participant data shared along with the numbers and reasons for exclusions from the analysis
The data includes participants who started on the programme before, during and in the wake of the COVID 19 pandemic. The pandemic and the associated lockdowns which took place between March 2020 and the Summer of 2021 had significant impacts on the UK labour market, with large swings in employment, unemployment, and inactivity rates[footnote 1]. To explore the impacts of the pandemic on the participants and their outcomes the data were split into 4 groups as follows:
Cohort 1
Those who started before 1 April 2020, whose labour market history is unaffected by the COVID 19 pandemic but whose one-year follow-up data will have been.
Cohort 2
Those who started between 1 April 2020 and 1 April 2021. This will include participants whose selection will have been during the COVID 19 pandemic and subsequent lockdowns.
Cohort 3
Those who started between 1 April 2021 and 1 April 2022. This will include participant who were selected as lockdown restrictions were easing, or who were selected after lockdown restrictions ended.
All Cohorts
Those who started before 1 April 2022. An aggregation of the above 3 cohorts, ensuring that one full year of follow-up data is available.
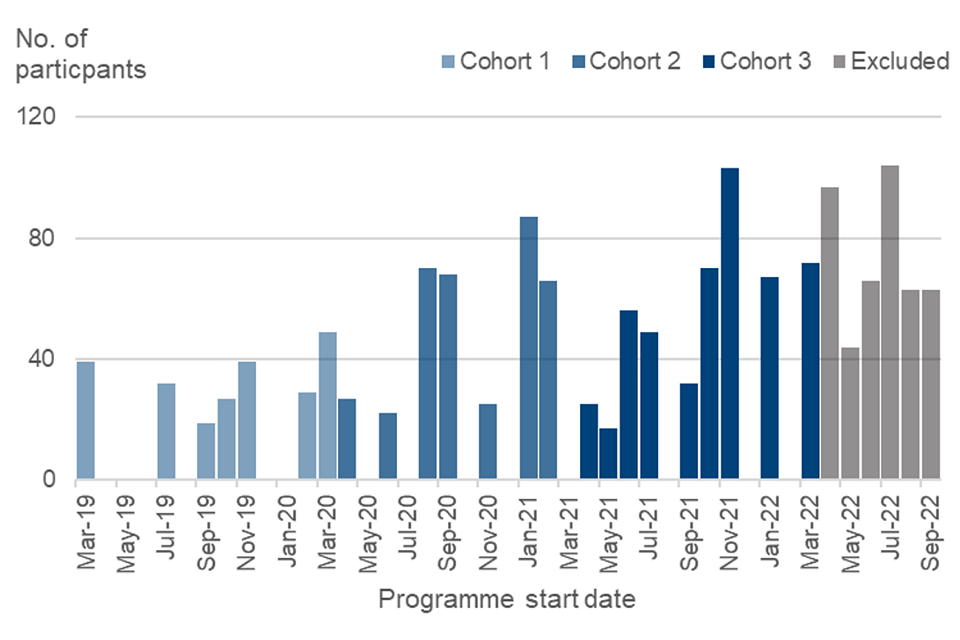
Figure 2 shows the distribution of matched start dates shared with DWP. The figure shows the numbers growing between 2019 and 2022.
Figure 2: showing the distribution of start dates for Generation programme participants. The three different cohorts and those who were excluded from the analysis due to a lack of available follow-up data are highlighted.
The analysis in this report
A key aim of the Employment Data Lab is to provide estimates of the causal impact of employment support programmes. Such an estimate has not been included in this report as the administrative data available was not deemed sufficient, by the Data Lab team, to fully control for the multi-stage, selection process that Generation’s participants must go through before joining the programme. The process is intensive, screening out approximately 87% of applicants over multiple assessment rounds. This decision is discussed further in appendix A. This report still provides useful information about the programme, its participants, and their outcomes.
2. Participant characteristics
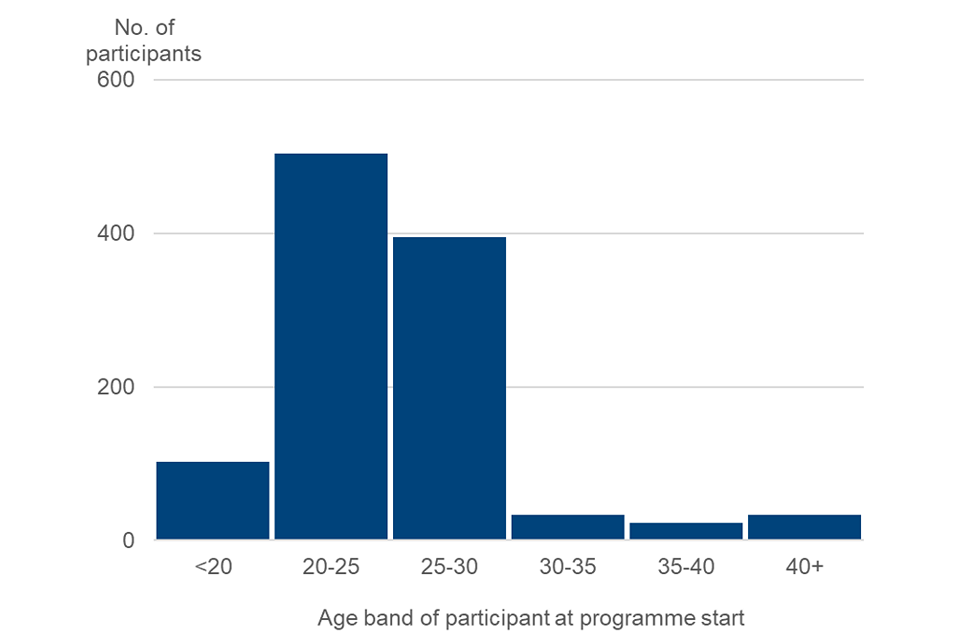
Table 1 below shows characteristics of the programme participants based on the available administrative data. It shows that the majority of participants (59%) are male and (61%) claiming looking-for-work benefits at programme start with an average age at starting the programme of 25 years. Figure 3 shows the distribution of ages of participants on starting a programme with Generation. The range spans participants from 18 up to the early 60’s, with the majority of participants being aged 18 to 30. Generation opened its training courses up to those over 30 years of age part way through the analysis period, in Autumn 2021.
Table 1 shows the labour market status of participants on starting the programme. It shows that of the full cohort who started before April 2022: 26% were recorded as being in employment on starting the programme, 61% were on a looking-for-work benefit, 5% were on an inactivity benefit and 19% were in the other category (see section 5 for details of the labour market categorisation).
This table also shows differences in characteristics and histories between cohorts. One big difference between cohorts is in educational attainment. Of those who started between April 2020 and April 2021 (Cohort 2), 38% had passed a degree level course (level 6 or higher) before starting the programme. This is 15 percentage points higher than those who started before April 2020 (Cohort 1), and 15 percentage points higher than those who started after April 2021 (Cohort 3) (differences are calculated using unrounded percentages). These differences were statistically significant.
Table 1: Participant characteristics. The table shows values of a range of characteristics broken down into each cohort.
| Cohort 1 | Cohort 2 | Cohort 3 | All Cohorts | |
|---|---|---|---|---|
| Start date period | before 1 April 2020 | 1 April 2020 to 1 April 2021 | 1 April 2021 to 1 April 2022 | before April 2022 |
| Number of participants | 234 | 365 | 491 | 1,090 |
| Male (%) | 55 | 61 | 60 | 59 |
| Mean age (years) | 23.5 | 23.7 | 26.4 | 24.9 |
| Eligible for free school meals (%) | 32 | 30 | 25 | 28 |
| Special educational needs (SEN) provision (%) | 24 | 15 | 18 | 19 |
| Degree holder (%) | 23 | 38 | 22 | 28 |
| Ethnicity white (%) | 31 | 19 | 18 | 21 |
| Ethnicity black (%) | 29 | 28 | 21 | 25 |
| Ethnicity Asian (%) | 16 | 25 | 21 | 21 |
| Ethnicity other including missing (%) | 24 | 28 | 40 | 33 |
| In work at start (%) | 29 | 24 | 26 | 26 |
| Looking for work at start (%) | 53 | 69 | 59 | 61 |
| Inactive at start (%) | x | x | 6 | 5 |
| Other at start (%) | 22 | 16 | 19 | 19 |
| weeks spent in work (previous 1 year) | 22 | 20 | 17 | 19 |
| weeks spent in work (previous 2 years) | 45 | 44 | 35 | 40 |
| weeks spent Looking for Work (previous 1 year) | 15 | 18 | 22 | 19 |
| weeks spent Looking for Work (previous 2 years) | 21 | 23 | 33 | 27 |
| weeks spent Inactive (previous 1 year) | 2 | 2 | 3 | 2 |
| weeks spent Inactive (previous 2 years) | 5 | 4 | 5 | 5 |
| weeks spent in Other (previous 1 year) | 15 | 16 | 16 | 16 |
| weeks spent in Other (previous 2 years) | 38 | 39 | 39 | 38 |
Note: The information in the table above has been collated from available administrative data. Limitations and variations in the coverage of the data available mean that this information should be used for indicative purposes only.
Note: Employment flags are generated for individuals present in administrative datasets but may not reflect self-identified employment status for some individuals, such as those on zero-hour contracts with no earnings.
Note: Figures may not sum due to rounding.
Note: Figures marked with an x have been supressed for statistical disclosure purposes.
Figure 3: Plot showing the distribution of participant ages at programme start (all starters before April 2022 used in the evaluation).
3. Labour Market Status
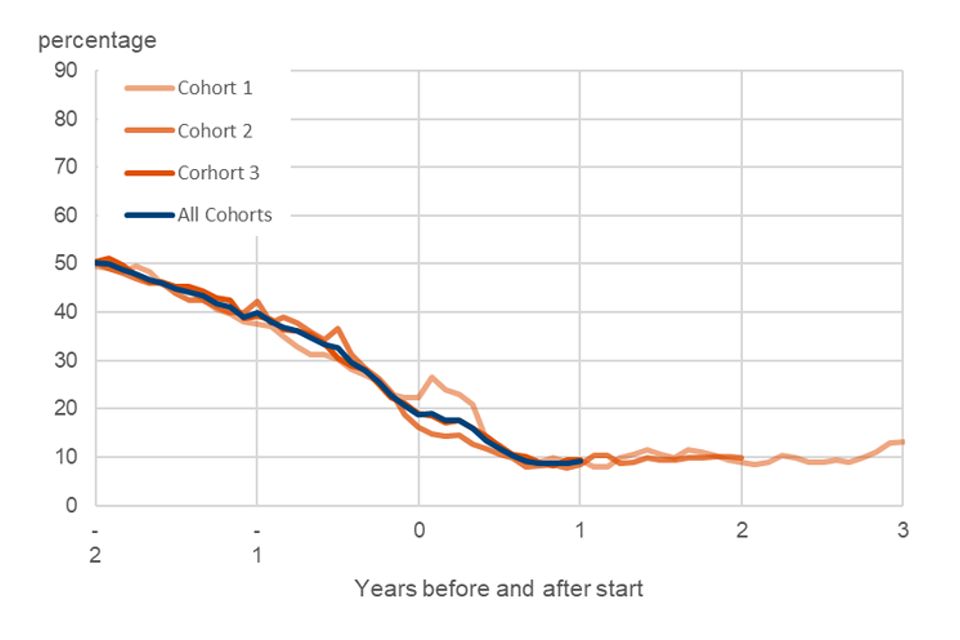
The longitudinal administrative data available to the Data Lab team allow for the labour market status of participants to be followed over several years. Figure 4 shows the percentages of participants in each of the cohorts in the four labour market categories (employed, looking for work, inactive and other) over time. See section 5 for details of the categorisation.
Figure 4 a) shows the percentage of each cohort in employment over the years before and after starting on the programme. The blue line shows the full group of all participants starting before April 2022. This shows a characteristic drop in employment rates as the line approaches the start of the programme, before picking up after people start. This is a common feature of employment programmes as the programmes are often aimed at those who are out of work. Similarly, in Figure 4 b), which shows the rates on a looking-for-work benefit, the line peaks around the point people start on the programme before falling away.
Since no estimation of the counterfactual has been made these plots give no information on the causal impact that the programme has had, but it is possible to explore differences between the cohorts, shown by the orange lines on the plots. Figure 4 a) shows a large spread in employment rates between the first programme participants, cohort 1, and later participants in cohorts 2 and 3. It shows a similar increase in employment rates directly after programme start, but growth in employment rate slows down for cohort 1 at around 6 months while cohorts 2 and 3 follow a similar employment growth trajectory up to 12 months after starting the programme. The percentage of cohort 1 in employment does rise again between 1 and 2 years after start, but it flattens out between year 2 and year 3 and stays below cohort 2 across that time period. Along with lower rates of employment, Figure 4b) shows a larger percentage of cohort 1 claiming looking-for-work benefits in the period after starting the programme. Many factors may be influencing this including the COVID19 pandemic which will have affected availability of employment opportunities.
Figure 4 Plots showing the percentage of each cohort in each of the four labour market categories a) Employment, b) Looking for work, c) Inactive, and d) Other
Figure 4a Employment
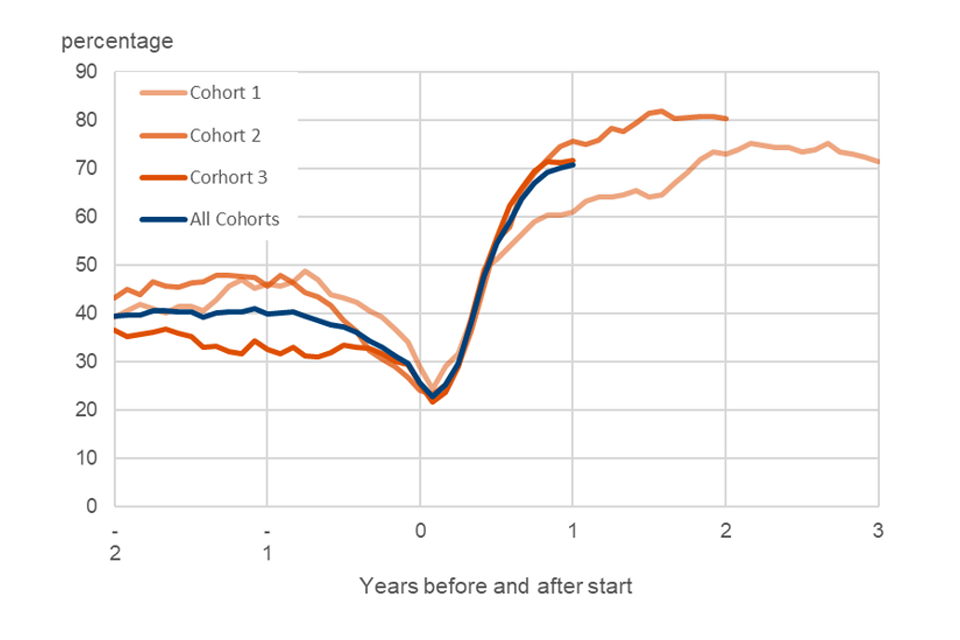
Figure 4b Looking for work
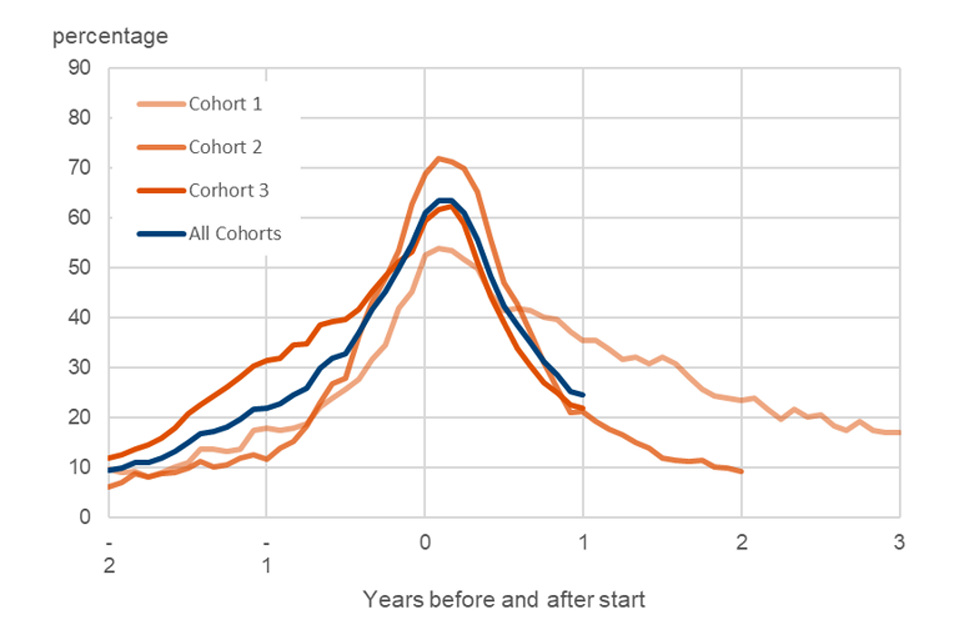
Figure 4c Inactive
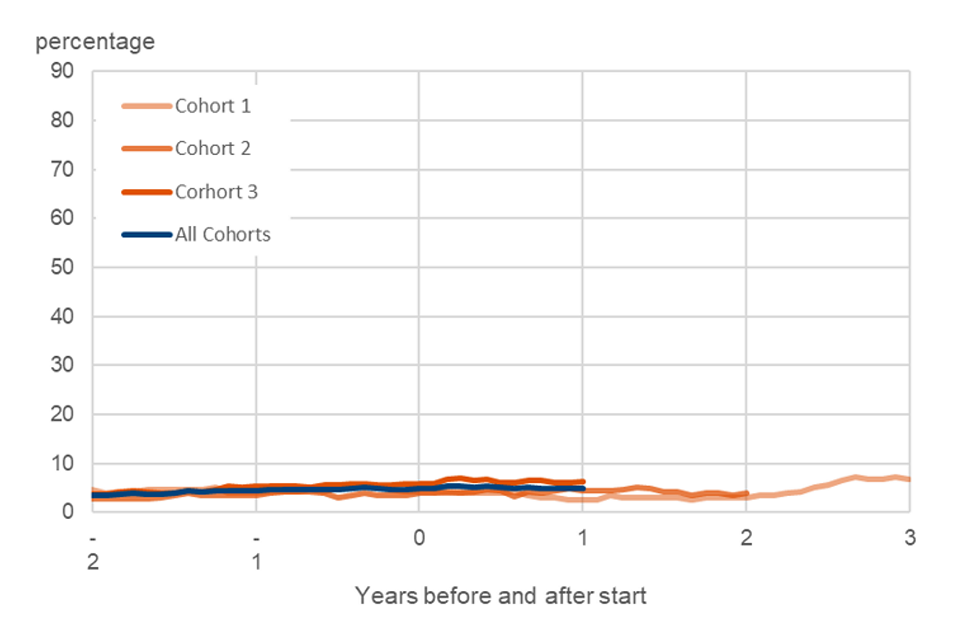
Figure 4d Other
4. Time into Work
The rate of take up of employment can be explored further by looking at the time it takes an individual to enter their first employment spell after starting the programme. This is shown in Figure 5 and Table 2. Figure 5 shows the percentage of people who have entered their first employment during the 52 weeks after starting the programme. Similarly, to the trends noted above, the plot shows that people in the first cohort (cohort 1) initially have higher rates of employment than the other 2 cohorts, but between weeks 26 and 52 the growth rate slows, falling behind the later cohorts. Table 2 Shows the percentages of each cohort finding their first employment in each quarter after starting. The final line shows the total numbers who found work within the first year ultimately ended up lower for cohort 1, with 78%, compared to 82% and 84% for cohorts 2 and 3 respectively.
Figure 5 showing the percentage of people in each cohort entering employment (at least once) during the year after starting. People in the last cohort (cohort 3) appear to be finding work faster and at a higher rate than the other 2 cohorts.
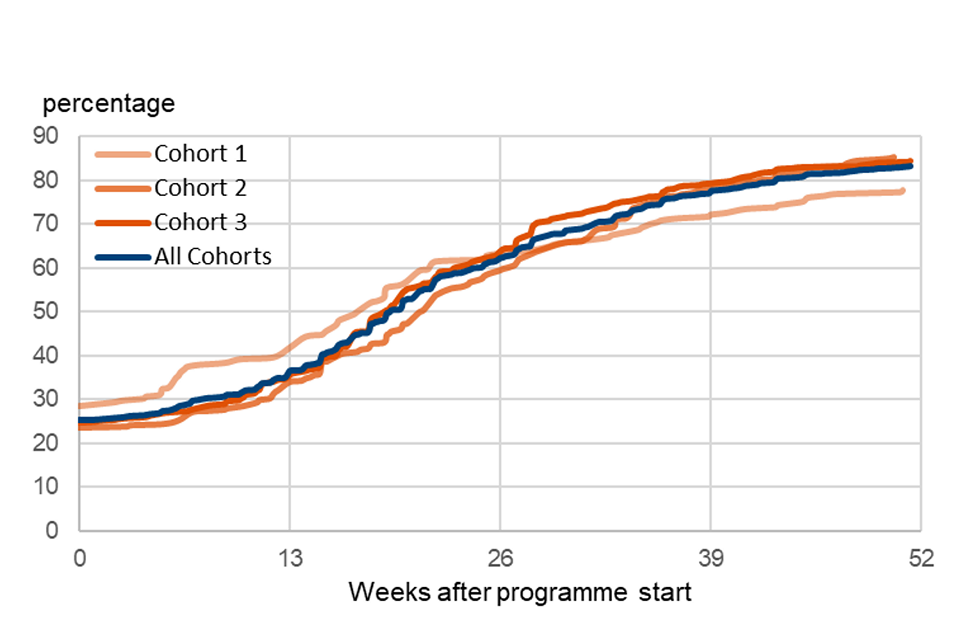
Table 2 showing the percentage of each cohort entering employment for the first time during the four quarters of the year after starting the programme
| Cohort 1 | Cohort 2 | Cohort 3 | All cohorts | |
|---|---|---|---|---|
| In employment at start (%) | 29 | 24 | 25 | 25 |
| Found employment between 0 and 13 weeks after start (%) | 13 | 10 | 11 | 11 |
| Found employment between 13 and 26 weeks after start (%) | 21 | 25 | 28 | 26 |
| Found employment between 26 and 39 weeks after start (%) | x | 19 | 15 | 15 |
| Found employment between 39 and 52 weeks after start (%) | x | 7 | 5 | 6 |
| Total who started in or entered employment during the year after start (%) | 78 | 85 | 84 | 83 |
Note: Figures marked with an x have been supressed for statistical disclosure purposes.
5. Generation in their own words
Our organisation
Generation is a charity with the mission to support diverse people facing barriers to employment into life-changing careers they otherwise could not access.
There are high levels of joblessness, disproportionately falling on those from certain socioeconomic and demographic groups including ethnic minorities, those with disabilities, and those with lower educational outcomes. At the same time there are widespread skills shortages and persistent challenges for employers to find diverse, entry-level talent.
We have set out to fill this gap with.an innovative model of free, full-time, profession-specific bootcamps; with extensive wrap-around mentorship, coaching and pastoral support; and supercharged jobsearch including matchmaking to interviews with our employer partners and help to apply to other vacancies.
Our work focuses on supporting diverse groups facing multiple barriers to employment reached through a wide range of channels. This includes via ‘referral partners’ - including frontline charities, jobcentres, and other employability programmes –, digital marketing and word-of-mouth recommendations.
Our evolving portfolio of programmes across the tech, health and green sectors targets specific professions carefully selected on the basis of employer need. The bootcamps, built in partnership with employers, are intensively equip learners with the technical skills, behaviours and mindsets they need to secure and thrive in good jobs.
We are proud of our position as a charity delivering at scale under the Department for Education’s Skills Bootcamp programme, uniquely and specifically identifying, engaging, and supporting people facing barriers. We are thrilled that this public sector support has been matched with generous contributions from a wide range of philanthropic partners, working together to maximise our impact since our launch in 2019.
Our response to the analysis
Data is at the centre of our work at Generation. It helps us celebrate success, evidence impact and identify areas to improve and increase impact. Data from external evaluations is particularly critical, providing validation and review we could never provide ourselves.
The results of this study are important and stark. Generation skills bootcamps can and do change lives. Overall, this work evidences that Generation supports diverse, people facing barriers to employment, that these learners find work at a high rate, that they find well-paying jobs, and jobs are sustained.
It suggests that Generation’s learners are much more likely to find and stay in work compared with people that did not receive our support, adding to the growing body of evidence of our ‘social’ impact[footnote 2].
This evaluation is also timely with the scaling of the Department for Education Skills Bootcamps programme, evidencing the potential of bootcamps in supporting job outcomes and social mobility at scale..
In detail, we’d highlight that this report:
Evidences that Generation supports diverse groups of people facing barriers to employment:
-
74% of those supported were out of work with no employment income at time of enrolment (the remainder may have had low amounts of zero-hours or part-time work or have become unemployed in the month they enrolled)
-
61% were receiving some kind of ‘looking for work’ benefit
-
72% did not have a degree, 19% had a record of a special educational need, and 28% had evidence of previous free school meals eligibility when at school (with no data available for a further 19%, possibly as they had immigrated to the UK)
Evidences a high level of job outcomes for Generation learners:
- 84% of the learners were placed into work at some point in the first year after enrolling
- an even higher job outcomes rate than we have historically estimated ourselves
- between 91% and even up to 95% of learners, depending on subsample, were employed at some point in the two years after enrolling
Evidences that Generation learners sustain and retain jobs:
-
71% of Generation learners enrolled onto bootcamps in the sample were in work a year after enrolling
-
73 to 80%,depending on subsample, were in work 2 years later
-
the data indicates that most supported learners appear to be working for 10/12 months after they finish our support[footnote 3]
Evidences that Generation learners sustain good jobs with growing income:
-
the average employed Generation learner was earning more than £25.6k per year 18 months after starting the bootcamp, which is higher than the current annualised national (and London) living wages[footnote 4]
-
the average income of a Generation learner grew by 26% to 33% (depending on the sample) year on year between the first and second year after enrolling[footnote 5]
Beyond these observations, we are also excited by the findings of the exploratory comparative analysis to a matched sample presented in the appendix showing better outcomes for our learners.
The evaluation is rightly careful with the presentation of statistics, urging caution in interpreting the evidence and outcomes presented as ‘causal’ (for instance, a result of Generation’s intervention). There could be differences in un-observed characteristics of our learners as compared to the comparison group for which the statistics cannot control that contribute to their higher job outcomes rates. We cannot use this evidence to claim causal effects or which parts of our model (selection and onboarding, profession-specific training, coaching, pastoral support, jobsearch etc.) are generating what impact, if any.
However, we find it hard to discount causality. The approach used, in creating the matched sample, controls for 154 variables and in so doing we understand controls for ‘motivation’ to find work[footnote 6]. Additionally, our selection processes actively prioritises learners facing more barriers to employment and our intervention itself is significant with hundreds of hours for each learner of teaching, coaching, pastoral care and supported jobsearch.
A gap is clear in the data. To us these results:
Evidence a significantly higher chance for Generation learners to find and stay in work compared to those not supported:
-
generation learners were 20% more likely to be in work a year after starting programmes compared to a matched counterfactual sample from the wider population
-
the gap grows rapidly until c.6 months post bootcamp when the majority of our work supporting learners into work ramps down and then stays consistent
-
the estimated uplift against a matched sample is the largest of any provision published by Data Lab team to date
Evidence a notable potential return to the government and public purse from our bootcamps:
-
around 60% of the learners enrolled were on ‘looking for work benefits’ at the start of the programme against a weighted average of around 14% on benefits for 2 years after the programme
-
this means a potential annual saving of >£0.5m [footnote 7] per year in benefits payments per 100 Generation supported learners, not accounting for extra tax receipts, assuming an average monthly benefit payment of £1k and assuming the employment outcomes were the result of Generation’s support
6. About these statistics
Categorisation
The analysis in this report is based on the labour market outcomes of the participants in the 2 years before and one year after starting the intervention. This report uses 4 categories of labour market status for the analysis, detailed below.
Employed: People who are either employed or self-employed
Looking for Work: People who are in receipt of Jobseeker’s Allowance (JSA), or in the Universal Credit (UC) “intensive work search”, “light touch out of work”, or “light touch in work” conditionality regimes. This also includes those in the “working enough” conditionality regime who are not in employment or self-employed.
Inactive: People who are in receipt of inactive benefits such as Employment and Support Allowance (ESA) or in the UC “no work requirements” or “work focussed interview” conditionality regimes. Several other benefits also fall into this category, though the numbers of people on these benefits is small. See methodology document for details.
Other: People who do not fall into the above 3 categories, this could include people who are in full-time education and not working or receiving benefits or those who are serving a custodial sentence.
These categories are not mutually exclusive and it is possible to be in more than one category. For example, someone working fewer than 16 hours a week may also be in receipt of JSA and would be classed as “employed” and “looking for work”.
Statistical significance
The report highlights if the results are statistically significant or not. A statistically significant result is one that is unlikely to have occurred by chance because of sampling error. In this report, unless otherwise stated, the threshold for significance is 95%.
Where to find out more
Further details can be found in the methodology document and the employment data lab website.
7. Statement of compliance with the Code of Practice for Statistics
The Code of Practice for Statistics (the Code) is built around 3 main concepts, or pillars:
-
trustworthiness – is about having confidence in the people and organisations that publish statistics
-
quality – is about using data and methods that produce statistics
-
value – is about publishing statistics that support society’s needs
The following explains how we have applied the pillars of the Code in a proportionate way.
Trustworthiness
Employment Data Lab reports, such as this, are published to provide useful information about programmes that support employment. Releasing them via an ad hoc publication will give equal access to all those with an interest in them.
Quality
The methodology used to produce the information in this report has been developed by DWP analysts. The information is based on government administrative data and management information. The calculations have been quality assured by DWP analysts to ensure they are robust.
Value
Producing these estimates provides readers and the public with useful information about employment support provision that they may not have otherwise been able to generate or obtain.
Appendix A: Why this report is not an impact evaluation
A key aim of the Employment Data Lab is to provide estimates of the causal impact of employment support programmes. Such an estimate has not been included in this report as the administrative data available was not deemed sufficient to fully control for the multi-stage, selection process that Generation’s participants must go through before joining the programme. The process is intensive, screening out approximately 87% applicants over multiple assessment rounds.
To estimate the impact of any intervention it is necessary to form a credible estimate of outcomes had the programme not been introduced. This is known as the counterfactual. Once generated, estimated counterfactual outcomes can be compared to observed outcomes for participants to estimate the impact of the intervention. The Employment Data Lab uses matching methods to estimate the counterfactual via the creation of a comparison group (see methodology report for more details). The credibility of this approach depends on being able to control for the range of factors likely to affect whether an individual participates in the programme, as well as the outcomes they are likely to attain. It is often the case that the more selective a process is the less credible it is that it can be fully controlled for using propensity score matching (PSM).
In this case, the multi-step selection process is based on criteria that is not available for use in the estimation of the counterfactual (test scores, performance at interviews, etc.). Generation supplied information on the number of applicants for courses and the stage in which they left the process for a subset of courses delivered between February 2020 and May 2022. Figure 6 shows the total number of applicants for courses and the stage at which they dropped out or were excluded from the process.
Figure 6 shows that of the 8,390 applicants who met basic eligibility criteria for courses starting between February 2020 and April 2022 approximately 13% enrolled on a course and approximately 12% completed a course. Most of the participants who did not enrol on a course left the process in the first 2 phases. This means they either did not attend an info session or complete a group task or were not available for progression through to the interview stage. As a result, the team felt that a straight-forward PSM approach would not plausibly account for the full effect of this selection process, rendering any impact estimates generated unreliable.
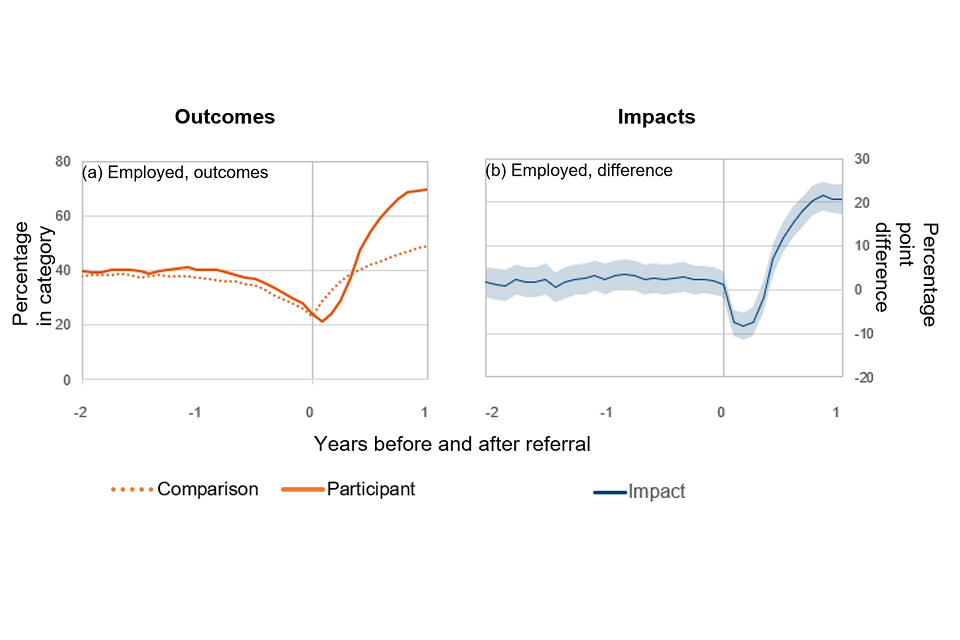
As shown in figure 7 a) and figure 7 b) it is possible to select a matched comparison pool with similar employment histories before starting a course and observe a difference in employment outcomes after starting a course. However, due to the concerns raised above, it is not possible to determine how much of the apparent “impact” is due to the effect of Generation’s training courses and how much is due to bias introduced in the participant selection process. For this reason, such estimates have not been included in the body of this report.
Figure 6: Sankey diagram showing the eligible applicants to Generation courses between 24 February 2020 to 1 April 2022 with the numbers and reasons for exclusion
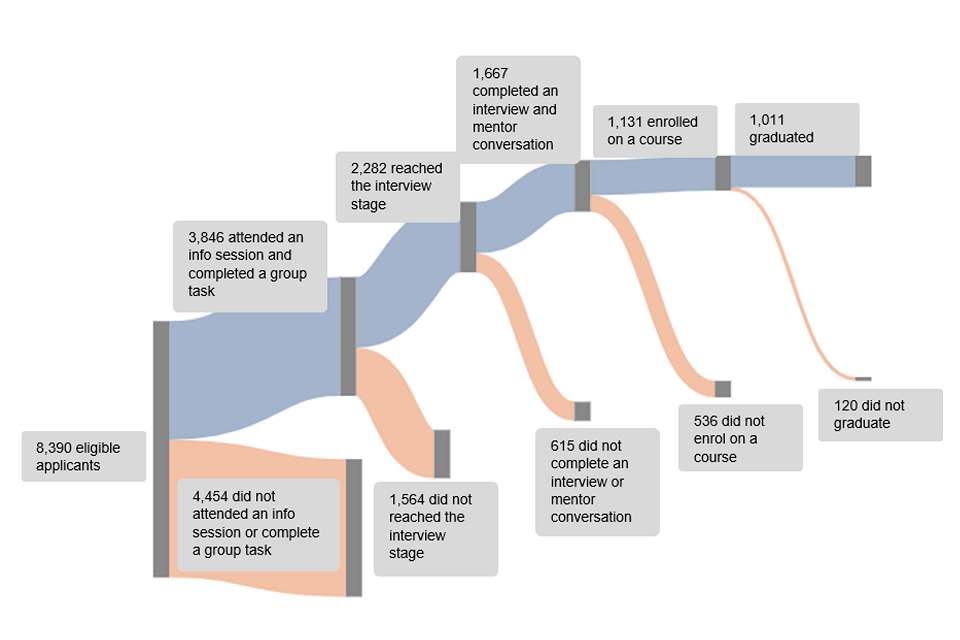
Figure 7: plots showing the percentage of participants in employment as well as a comparison group with similar employment history alongside the difference in employment rates between the two groups
Appendix B: Earnings Information from Pay As You Earn Real Time Information
Pay As You Earn (PAYE) Real Time Information (RTI) is earnings data that is collected by HMRC via their PAYE systems. Some of this data is shared with DWP to support the administration of benefits. The experimental use of this data was explored by the Data Lab in this analysis and is presented below. The methodology underpinning this data and its presentation are still in development, and its use should be considered experimental, and the results used with caution. The data is also only available to the Data Lab for people who have ever received UC.
To be used in this analysis the RTI data was calendarized and then directly linked with the individual data.
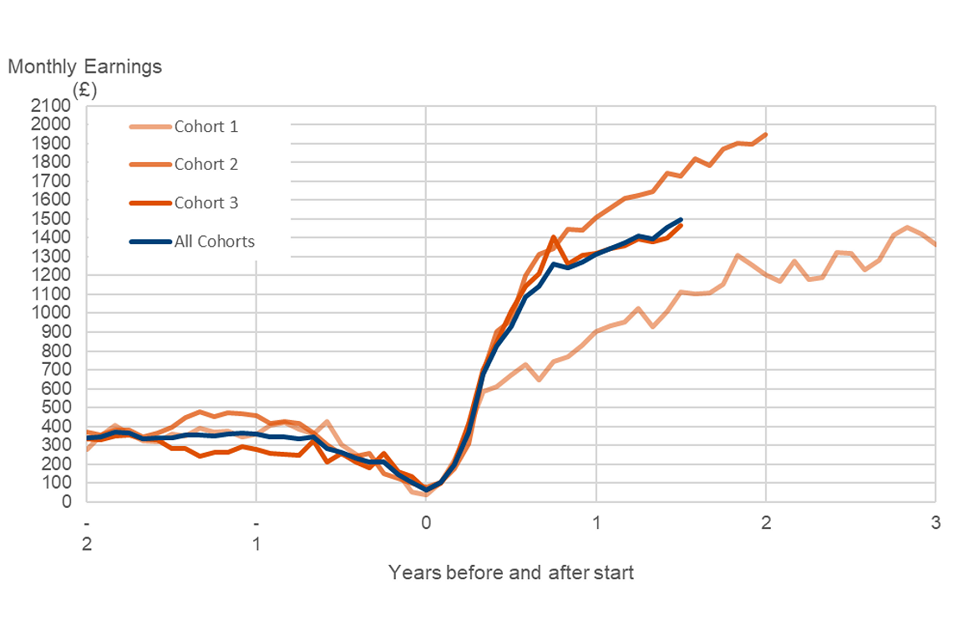
To avoid post treatment selection, only individuals with a UC claim that started before they started a Generation training course are included in Table 3 and Figure 8. The values shown in Table 3 and Figure 8 include zero earnings for those not in employment.
Table 3 showing the average weekly amounts earned by individuals in each cohort (who are present in the RTI data, for instance, those who have had a qualifying benefit spell prior to starting)
| Cohort 1 | Cohort 2 | Cohort 3 | All Cohorts | |
|---|---|---|---|---|
| Number of observations (with RTI data available) | 134 | 266 | 331 | 731 |
| Percentage of cohort (with RTI data available) (%) | 57 | 73 | 67 | 67 |
| 2 years before start (£) | 280 | 370 | 335 | 338 |
| 1 year before start (£) | 361 | 460 | 279 | 360 |
| at start (£) | 38 | 81 | 64 | 65 |
| 1 year after start (£) | 903 | 1,507 | 1,317 | 1,310 |
| 18 months after start (£) | 1,113 | 1,724 | 1,465 | 1,495 |
| 2 years after start (£) | 1,203 | 1,945 | ||
| 3 years after start (£) | 1,361 |
Figure 8 shows monthly earnings for each group, where RTI data was available, both before and after staring a course
Appendix C: Characteristics and outcomes
Table 4 Shows characteristics, education and training outcomes and labour market outcomes for each of the cohorts presented in the report
| Cohort 1 | Cohort 2 | Cohort 3 | All Cohorts | |
|---|---|---|---|---|
| Number of participants | 234 | 365 | 491 | 1,090 |
| Male (%) | 55 | 61 | 60 | 59 |
| Mean age (years) | 24 | 24 | 26 | 25 |
| Restricted ability to work at start | x | x | 5 | 4 |
| Dependent children flag (%) | x | x | 11 | 9 |
| FSM marker missing (%) | 9 | 12 | 29 | 19 |
| FSM marker (%) | 32 | 30 | 25 | 28 |
| SEN marker missing (%) | 9 | 12 | 29 | 19 |
| SEN marker (%) | 24 | 15 | 18 | 19 |
| Care leaver/adopted marker missing (%) | 0 | 0 | 0 | 0 |
| Care leaver/adopted marker (%) | x | x | x | 2 |
| Child in need marker missing (%) | 14 | 16 | 32 | 23 |
| Child in need marker (%) | x | x | x | 4 |
| Exclusion marker missing (%) | 17 | 21 | 34 | 26 |
| Exclusion marker (%) | 10 | 7 | 6 | 7 |
| Degree marker missing (%) | 2 | 1 | 2 | 1 |
| Degree marker (%) | 23 | 38 | 22 | 28 |
| Enrolled in education or training, at any point in the 1 year after start (%) | 26 | 26 | 17 | 22 |
| Enrolled in education or training, at any point in the 2 years after start (%) | 34 | 28 | . | . |
| Course passed, at any point in the 1 year after start (%) | x | 7 | x | 5 |
| Course passed, at any point in the 2 years after start (%) | 14 | 11 | . | . |
| Employed, at any point in the 1 year after start (%) | 78 | 87 | 85 | 84 |
| Employed, at any point in the 2 years after start (%) | 91 | 95 | . | . |
| Employed, 2 years before start (%) | 39 | 43 | 37 | 39 |
| Looking for work, 2 years before start (%) | 10 | 6 | 12 | 10 |
| Inactive, 2 years before start (%) | x | x | x | 4 |
| Other, 2 years before start (%) | 50 | 50 | 51 | 50 |
| Employed, 1 year before start (%) | 46 | 46 | 33 | 40 |
| Looking for work, 1 year before start (%) | 18 | 12 | 32 | 22 |
| Inactive, 1 year before start (%) | x | x | 5 | 4 |
| Other, 1 year before start (%) | 38 | 42 | 39 | 40 |
| Employed at start (%) | 29 | 24 | 25 | 26 |
| Looking for work at start (%) | 53 | 69 | 59 | 61 |
| Inactive at start (%) | x | x | 6 | 5 |
| Other at start (%) | 22 | 16 | 19 | 19 |
| Employed only at start (%) | 21 | 11 | 16 | 15 |
| Employed and on a looking for work benefit at start (%) | x | 12 | 9 | 10 |
| On Looking for work benefit only at start (%) | 45 | 56 | 51 | 51 |
| Employed, 1 year after start (%) | 61 | 76 | 72 | 71 |
| Looking for work, 1 year after start (%) | 35 | 21 | 22 | 25 |
| Inactive, 1 year after start (%) | x | x | 6 | 5 |
| Other, 1 year after start (%) | x | 8 | 9 | 9 |
| Employed, 2 years after start (%) | 73 | 80 | . | . |
| Looking for work, 2 years after start (%) | 24 | 9 | . | . |
| Inactive, 2 years after start (%) | x | x | . | . |
| Other, 2 years after start (%) | x | 10 | . | . |
| Employed, 3 years after start (%) | 71 | . | . | . |
| Looking for work, 3 years after start (%) | 17 | . | . | . |
| Inactive, 3 years after start (%) | x | . | . | . |
| Other, 3 years after start (%) | 13 | . | . | . |
| Employed only to Employed only at 1 year | 16 | 10 | 13 | 12 |
| LFW only to Employed only at 1 year | 16 | 36 | 28 | 28 |
| LFW only to LFW only at 1 year | 22 | 11 | 12 | 14 |
| Inactive only to Inactive only at 1 year | x | 8 | 5 | 6 |
| Other to Other at 1 year | 14 | 12 | 13 | 13 |
| Employed only to Employed only at 2 years | 18 | 10 | . | . |
| LFW only to Employed only at 2 years | 23 | 43 | . | . |
| LFW only to LFW only at 2 years | 13 | x | . | . |
| Inactive only to Inactive only at 2 years | x | 9 | . | . |
| Other to Other at 2 years | 16 | 14 | . | . |
| Average number of weeks Employed during 2 years prior to start | 45 | 44 | 35 | 40 |
| Average number of weeks on looking for work benefit during 2 years prior to start | 21 | 23 | 33 | 27 |
| Average number of weeks on inactive benefit during 2 years prior to start | 5 | 5 | 5 | 5 |
| Average number of weeks in other during 2 years prior to start | 38 | 39 | 39 | 38 |
| Average number of weeks Employed during year prior to start | 22 | 20 | 17 | 19 |
| Average number of weeks on looking for work benefit during year prior to start | 15 | 18 | 22 | 19 |
| Average number of weeks on inactive benefit during year prior to start | 2 | 2 | 3 | 2 |
| Average number of weeks in other during year prior to start | 15 | 16 | 15 | 16 |
| Average number of weeks Employed during year after start | 25 | 27 | 27 | 26 |
| Average number of weeks on looking for work benefit during year after start | 24 | 26 | 22 | 24 |
| Average number of weeks on inactive benefit during year after start | 2 | 2 | 3 | 3 |
| Average number of weeks in other during year after start | 8 | 6 | 6 | 6 |
| Average number of weeks Employed during 2 years after start | 60 | 68 | 45 | 56 |
| Average number of weeks on looking for work benefit during 2 years after start | 39 | 33 | 30 | 33 |
| Average number of weeks on inactive benefit during 2 years after start | 3 | 4 | 6 | 5 |
| Average number of weeks in other during 2 years after start | 13 | 10 | 30 | 20 |
| Average number of weeks until first employment during 1 year after start | 22 | 23 | 21 | 22 |
| Average number of weeks until first employment during 2 years after start | 30 | 27 | . | . |
Note: The information in the table above has been collated from available administrative data. Limitations and variations in the coverage of the data available mean that this information should be used for indicative purposes only.
Note: Employment flags are generated for individuals present in administrative datasets but may not reflect self-identified employment status for some individuals, such as those on zero-hour contracts with no earnings.
Note: Figures marked with an x have been supressed for statistical disclosure purposes.
Note: Figures marked with a “.” indicate that the data was not available.
Appendix D: Employment Outcomes for Additional Participant Subgroups
Table 5 Shows the percentage of participants in employment for all starters before 1 April 2022 alongside a number of participant subgroups.
| Number of Observations | Employed, 1 year after start (%) | |
|---|---|---|
| All participants | 1,090 | 71 |
| Degree holder at start | 301 | 79 |
| Non-degree holder at start | 789 | 68 |
| NUTS level 1 region at start, London | 527 | 72 |
| NUTS level 1 region at start, North West | 222 | 68 |
| NUTS level 1 region at start, West Midlands | 134 | 66 |
| NUTS level 1 region at start, Yorkshire and The Humber | 110 | 69 |
| Other NUTS level 1 region at start | 97 | 76 |
| Employed at some point in the 1 year before start | 670 | 76 |
| Not employed at any point in the 1 year before start* | 420 | 62 |
| Digital courses** | 817 | 74 |
| Non-digital courses*** | 273 | 61 |
*This may include some individuals who were in full time education in the 12 months before start.
**Digital courses include cloud support engineer, software engineer, data engineer, data analyst, and IT support courses.
***Non-digital courses include trainee nursing assistant, customer support, and retrofit advisor courses.
-
See House of Commons Library briefing: Coronavirus: Impact of labour market for further details. ↩
-
This is estimated, by Generation, from noting that on average learners spent 56 weeks in employment in the 2 years after enrolment, implying an average of around 61 weeks for those who did find work (as around 9% did not find work). Most learners could and would not work for around 28 weeks (approx. 7 months) while on the bootcamp and in the placement phase post-programme, meaning they were in work for around 80% of the available week or approximately 10 in 12 months. ↩
-
The calculation, by Generation, takes the average monthly earning, where observed, after 18 months for all cohorts (£1495), multiplies by 12 and assumes that all unemployed learners had zero income. (ie divides by 0.7). ↩
-
This calculation, by Generation, looks at the percentage change in average earnings over the time period and may be skewed by unemployed participants entering work who would go from zero earnings to positive earnings. ↩
-
Caliendo, M., Mahlstedt, R. & Mitnik, O., 2014. Unobservable but unimportant? The influence of personality traits (and other usually unobserved variables) for the evaluation of labour market policies. IZA. ↩
-
This figure was calculated by Generation and DWP have not been involved in the calculation or verification of this estimate. ↩