DCMS Sectors Economic Estimates 2020: annual GVA
Updated 10 November 2023

© Crown copyright 2023
This publication is licensed under the terms of the Open Government Licence v3.0 except where otherwise stated. To view this licence, visit nationalarchives.gov.uk/doc/open-government-licence/version/3 or write to the Information Policy Team, The National Archives, Kew, London TW9 4DU, or email: psi@nationalarchives.gov.uk.
Where we have identified any third party copyright information you will need to obtain permission from the copyright holders concerned.
This publication is available at https://www.gov.uk/government/statistics/economic-estimates-gva-for-dcms-sectors-and-the-digital-sector-2020/dcms-sectors-economic-estimates-2020-annual-gva
1. DCMS Sectors Economic Estimates 2020: Gross Value Added
1.1 Introduction
Release date: 6 April 2023
Next release: Winter 2023/24
Geographic coverage: United Kingdom
Time coverage: 2010 to 2020
Responsible analyst: Rachel Moyce
Revision Note
On 10 November 2023, a revision was made to tables 2a, 2b and 2c of the DCMS Economic Estimates 2020: annual GVA file. The original estimates used an unrevised version of the 2018 Tourism Satellite Account (TSA); the TSA revisions have now been included. This affects the tourism Current Prices GVA in 2018 and 2019, the tourism Chained Volume Measure GVA (and index) in 2016-2020, and the corresponding DCMS totals including tourism. The DCMS Sectors Economic Estimates 2020: annual GVA report has also been updated to reflect the revised estimates.
This release provides estimates of the contribution of DCMS Sectors to the UK economy from 2010 to 2020, measured by gross value added (GVA). The results for 2020 are affected by the coronavirus (COVID-19) pandemic.
We use current prices to report current sector estimates and chained volume measures for any comparisons over time.
The Digital Sector is no longer included in these statistics, as responsibility for this sector now lies with DSIT. Estimates of Digital Sector GVA can be found here
DCMS also publishes a monthly GVA series, starting in January 2019 and currently measured in 2019 prices throughout, which is more timely (two months lag) but less accurate than this series and can be used as a leading indicator.
1.2 Headline Findings
GVA in All DCMS sectors
In 2020, DCMS Sectors contributed £162.6 billion to the UK economy. This was 8.5% of total UK GVA, compared to 10.7% in 2019.
The following information is worth noting:
- These figures are both measured in current prices, enabling a comparison that encompasses all DCMS Sectors (Creative Industries, Cultural Sector, Gambling, Sport, Tourism, Civil Society).
- Subsequent comparisons over time use chained volume measures which means percentages changes are adjusted for inflation, except where stated.
- A value adjusted for inflation is not available for the Civil Society sector.
Change from 2019 to 2020
The change in the DCMS percentage of the UK GVA total from 10.7% to 8.5% reflects that the GVA of DCMS Sectors (excluding Civil Society) fell by 27.6% from 2019 to 2020, compared to 10.6% for the UK economy as a whole. For additional context, at current prices Civil Society was 0.9% of UK GVA in 2020, compared to 0.8% in 2019, a finding which does not meaningfully alter the underlying change from 2019 to 2020 being reported here.
This trend is particularly driven by a fall in the Tourism sector of 64.5%. The Tourism sector is traditionally one of DCMS’s largest sectors and was especially affected by the coronavirus (COVID-19) pandemic. However, the pandemic’s impact was felt elsewhere too, as all DCMS sectors experienced falls from 2019 to 2020.
Trends before 2020
The findings observed in 2020 are atypical when compared to the trends observed before the coronavirus (COVID-19) pandemic. The key trends for DCMS Sectors before 2020 are as follows:
Between 2016 and 2019:
- DCMS Sectors (excluding Civil Society) outgrew the UK economy (8.2% vs 6.0%). The data suggests that this was mostly driven by the Tourism sector (14.2% growth and is the second largest sector in this period)
- Additionally, the Civil Society sector also went from 0.7% of the UK total (at current prices) in 2016, to 0.8% of the UK total in 2019
Before 2016, data for the Tourism sector is not available due to methodological changes made at this time. However, from 2010 to 2015:
- DCMS Sectors (excluding Tourism & Civil Society) outgrew the UK economy (20.9% vs 10.4%). The data suggests this was mostly driven by the Creative Industries (growth of 22.8% and is the largest sector)
- Additionally, the Civil Society sector also went from 0.6% of the UK total (at current prices) in 2010, to 0.7% of the UK total in 2015
2. GVA in individual DCMS sectors
2.1 Sector overlap
Some industries are found within multiple sectors and are likely to drive trends in the same way for both sectors.
For example, in 2020:
- 63.9% of the DCMS Sector GVA is within the Creative Industries
- 16.9% of DCMS Sector GVA is within the Cultural Sector
- However, 16.9% of DCMS Sector GVA is within both the Creative Industries and the Cultural Sector. This illustrates that the Cultural Sectors is almost fully contained within the Creative Industries (but not vice versa) and these overlaps include activities such as performing arts and radio and television broadcasting.
When calculating the DCMS Sector total, the GVA from industries within the overlap is counted once. Users should be aware that the estimate for ‘All DCMS Sectors’ is therefore lower than the sum of the individual sectors.
This overlap between DCMS sectors is illustrated in Figure 1.
Whilst sectors can overlap, we have defined subsectors within a sector that are mutually exclusive. Subsector information is provided for Creative Industries and the Cultural Sector.
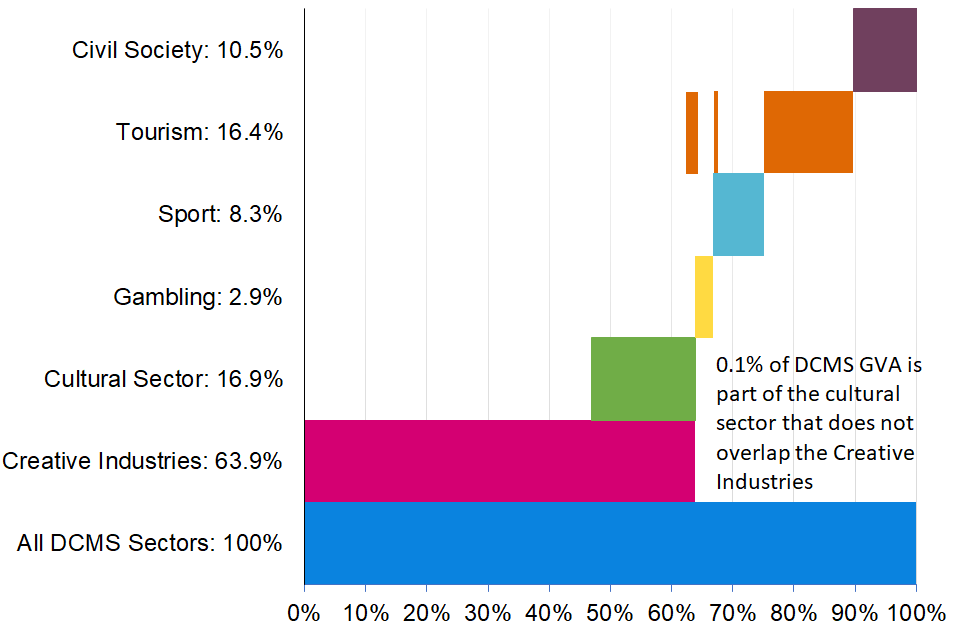
Figure 1. GVA and overlaps in DCMS Sectors, 2020
For more information, Chapter 2 of the technical report visually outlines the overlap between SIC codes in DCMS sectors, but not the value of GVA within these overlaps.
2.2 Sector findings
Of the DCMS Sectors, the Creative Industries Sector contributed the most in GVA to the UK economy (£103.8bn), followed by the Cultural and Tourism sectors (£27.5bn and £26.7bn respectively).
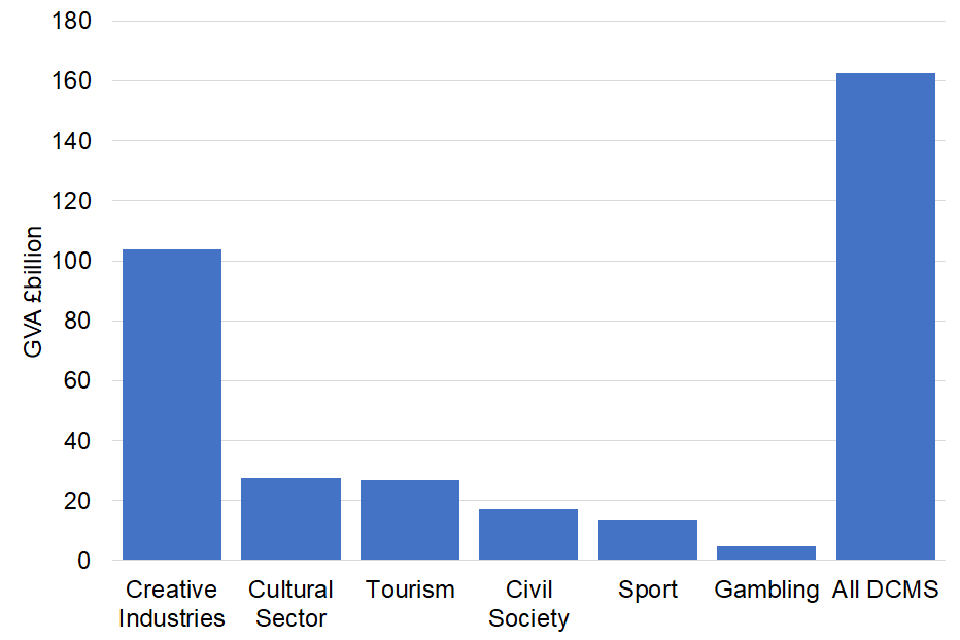
Figure 2. 2020 DCMS sector GVA in constant prices (2019 prices) Note that due to overlaps, sectors do not add to DCMS total.
Creative Industries was the only DCMS sector whose size economically was larger in 2020 than in 2010, with a 25.9% increase. All other DCMS sectors where data is available were smaller in size in 2020 than 2010, although all of these sectors were larger in 2019 (prior to the pandemic) than in 2010.
2.3 Civil Society
Civil Society contributed £17.1bn in 2020. The contribution of Civil Society to the UK economy has increased from 0.6% in 2010 to 0.9% in 2020, based on data in current prices (an estimate for the Civil Society sector expressed in chained volume measures is not currently available, so we can’t compare growth in the Civil Society sector to real terms growth in other DCMS sectors).
These estimates are based on the non-profit institutions serving households (NPISH) data. This is likely to be an underestimate for the Civil Society sector as it does not encompass the full spectrum of the sector. Further information on the Civil Society definition can be found in the technical report.
Note that volunteering, a key element of Civil Society, has not been included in the figures due to being part of the informal economy. As estimated in the ONS published Household Satellite Account, volunteering contributed £24bn in 2016, the last available year (this includes only formal volunteering activities).
2.4 Creative Industries
The Creative Industries contributed £103.8bn in 2020, accounting for 5.5% of UK GVA. The GVA of Creative Industries fell by 4.9% between 2019 and 2020 but was 25.9% higher in 2020, compared to 2010, in real terms.
Creative Industries GVA had been growing faster than the UK economy from 2010 to 2019 (32.4% vs 19.6%), with a large increase in GVA in real terms seen from 2014 to 2015. The fall from 2019 to 2020 was smaller than for the UK economy as a whole (4.9% vs 10.6%).
DCMS has grouped the Standard Industrial Classification (SIC) codes defining the Creative Industries into nine distinct subsectors, grouped by policy themes. Looking at these subsectors:
- The largest contributions to the drop in Creative Industries GVA from 2019 to 2020 were the ‘Music, performing and visual arts’ subsector and the ‘Film, TV, video, radio and photography’ subsector, which fell by 26.5% and 11.9% respectively.
- The ‘IT, software and computer services’ subsector and the ‘Advertising and marketing’ subsectors both continued to grow from 2019 to 2020, at 4.0% and 0.8% respectively. All other subsectors fell.
- ‘IT, software and computer services’ is also the largest subsector component of the Creative Industries by GVA (£44.4bn in 2020).
2.5 Cultural Sector
The Cultural Sector contributed £27.5bn in 2020, accounting for 1.4% of UK GVA. GVA of the Cultural Sector fell by 17.7% from 2019 to 2020, leaving it 3.6% smaller in 2020 than in 2010 in real terms.
Cultural Sector GVA grew at a slightly slower rate to the UK economy from 2010 to 2019 (17.2% vs 19.6%) and fell further from 2019 to 2020 (17.7% vs 10.6%). Overall, the Cultural Sector is around 3.6% smaller in size in 2020 than in 2010.
DCMS has grouped the Standard Industrial Classification (SIC) codes defining the Creative Industries into nine distinct subsectors, grouped by policy themes. Looking at these subsectors:
- All subsectors apart from ‘Library and archives’ fell from 2019 to 2020.
- Mirroring the Creative Industries, the largest contributions to the drop in Cultural Sector GVA were from the ‘Arts’ subsector and the ‘Film, TV and Music’ subsector. They fell by 29.7% and 9.7% respectively.
- The ‘Film, TV and Music’ subsector also remains the largest Cultural subsector in size economically, contributing £18.1bn to the UK economy in 2020.
2.6 Gambling
Gambling contributed £4.8bn in 2020, accounting for 0.3% of UK GVA. The GVA of the Gambling sector decreased by 19.7% between 2019 and 2020, in real terms, leaving it 2.6% smaller in size in 2020 than in 2010, in real terms.
The Gambling sector was 21.3% larger in 2019 than in 2010 but fell 19.7% from 2019 to 2020. This overall left it 2.6% smaller in 2020 than it was in 2010.
It should be noted that the Gambling sector is small, comprising just one two-digit SIC code (SIC 92). Consequently, estimates are prone to sampling variability from year to year (the sector GVA estimates peaked in 2014).
2.7 Sport
Sport contributed £13.6bn in 2020, accounting for 0.7% of UK GVA. The GVA of the Sport sector fell by 22.5% between 2019 and 2020, leaving it 7.9% smaller in size in 2020 than it was in 2010, in real terms.
The Sport sector grew slightly faster than the UK economy from 2010 to 2019, at 22.5%. It fell by around a quarter from 2019 to 2020, leaving it around 8% smaller in size in 2020 compared to 2010.
The figures above are based on the standard definition of the Sport sector, which includes only SIC codes which are predominantly sport. We have previously published an additional different measure of the sport sector, the Sport Satellite Account alongside our GVA publications. We have not done so this year because we have concerns that the underlying ratios needed for the calculation, which come from 2016, were not representative during this pandemic year of 2020. We are considering alternative options for the future and welcome feedback
2.8 Tourism
Tourism contributed £26.7bn in 2020, accounting for 1.4% of UK GVA. The GVA of Tourism has fallen by 64.5% between 2019 and 2020, leaving it 59.5% smaller in 2020 than it was in 2016 (in real terms), the first available year for the sector with comparable methodology to later years.
The Tourism sector grew by 14.2% between 2016 and 2019, peaking at £75.2bn and second largest among DCMS sectors. The increase in Tourism GVA has accounted for 5.7% of the overall DCMS increase in GVA between 2016 and 2019.
However, the sector fell by 64.5% from 2019 to 2020, leaving it less than half the size in 2020 than it was in 2016, the first available year for sector estimates under the current methodology (59.5% smaller). As mentioned previously, Tourism economic activity was particularly affected by the coronavirus (COVID-19) pandemic. The data from the UK Tourism Satellite Account suggests that the fall from 2019 to 2020 came from both falls in the industry totals and falls in the ratios (the % of those industry totals directly attributed to tourism).
Figures for the Tourism sector are only available from 2016, the first available year for the sector with comparable methodology to later years. Tourism also differs from other sectors in that it uses a Satellite Account approach that attempts to calculate the percentage of economic activity, across all UK sectors, that is directly attributable to Tourism.
3. Further information
GVA is a measure of the increase in the value of the economy due to the production of goods and services. Its relationship to GDP is as follows:
GVA = GDP + Subsidies - Taxes
GVA is measured either at:
- current basic prices (‘nominal GVA’), which give the best ‘instantaneous’ measure of the value to the economy, but are not adjusted for the effect of inflation.
- chained volume measures (‘real terms GVA’), where the effect of inflation is removed.
The accompanying data tables consist of current prices and chained volume measures for DCMS sectors and subsectors from 2010 to 2020, and a GVA index expressed in chained volume measures.
We use current prices to report current sector estimates and chained volume measures for any comparisons over time.
The DCMS sectors covered in this report are:
- Civil Society
- Creative Industries
- Cultural Sector
- Gambling
- Sport
- Tourism
Following changes announced in February 2023, figures for the Digital Sector and Telecoms are presented separately, as responsibility for these policy areas now sits with the Department for Science, Innovation and Technology.
Methodological information on the sector definitions, data sources, derivation of GVA and limitations of the approach can now be found in the accompanying technical report, along with. a summary of alternative economic measures of these sectors that are published elsewhere.
The Economic Estimates: GVA (gross value added) for DCMS Sectors and the Digital Sector, 2020 are badged as National Statistics. This affirms that the statistics have met the requirements of the Code of Practice for Statistics.
The next update to these statistics will be released in the winter of 2023/2024, after the National Accounts have been published. The GVA figures in this report will all be revised in the next annual updates.
DCMS has developed a suite of economic estimates to understand the economic impact its sectors have on the UK economy. In combination with other economic indicators, GVA estimates help build a comprehensive picture of the UK economy, and of the DCMS Sectors’ importance within it.
The responsible statistician for this release is Rachel Moyce. For enquiries on this release, please email evidence@dcms.gov.uk.
For general enquiries contact:
Department for Culture, Media and Sport
100 Parliament Street
London
SW1A 2BQ
For media enquiries contact: 020 7211 2210.
DCMS statisticians can also be followed on Twitter via @DCMSInsight.