Economic Estimates: Employment in the Digital Sector, January 2022 to December 2022
Updated 20 December 2024

© Crown copyright 2024
This publication is licensed under the terms of the Open Government Licence v3.0 except where otherwise stated. To view this licence, visit nationalarchives.gov.uk/doc/open-government-licence/version/3 or write to the Information Policy Team, The National Archives, Kew, London TW9 4DU, or email: psi@nationalarchives.gov.uk.
Where we have identified any third party copyright information you will need to obtain permission from the copyright holders concerned.
This publication is available at https://www.gov.uk/government/statistics/economic-estimates-employment-in-dcms-sectors-and-digital-sector-january-2022-to-december-2022/economic-estimates-employment-in-the-digital-sector-january-2022-to-december-2022
1. Details:
This publication provides an update on the Digital Sector (including Telecoms) workforce based on the latest 2022 data provided by the Office for National Statistics (ONS) Annual Population Survey (APS). For this purpose, estimates will cover employment (number of filled jobs) in the Digital Sector for the 2022 calendar year (January to December).
Although previously included in DCMS employment estimates, figures for the Digital Sector and Telecoms are now presented separately as responsibility for these policy areas now sits with the Department for Science, Innovation and Technology (DSIT).
2. Sectors
The estimates reported here cover employment in sectors for which the Department for Innovation, Science and Technology (DSIT) is responsible:
- Digital Sector
- Of which: Telecoms
Telecoms is a subset of the Digital Sector. For details of each sector’s definition, see the associated technical report.
3. Employment
DCMS publishes estimates on the number of filled jobs in the Digital Sector (including Telecoms), and for the UK overall. These estimates are calculated using the Annual Population Survey (APS) and aim to provide greater understanding of employment trends and access in the Digital Sector, and of its contribution to the UK economy.
The APS enables us to estimate multiple demographic breakdowns of employment estimates for the Digital Sector. The demographics reported here focus on breakdowns by sex (male and female), disability (reported as people with a disability and people without a disability, as defined under the 2010 Equality Act) and ethnicity. The published tables contain more information, including breakdowns by region, age, nationality, highest level of education and working pattern (full-time or part-time).
This publication will compare the latest 2022 calendar year data to the 2019 and 2021 estimates in the tables accompanying the release.
All figures for the number of filled jobs are rounded to the nearest thousand (with exception of those less than 1,000).
4. Digital Sector:
As of the 2022 calendar year, there were a total of 1.9 million filled jobs in the Digital Sector, representing an increase of 325,000 filled jobs compared to 2019 (pre-pandemic), and 73,000 filled jobs since the 2021 calendar year.
In percentage terms, when compared to 2021 and 2019 (pre-pandemic), employment in the Digital Sector has grown faster than the UK overall.
Compared to 2019 (pre-pandemic), employment in the Digital Sector has increased by 20.9%, and in the UK overall by 0.6%. Meanwhile, compared to 2021, employment in the Digital Sector increased by 4.1%, and in the UK overall by 1.5%.
In terms of employment, the Digital Sector makes up an increasing share of total UK filled jobs. As of 2022, the Digital Sector made up 5.6% of total UK filled jobs, a slight increase from 5.4% in 2021, and an increase from 4.6% in the equivalent period pre-pandemic (2019).
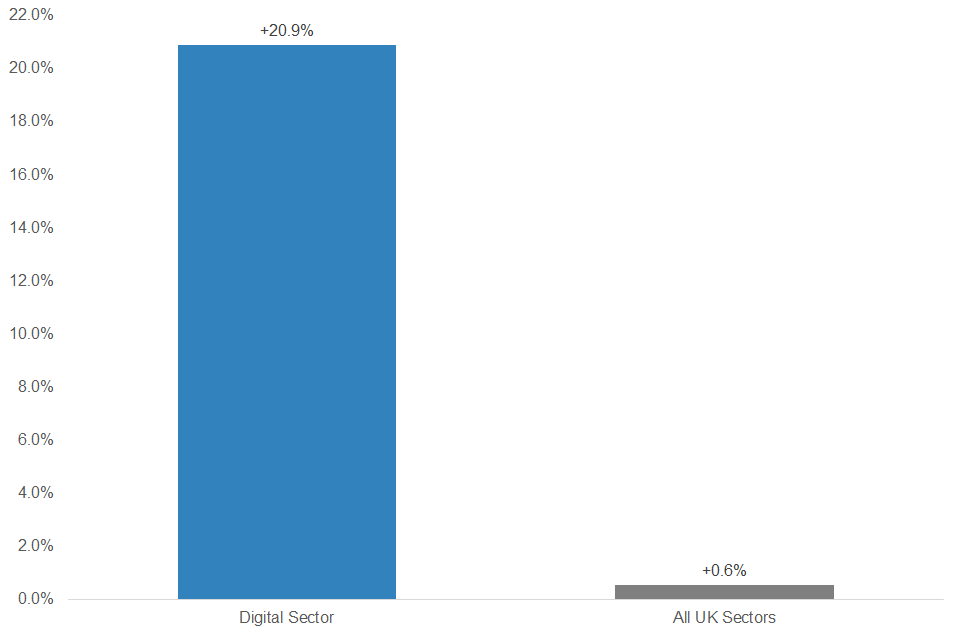
Figure 1: Change in employment within the Digital Sector and the UK overall, 2019 to 2022.
Using UK Standard Industrial Classification 2007 (SIC) codes, DCMS use sub-sectors to disaggregate the Digital Sector into the following groups:
- Computer programming, consultancy and related activities
- Publishing (excluding translation and interpretation activities)
- Telecommunications
- Film, TV, video, radio and music
- Manufacturing of electronics and computers
- Repair of computers and communication equipment
- Wholesale of computers and electronics
- Information service activities
- Software publishing
The UK SIC 2007 is used to classify business establishments and other statistical units by the type of economic activity in which they are engaged. A list of SIC codes appearing in each sub-sector can be found in the tables accompanying the release.
Of the Digital sub-sectors, the Computer programming, consultancy and related activities sub-sector is the largest, and makes up approximately 1.0 million (55.7%) of the sector’s filled jobs. This marks an increase from 789,000 thousand (50.6%) in 2019 (pre-pandemic), and reflects strong employment growth over the period.
From 2019 (pre-pandemic) to 2022, employment in the Computer programming, consultancy and related activities sub-sector increased by 260,000 (33.0%), the largest increase of any Digital sub-sector.
Consistent with trends in previous years, driving the growth in filled jobs within the Computer programming, consultancy and related activities sub-sector were its two predominant industries: Computer Programming activities (SIC 62.01) and Computer consultancy activities (SIC 62.02).
Reflecting the strong employment growth of the Digital Sector overall, when compared to pre-pandemic (2019), the only Digital sub-sectors to experience declines in employment were the Publishing (excluding translation and interpretation activities) and Repair of computers and communication equipment sub-sectors. For more information on changes in employment within the Digital Sector and its sub-sectors, see Table 1.
Table 1: Filled jobs (nearest thousand) in the Digital Sector, UK and Digital sub-sectors for the 2022 calendar year, and change compared to the previous equivalent estimate and pre-pandemic.
| Latest 2022 calendar year estimate | Change from Previous 2021 calendar year estimate | Change from Pre-pandemic 2019 calendar year estimate | |
|---|---|---|---|
| All UK Sectors | 33,739,000 | +511,000 (+1.5%) | +186,000 (+ 0.6%) |
| Digital Sector | 1,883,000 | +73,000 (+4.1%) | +325,000 (+20.9%) |
| Computer programming, consultancy and related activities | 1,049,000 | +79,000 (+8.2%) | +260,000 (+33.0%) |
| Film, TV, video, radio and music | 236,000 | -10,000 (-3.9%) | +38,000 (+19.4%) |
| Telecommunications | 188,000 | -1,000 (-0.6%) | +10,000 (+5.5%) |
| Publishing (excluding translation and interpretation activities) | 161,000 | -2,000 (-1.1%) | -7,000 (-4.2%) |
| Manufacturing of electronics and computers | 102,000 | -2,000 (-2.0%) | +4,000 (+4.3%) |
| Software publishing | 41,000 | +3,000 (+7.4%) | +13,000 (+45.7%) |
| Information service activities | 40,000 | +3,000 (+9.3%) | +10,000 (+34.7%) |
| Wholesale of computers and electronics | 36,000 | +8,000 (+26.3%) | +2,000 (+4.8%) |
| Repair of computers and communication equipment | 30,000 | -5,000 (-15.0%) | -5,000 (-14.5%) |
4.1 Demographic breakdowns
According to 2022 estimates, as a proportion, within the Digital Sector the share of filled jobs held by women and the share of filled jobs held by disabled people was smaller than for the UK workforce overall.
As of the 2022 calendar year, within the Digital Sector there were 29.3% (vs 48.1% UK workforce overall) of filled jobs held by women and 12.5% (vs 16.4% UK workforce overall) held by disabled people.
Within the Digital Sector, the share of filled jobs held by people from the Asian or Asian British ethnic group, other ethnic groups, and mixed or multiple ethnic group was greater than the UK workforce overall. Meanwhile, the share of filled jobs in the Digital Sector held by people from the white ethnic group and black, African, Caribbean or black British ethnic group was lower than the UK workforce overall.
Within the Digital Sector, the share of filled jobs held by people from the white ethnic group was 81.6% (vs 85.6% UK workforce overall), followed by 9.9% from the Asian or Asian British ethnic group (vs 7.5% UK workforce overall), 3.8% from the other ethnic groups (vs 2.0% UK workforce overall), 2.9% from the black, African, Caribbean or black British ethnic group (vs 3.4 UK workforce overall), and 1.8% from the mixed or multiple ethnic group (vs 1.5% UK workforce overall).
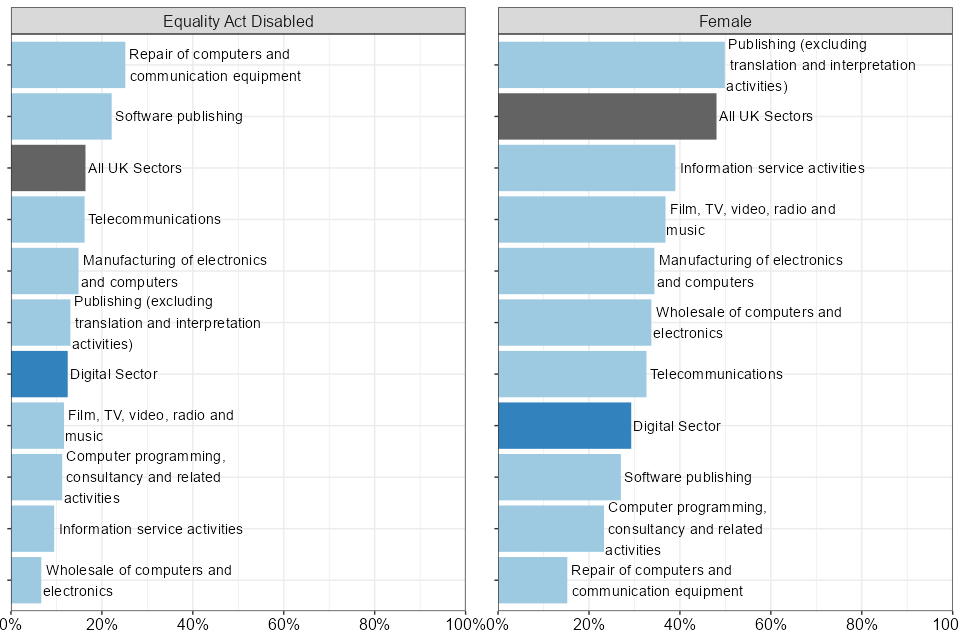
Figure 2: Proportion of filled jobs in the Digital sub-sectors, Digital Sector and UK workforce by selected characteristics, 2022.
Within the Digital sub-sectors, there is great variation in the demographic characteristics of the workforce:
- Computer programming, consultancy and related activities: As of 2022, the Computer programming, consultancy and related activities sub-sector had an estimated share of filled jobs held by disabled people at 11.3% (vs 16.4% UK workforce overall) and by women at 23.3% (vs 48.1% UK workforce overall).
- Fim, TV, video, radio and music: As of 2022, the Fim, TV, video, radio and music sub-sector had an estimated share of filled jobs held by disabled people at 11.7% and by women at 36.8%.
- Telecommunications: As of 2022, the Telecommunications sub-sector had an estimated share of filled jobs held by disabled people at 16.2% and by women at 32.6%.
- Publishing (excluding translation and interpretation activities): As of 2022, the Publishing (excluding translation and interpretation activities) sub-sector had an estimated share of filled jobs held by disabled people at 13.1% and by women at 49.9%.
- Manufacturing of electronics and computers: As of 2022, the Manufacturing of electronics and computers sub-sector had an estimated share of filled jobs held by disabled people at 14.9% and by women at 34.4%.
- Software publishing: As of 2022, the Software publishing sub-sector had an estimated share of filled jobs held by disabled people at 22.2% and by women at 27.0%.
- Information service activities: As of 2022, the Information service activities sub-sector had an estimated share of filled jobs held by disabled people at 9.5% and by women at 39.0%.
- Wholesale of computers and electronics: As of 2022, the Wholesale of computers and electronics sub-sector had an estimated share of filled jobs held by disabled people at 6.7% and by women at 33.7%.
- Repair of computers and communication equipment: As of 2022, the Repair of computers and communication equipment sub-sector had an estimated share of filled jobs held by disabled people at 25.2% and by women at 15.2%.
Further demographic information can be found in the published tables, including breakdowns by region, age, nationality, highest level of education and working pattern (full-time or part-time).
5. Telecoms:
As of the 2022 calendar year, there were a total of 188,000 filled jobs in the Telecoms sector, representing an increase of 10,000 filled jobs compared to 2019 (pre-pandemic), but a fall of 1,000 filled jobs since the 2021 calendar year.
In percentage terms, when compared to 2019 (pre-pandemic) employment has grown at a faster rate than the UK overall. However, compared to the previous year employment in the Telecoms sector declined, while growing for the UK overall.
Compared to 2019 (pre-pandemic), employment in the Telecoms sector has increased by 5.5%, and in the UK overall by 0.6%. In the shorter term, compared to 2021, employment in the Telecoms sector decreased by 0.6%, but increased by 1.5% in the UK overall.
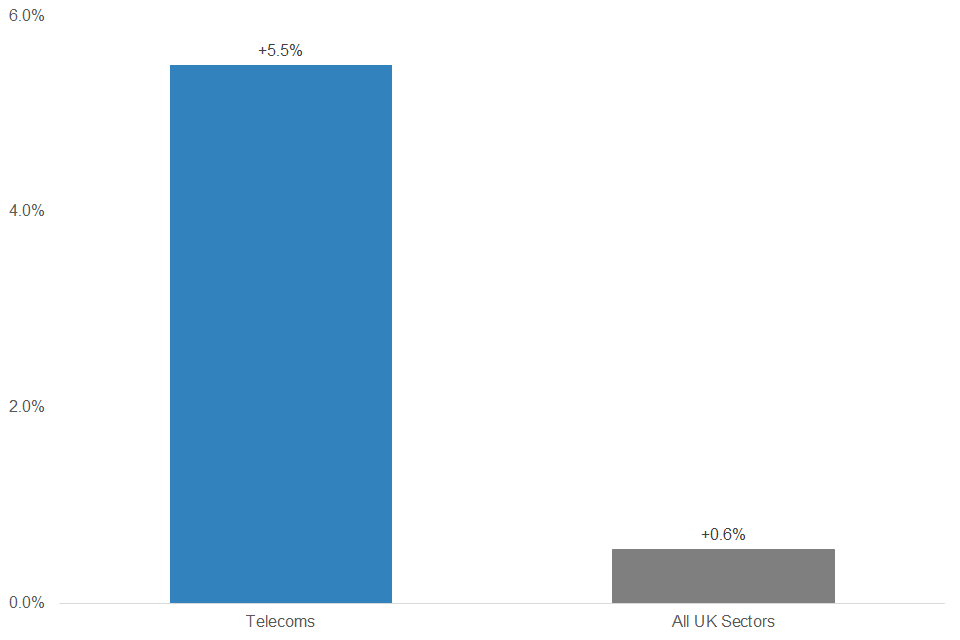
Figure 3: Change in employment within the Telecoms sector and the UK overall, 2019 to 2022.
As of 2022, of the Telecoms industries, the Wireless telecommunications activities (SIC 61.2) industry is the largest and makes up approximately 98,000 (52.3%) of the sectors’ filled jobs; a figure that marks an increase of 15,000 (17.5%) since 2019 (pre-pandemic), and 7,000 (7.6%) since 2021.
Within the Telecoms sector, the only industry to experience a decline in employment since 2019 (pre-pandemic), and the industry driving the fall in employment since 2021, was the Wired telecommunications activities (61.10) industry. Employment in the industry fell by 9,000 filled jobs (16.4%) when compared to pre-pandemic (2019) and 11,000 filled jobs (19.6%) when compared to 2021.
5.1 Demographic breakdowns
According to 2022 estimates, as a proportion, within the Telecoms sector the share of filled jobs held by women or disabled people was less than the UK workforce overall.
As of the 2022 calendar year, within the Telecoms sector there were 32.6% (vs 48.1% UK workforce overall) of filled jobs held by women and 16.2% (vs 16.4% UK workforce overall) held by disabled people.
Within the Telecoms sector, the share of filled jobs held by people in the mixed or multiple ethnic group, Asian or Asian British ethnic group, black, African, Caribbean or black British ethnic group, and other ethnic groups was greater than the UK workforce overall. Meanwhile, the share of filled jobs in the sector held by people in the white ethnic group was lower than the UK workforce overall.
Within the Telecoms sector, the share of filled jobs held by people from the white ethnic group was 81.8% (vs 85.6% UK workforce overall), followed by 8.9% from the Asian or Asian British ethnic group (vs 7.5% UK workforce overall), 4.1% from the black, African, Caribbean or black ethnic group (vs 3.4 UK workforce overall), 2.9% from the other ethnic groups (vs 2.0% UK workforce overall), and 2.3% from the mixed or multiple ethnic group (vs 1.5% UK workforce overall).
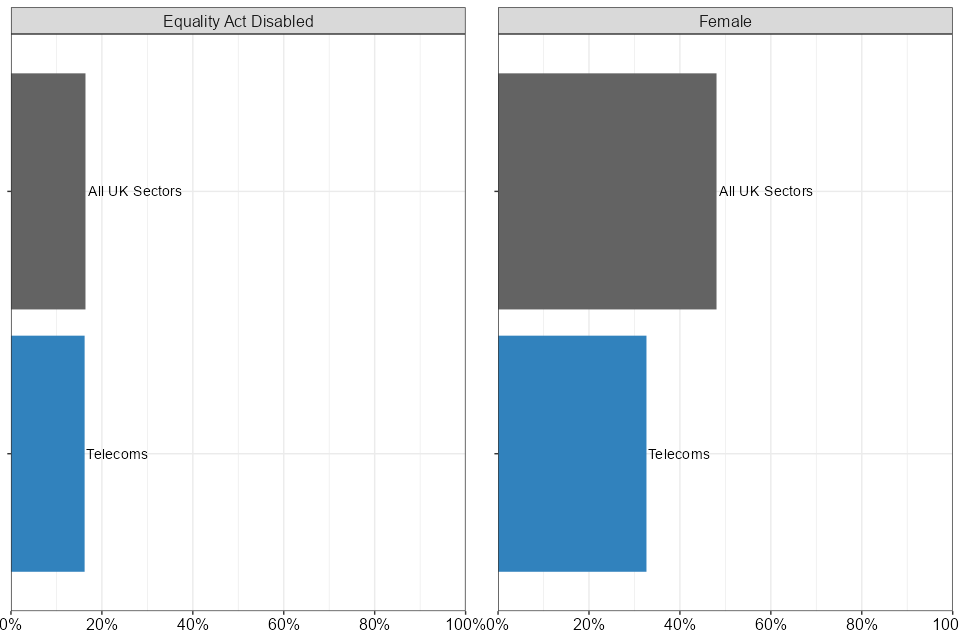
Figure 4: Proportion of filled jobs in the Telecoms sub-sector and UK workforce by selected characteristics, 2022.
Further demographic information can be found in the published tables, including breakdowns by region, age, nationality, highest level of education and working pattern (full-time or part-time).