Economic Estimates: Employment in the DCMS sectors, January 2022 to December 2022
Updated 20 December 2024

© Crown copyright 2024
This publication is licensed under the terms of the Open Government Licence v3.0 except where otherwise stated. To view this licence, visit nationalarchives.gov.uk/doc/open-government-licence/version/3 or write to the Information Policy Team, The National Archives, Kew, London TW9 4DU, or email: psi@nationalarchives.gov.uk.
Where we have identified any third party copyright information you will need to obtain permission from the copyright holders concerned.
This publication is available at https://www.gov.uk/government/statistics/economic-estimates-employment-in-dcms-sectors-and-digital-sector-january-2022-to-december-2022/economic-estimates-employment-in-the-dcms-sectors-january-2022-to-december-2022
1. Details:
This publication provides an update on the DCMS workforce based on the latest 2022 data provided by the Office for National Statistics (ONS) Annual Population Survey (APS). For this purpose, estimates will cover employment (number of filled jobs) in the included DCMS Sectors for the 2022 calendar year (January to December).
Estimates for employment in the Digital Sector (including Telecoms) are no longer part of DCMS totals. However, we will be publishing these estimates separately alongside the DCMS release. This follows the creation of the Department of Science, Innovation and Technology (DSIT) and the change to the DCMS remit.
2. Sectors
The estimates reported here cover employment in sectors for which DCMS is responsible:
- Civil Society
- Creative Industries
- Cultural Sector
- Gambling
- Sport
- Tourism (not included in this release)
For details of each sector’s definition, see the associated technical report.
Please note data is not available for the Tourism sector because 2022 estimates from the ONS’s Tourism Satellite Account are yet to be published.
3. Employment
DCMS publishes estimates of the number of filled jobs in the DCMS sectors, and for the UK overall. These estimates are calculated using the Annual Population Survey (APS) and aim to provide greater understanding of employment trends and access in DCMS sectors, and of the DCMS contribution to the UK economy.
The APS enables us to estimate multiple demographic breakdowns of employment for the DCMS sectors. The demographics reported here focus on breakdowns by sex (male and female), disability (reported as people with a disability and people without a disability, as defined under the 2010 Equality Act) and ethnicity. The published tables contain more information, including breakdowns by region, age, nationality, highest level of education and working pattern (full-time or part-time).
This publication will compare the latest 2022 calendar year data to the 2019 and 2021 estimates in the tables accompanying the release.
All figures for the number of filled jobs are rounded to the nearest thousand (with exception of those less than 1,000).
4. DCMS Sectors (excluding Tourism):
As of the 2022 calendar year, there were a total of 3.9 million filled jobs in the included DCMS Sectors, representing an increase of 322,000 filled jobs compared to 2019 (pre-pandemic), and 85,000 filled jobs since the 2021 calendar year.
In percentage terms, when compared to 2021 and 2019 (pre-pandemic), employment in the included DCMS Sectors has grown faster than the UK overall. When compared to 2019 (pre-pandemic), employment in the included DCMS Sectors increased by 8.9%, compared to 0.6% for the UK overall. In the shorter term, from 2021 to 2022, employment in the included DCMS Sectors increased by 2.2%, compared to 1.5% for the UK overall.
In terms of employment, the included DCMS Sectors make up an increasing share of UK filled jobs. As of 2022, the sectors made up 11.6% of total UK filled jobs. This is a similar share to the 2021 calendar year, but an increase from 10.7% in the equivalent period pre-pandemic (2019).
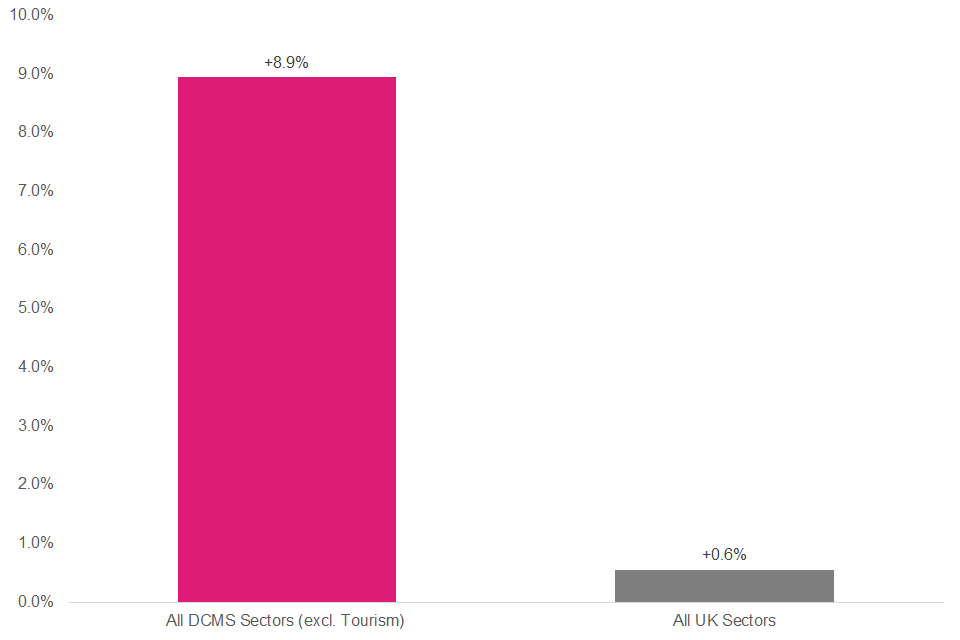
Figure 1: Change in employment within the included DCMS Sectors and the UK overall, 2019 to 2022.
Of the individual DCMS sectors, in percentage terms, the Creative Industries (14.1% increase) has experienced the largest growth in filled jobs since pre-pandemic (2019), while the Gambling sector (0.5% decrease) and Sport sector (3.8% decrease) experienced declines.
Despite employment in the Gambling sector and Sport sector remaining below pre-pandemic levels, in percentage terms, when compared to the previous calendar year (2021) the Sport sector (2.5% increase) and Gambling sector (3.4% increase) experienced the largest growth in employment of any of the DCMS sectors. See Table 1 for more information on employment in the DCMS sectors.
Table 1: Filled jobs (nearest thousand) in the DCMS Sectors and UK overall for the 2022 calendar year, and change compared to the 2021 calendar year and pre-pandemic (2019).
| Latest 2022 calendar year estimate | Change from Previous 2021 calendar year estimate | Change from Pre-pandemic 2019 calendar year estimate | |
|---|---|---|---|
| All UK Sectors | 33,739,000 | +511,000 (+1.5%) | +186,000 (+ 0.6%) |
| All DCMS Sectors (excluding Tourism) | 3,923,000 | +85,000 (+2.2%) | +322,000 (+8.9%) |
| Creative Industries | 2,396,000 | +57,000 (+2.4%) | +295,000 (+14.1%) |
| Civil Society | 942,000 | +14,000 (+1.5%) | +44,000 (+4.9%) |
| Cultural Sector | 694,000 | -12,000 (-1.8%) | +18,000 (+2.7%) |
| Sports | 541,000 | +13,000 (+2.5%) | -21,000 (-3.8%) |
| Gambling | 76,000 | +2,000 (+3.4%) | -400 (-0.5%) |
4.1 Demographic breakdowns
According to 2022 calendar year estimates, as a proportion, the share of filled jobs held by women and the share of filled jobs held by disabled people was smaller in the included DCMS Sectors than the UK workforce overall.
As of the 2022 calendar year, within the included DCMS Sectors there were 45.3% (vs 48.1% UK workforce overall) of filled jobs held by women and 15.8% (vs 16.4% UK workforce overall) held by disabled people.
Within the included DCMS Sectors, the share of filled jobs held by people from the white ethnic group, the mixed or multiple ethnic group, and other ethnic groups was greater than the UK workforce overall. Meanwhile, the share of filled jobs in the included DCMS Sectors held by people from the Asian or Asian British ethnic group and from the black, African, Caribbean or black British ethnic group was lower than the UK workforce overall.
Within the included DCMS Sectors, the share of filled jobs held by people from the white ethnic group was 87.5% (vs 85.6% UK workforce overall), followed by 6.1% from the Asian or Asian British ethnic group (vs 7.5% UK workforce overall), 2.5% from the black, African, Caribbean or black British ethnic group (vs 3.4% UK workforce overall), 2.2% from the other ethnic groups (vs 2.0% UK workforce overall), and 1.6% from the mixed or multiple ethnic group (vs 1.5% UK workforce overall).
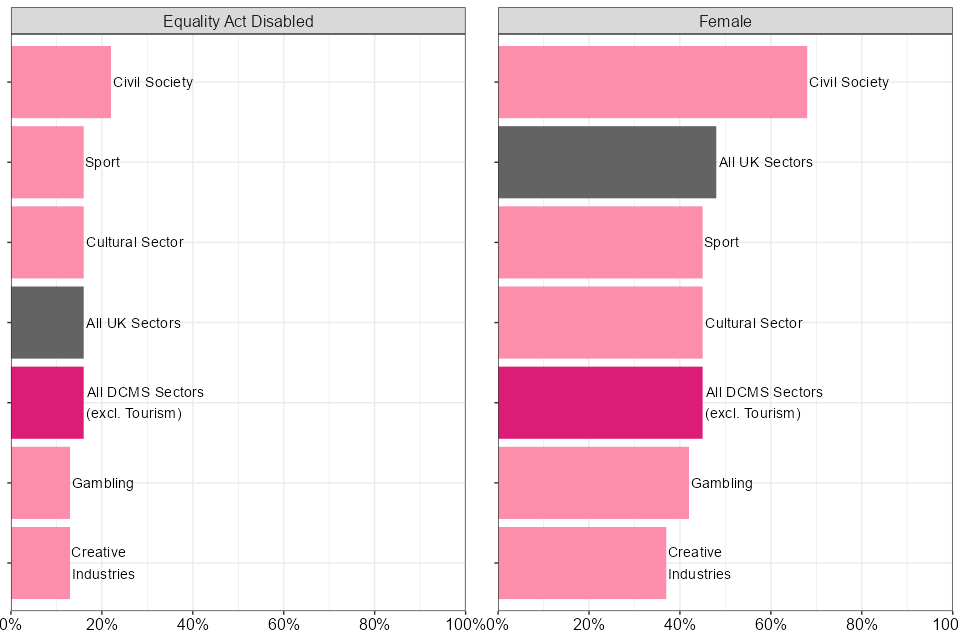
Figure 2: Proportion of filled jobs in the DCMS sectors and UK workforce by sex and disability status, 2022.
Within the individual included DCMS Sectors, there is great variation in the demographic characteristics of the workforce.
- Creative Industries: As of 2022, the Creative Industries had an estimated share of filled jobs held by disabled people at 13.3% (vs 16.4% UK workforce overall) and by women at 37.1% (vs 48.1% UK workforce overall).
- Civil Society: As of 2022, the Civil Society sector had an estimated share of filled jobs by disabled people at 22.3% and by women at 67.7%.
- Cultural Sector: As of 2022, the Cultural Sector had an estimated share of filled jobs held by disabled people at 16.3% and by women at 45.3%.
- Sport: As of 2022, the Sport sector had an estimated share of filled jobs held by disabled people at 16.1% and women at 45.3%.
- Gambling: As of 2022, the Gambling sector had an estimated share of filled jobs held by disabled people at 12.5% and by women at 42.4%.
Further demographic information can be found in the published tables, including breakdowns by region, age, nationality, highest level of education and working pattern (full-time or part-time).
5. The Creative Industries:
As of the 2022 calendar year, there were a total of 2.4 million filled jobs in the Creative Industries, representing an increase of 295,000 filled jobs compared to 2019 (pre-pandemic), and 57,000 filled jobs since the 2021 calendar year.
In percentage terms, when compared to 2021 and 2019 (pre-pandemic), employment in the Creative Industries has grown faster than the UK overall.
Compared to 2019 (pre-pandemic), employment in Creative Industries has increased by 14.1%, and in the UK overall by 0.6%. In the shorter term, from 2021 to 2022, employment in the Creative Industries increased by 2.4%, and in the UK overall by 1.5%.
In terms of employment, the Creative Industries is the largest sector of the included DCMS sectors and makes up a growing share of total UK employment. As of 2022, the Creative Industries made up 7.1% of total UK filled jobs, a slight increase from 7.0% in 2021, and an increase from 6.3% in the equivalent period pre-pandemic (2019).

Figure 3: Change in employment within the included DCMS Sectors and the UK overall, 2019 to 2022.
Using UK Standard Industrial Classification 2007 (SIC) codes, DCMS use sub-sectors to disaggregate the Creative Industries into the following groups:
- Advertising and Marketing
- Architecture
- Crafts
- Design and designer fashion
- Film, TV, video, radio and photography
- IT, software and computer services
- Publishing
- Museums, galleries and libraries
- Music, performing and visual arts
The UK SIC 2007 is used to classify business establishments and other statistical units by the type of economic activity in which they are engaged. A list of SIC codes appearing in each sub-sector can be found in the tables accompanying the release.
Of the Creative Industries sub-sectors, the IT, software and computer services sub-sector is the largest, and makes up approximately 1.0 million (43.2%) of the sectors’ filled jobs. This marks an increase from 775,000 (36.9%) in 2019 (pre-pandemic), and reflects strong employment growth over the period.
From 2019 (pre-pandemic) to 2022, in percentage terms, employment in the IT, software and computer services sub-sector increased by 33.5%, the largest increase of any creative sub-sector.
Consistent with trends in previous years, driving the growth in filled jobs within the IT, software and computer services sub-sector were its two predominant industries: Computer programming activities (SIC 62.01) and Computer consultancy activities (SIC 62.02).
Despite the aggregate increase in Creative Industries employment, when compared to 2021 and 2019 (pre-pandemic), employment growth has been mixed across the Creative Industries sub-sectors. For more information on changes in employment within the Creative Industries and its sub-sectors, see Table 2.
Table 2: Filled jobs (nearest thousand) in the Creative Industries, UK and Creative Industries sub-sectors for the 2022 calendar year, and change compared to the previous equivalent estimate and pre-pandemic.
| Latest 2022 calendar year estimate | Change from Previous 2021 calendar year estimate | Change from Pre-pandemic 2019 calendar year estimate | |
|---|---|---|---|
| All UK Sectors | 33,739,000 | +511,000 (+1.5%) | +186,000 (+ 0.6%) |
| Creative Industries | 2,396,000 | +57,000 (+2.4%) | +295,000 (+14.1%) |
| IT, software and computer services | 1,035,000 | +71,000 (+7.4%) | +260,000 (+33.5%) |
| Music, performing and visual arts | 283,000 | -10,000 (-3.6%) | -32,000 (-10.0%) |
| Film, TV, radio and photography | 280,000 | -11,000 (-3.7%) | +41,000 (+17.0%) |
| Publishing | 209,000 | +13,000 (+2.5%) | +13,000 (+6.7%) |
| Advertising and marketing | 241,000 | +15,000 (+6.6%) | +51,000 (+26.8%) |
| Design and designer fashion | 139,000 | -22,000 (-13.5%) | -32,000 (-18.6%) |
| Architecture | 110,000 | +4,000 (+3.5%) | -2,000 (-1.7%) |
| Museums, Galleries and Libraries | 96,000 | +2,000 (+2.5%) | +1,000 (+0.7%) |
| Crafts | 5,000 | -2,000 (-30.4%) | -5,000 (-49.0%) |
5.1 Demographic breakdowns
According to 2022 estimates, as a proportion, within the Creative Industries the share of filled jobs held by women and the share of filled jobs held disabled people was smaller than the UK workforce overall.
As of the 2022 calendar year, within the Creative Industries there were 37.1% (vs 48.1% UK workforce overall) of filled jobs held by women and 13.3% (vs 16.4% UK workforce overall) held by disabled people.
Within the Creative Industries, the share of filled jobs held by people in the mixed or multiple ethnic group, Asian or Asian British ethnic group, and other ethnic groups was greater than the UK workforce overall. Meanwhile, the share of filled jobs in the Creative Industries held by people in the white ethnic group and black, African, Caribbean or black British ethnic group was lower than the UK workforce overall.
Within the Creative Industries, the share of filled jobs held by people from the white ethnic group was 84.8% (vs 85.6% UK workforce overall), followed by 8.1% from the Asian or Asian British ethnic group (vs 7.5% UK workforce overall), 3.1% from the other ethnic groups (vs 2.0% UK workforce overall), 2.2% from the black, African, Caribbean or black British ethnic group (vs 3.4 UK workforce overall), and 1.8% from the mixed or multiple ethnic group (vs 1.5% UK workforce overall).

Figure 4: Proportion of filled jobs in the Creative Industries sub-sectors, Creative Industries and UK workforce by selected characteristics, 2022. (note: Complete demographic information is not available for all sub-sectors)
Within the Creative Industries sub-sectors, there is great variation in the demographic characteristics of the workforce.
- IT, software and computer services: As of 2022, the IT, software and computer services sub-sector had an estimated share of filled jobs held by disabled people at 11.6% (vs 16.4% UK workforce overall) and by women at 23.5% (vs 48.1% UK workforce overall).
- Music, performing and visual arts: As of 2022, the Music, performing and visual arts sub-sector had an estimated share of filled jobs held by disabled people at 19.4% and by women at 49.3%.
- Film, TV, radio and photography: As of 2022, the Film, TV, radio and photography sub-sector had an estimated share of filled jobs held by disabled people at 12.1% and by women at 37.7%.
- Publishing: As of 2022, the Publishing sub-sector had an estimated share of filled jobs held by disabled people at 14.4% and by women at 53.5%.
- Advertising and marketing: As of 2022, the Advertising and marketing sub-sector had an estimated share of filled jobs held by disabled people at 12.4% and by women at 52.3%.
- Design and designer fashion: As of 2022, the Design and designer fashion sub-sector had an estimated share of filled jobs held by disabled people at 16.0% and by women at 46.7%.
- Architecture: As of 2022, the Architecture sub-sector had an estimated share of filled jobs held by disabled people at 9.4% and by women at 34.7%.
- Museums, Galleries and Libraries: As of 2022, the Museums, Galleries and Libraries sub-sector had an estimated share of filled jobs held by women at 60.1%. A breakdown of filled jobs held by disabled people is not available for this sub-sector.
- Crafts: As of 2022, within the Crafts sub-sector 45.2% of filled jobs were held by women. A breakdown of filled jobs held by disabled people is not available for this sub-sector.
Further demographic information can be found in the published tables, including breakdowns by region, age, nationality, highest level of education and working pattern (full-time or part-time).
6. Civil Society:
As of the 2022 calendar year, there were a total of 942,000 filled jobs in the Civil Society sector, representing an increase of 44,000 filled jobs compared to 2019 (pre-pandemic), and an increase of 14,000 filled jobs since the 2021 calendar year.
In percentage terms, when compared to 2019 (pre-pandemic), employment in the Civil Society sector has grown more than the UK overall. However, compared to the previous calendar year, growth in employment in the sector was similar to the UK overall.
Compared to 2019 (pre-pandemic), employment in the Civil Society sector has increased by 4.9%, and in the UK overall by 0.6%. In the shorter term, from 2021 to 2022, employment in both the Civil Society sector and UK overall increased by 1.5%.

Figure 5: Change in employment within the Civil Society sector and the UK overall, 2019 to 2022.
6.1 Demographic breakdowns
According to 2022 estimates, as a proportion, within the Civil Society sector the share of filled jobs held by women and the share of filled jobs held by disabled people was larger than the UK workforce overall.
As of the 2022 calendar year, within the Civil Society sector there were 67.7% (vs 48.1% UK workforce overall) of filled jobs held by women and 22.3% (vs 16.4% UK workforce overall) held by disabled people.
Within the Civil Society sector, the share of filled jobs held by people in the Asian or Asian British ethnic group, black, African, Caribbean or black British ethnic group, and other ethnic groups was lower than the UK workforce overall. Meanwhile, the share of Civil Society sector filled jobs held by people from the mixed or multiple ethnic group and the white ethnic group was larger than the UK workforce overall.
Within the Civil Society sector, the share of filled jobs held by people from the white ethnic group was 91.0% (vs 85.6% UK workforce overall), followed by 3.2% from the Asian or Asian British ethnic group (vs 7.5% UK workforce overall), 2.9% from the black, African, Caribbean or black British ethnic group (vs 3.4 UK workforce overall), 1.8% from the mixed or multiple ethnic group (vs 1.5% UK workforce overall), and 1.1% from the other ethnic groups (vs 2.0% UK workforce overall).

Figure 6: Proportion of filled jobs in the Civil Society sector and UK workforce by selected characteristics, 2022.
Further demographic information can be found in the published tables, including breakdowns by region, age, nationality, highest level of education and working pattern (full-time or part-time).
7. Cultural Sector:
As of the 2022 calendar year, there were a total of 694,000 filled jobs in the Cultural Sector, representing an increase of 18,000 filled jobs compared to 2019 (pre-pandemic), but a decrease of 12,000 filled jobs since the 2021 calendar year.
In percentage terms, when compared to 2019 (pre-pandemic), employment in the Cultural Sector has grown faster than the UK overall. However, compared to the previous year, employment in the Cultural Sector has declined, while increasing for the UK overall.
Compared to 2019 (pre-pandemic), employment in the Cultural Sector has increased by 2.7%, and in the UK overall by 0.6%. Meanwhile, from 2021 to 2022, employment in the Cultural Sector decreased by 1.8%, and in the UK overall grew by 1.5%.

Figure 7: Change in employment within the Cultural Sector and the UK overall, 2019 to 2022.
Using UK Standard Industrial Classification 2007 (SIC) codes, DCMS use sub-sectors to disaggregate the Cultural Sector into the following groups:
- Arts
- Film, TV and music
- Radio
- Photography
- Crafts
- Museums and galleries
- Library and archives
- Cultural education
- Operation of historical sites and similar visitor attractions
A list of SIC codes appearing in each sub-sector can be found in the tables accompanying the release.
As of 2022, of the Cultural sub-sectors, the Arts sub-sector is the largest and makes up approximately 242,000 (34.9%) of the sectors’ filled jobs; a figure that remains 8,000 filled jobs (3.2%) below pre-pandemic (2019).
Despite employment in the Arts sub-sector remaining below pre-pandemic levels (2019), a number of sub-sectors experienced increases in employment over the same period, reflecting the increase in the Cultural Sector overall.
Of the Cultural sub-sectors, since 2019 (pre-pandemic), the largest increases in employment were in the Film, TV and Music sub-sector (35,000 increase) and the Radio sub-sector (11,000 increase). For more information on changes in employment within the Cultural Sector and its sub-sectors, see Table 3.
Table 3: Filled jobs (nearest thousand) in the Cultural Sector, UK and Cultural sub-sectors for the 2022 calendar year, and change compared to the previous equivalent estimate and pre-pandemic.
| Latest 2022 calendar year estimate | Change from Previous 2021 calendar year estimate | Change from Pre-pandemic 2019 calendar year estimate | |
|---|---|---|---|
| All UK Sectors | 33,739,000 | +511,000 (+1.5%) | +186,000 (+ 0.6%) |
| Cultural Sector | 694,000 | -12,000 (-1.8%) | +18,000 (+2.7%) |
| Arts | 242,000 | -5,000 (-1.8%) | -8,000 (-3.2%) |
| Film, TV and Music | 232,000 | -8,000 (-3.4%) | +35,000 (+17.6%) |
| Library and archives | 52,000 | 2,000 (+3.5%) | +3,000 (+5.2%) |
| Photography | 51,000 | -2,000 (-4.4%) | -2,000 (-3.1%) |
| Museums and Galleries | 43,000 | +500 (+1.2%) | -2,000 (-4.3%) |
| Cultural education | 33,000 | -5,000 (-12.6%) | -20,000 (-37.3%) |
| Radio | 24,000 | +6,000 (+33.4%) | +11,000 (+91.1%) |
| Operation of historical sites and similar visitor attractions | 10,000 | +1,000 (+11.8%) | +5,000 (+92.4%) |
| Crafts | 5,000 | -2,000 (-30.4%) | -5,000 (-49.0%) |
7.1 Demographic breakdowns
According to 2022 estimates, as a proportion, within the Cultural Sector the share of filled jobs held by women and the share of filled jobs held by disabled people was slightly smaller than the UK workforce overall.
As of the 2022 calendar year, within the Cultural Sector there were 45.3% (vs 48.1% UK workforce overall) of filled jobs held by women and 16.3% (vs 16.4% UK workforce overall) held by disabled people.
Within the Cultural Sector, the share of filled jobs held by people in the Asian or Asian British ethnic group, black, African, Caribbean or black British ethnic group, and other ethnic groups was lower than the UK workforce overall. Meanwhile, the share of Cultural Sector filled jobs held by people from the mixed or multiple ethnic group and people from the white ethnic group was larger than the UK workforce overall.
Within the Cultural Sector, the share of filled jobs held by people from the white ethnic group was 90.4% (vs 85.6% UK workforce overall), followed by 3.3% from the Asian or Asian British ethnic group (vs 7.5% UK workforce overall), 2.1% from the mixed or multiple ethnic group (vs 1.5% UK workforce overall), 2.1% from the black, African, Caribbean or black British ethnic group (vs 3.4 UK workforce overall), and 1.9% from the other ethnic groups (vs 2.0% UK workforce overall).

Figure 8: Proportion of filled jobs in the Cultural sub-sectors, Cultural Sector and UK workforce by selected characteristics, 2022. (note: Complete demographic information is not available for all sub-sectors)
Further demographic information can be found in the published tables, including breakdowns by region, age, nationality, highest level of education and working pattern (full-time or part-time).
Within the Cultural sub-sectors, there is great variation in the demographic characteristics of the workforce.
- Arts: As of 2022, the Arts sub-sector had an estimated share of filled jobs held by disabled people at 20.8% (vs 16.4% UK workforce overall) and by women at 46.9% (vs 48.1% UK workforce overall).
- Film, TV and Music: As of 2022, the Film, TV and Music sub-sector had an estimated share of filled jobs held by disabled people at 12.0% and by women at 35.4%.
- Library and archives: As of 2022, the Library and archives sub-sector had an estimated share of filled jobs held by disabled people at 18.5% and by women at 51.8%.
- Photography: As of 2022, the Photography sub-sector had an estimated share of filled jobs held by disabled people at 12.7% and by women at 41.0%.
- Museums and galleries: As of 2022, the Museums and Galleries sub-sector had an estimated share of filled jobs held by disabled people at 18.3% and by women at 70.1%.
- Cultural education: As of 2022, the Cultural education sub-sector had an estimated share of filled jobs held by disabled people at 12.7% and by women at 69.8%.
- Radio: As of 2022, the Radio sub-sector had an estimated share of filled jobs held by disabled people at 14.7% and by women at 40.7%.
- Operation of historical sites and similar visitor attractions: As of 2022, the Operation of historical sites and similar visitor attractions sub-sector had an estimated share of filled jobs held by women at 45.2%. A breakdown of filled jobs held by disabled people is not available for this sub-sector.
- Crafts: As of 2022, within the Crafts sub-sector 45.2% of filled jobs were held by women. A breakdown of filled jobs held by disabled people is not available for this sub-sector.
8. Sport:
As of the 2022 calendar year, there were a total of 541,000 filled jobs in the Sport sector, a figure that remained 21,000 below pre-pandemic (2019) levels, but marked an increase of 13,000 filled jobs since the 2021 calendar year.
In percentage terms, when compared to 2019 (pre-pandemic), the Sport sector experienced a decline in filled jobs, while changing little for the UK overall. However, compared to 2021, employment in the Sport sector has increased more than in the UK overall.
From 2021 to 2022, employment in the Sport sector increased by 2.5%, and in the UK overall by 1.5%. In the longer term, compared to 2019 (pre-pandemic), employment in the Sport sector has declined by 3.8%, and increased by 0.6% for the UK overall.

Figure 9: Change in employment within the Sport sector (excluding Tourism) and the UK overall, 2019 to 2022.
As of 2022, of the Sport industries, the Operation of sports facilities (SIC 93.11) is the largest and makes up approximately 196,000 (36.3%) of the sectors’ filled jobs; an increase of 11,000 (5.9%) since 2019 (pre-pandemic).
While some of the largest industries in the Sport sector have experienced increases in employment since 2019 (pre-pandemic), the majority of the sector’s industries have experienced declines in filled jobs, reflecting the mixed picture of the Sport sector over the period.
Despite employment in the Sport sector remaining below pre-pandemic levels (2019), the recent recovery in employment from 2021 to 2022 has been driven solely by it’s three largest industries: Operation of sports facilities (93.11), Activities of sports clubs (93.12) and Sports and recreation education (85.51).
8.1 Demographic breakdowns
According to 2022 calendar year estimates, as a proportion, the share of filled jobs held by women and the share of filled jobs held by disabled people was slightly smaller in the Sport sector than in the UK workforce overall.
As of the 2022 calendar year, within the Sport sector there were 45.3% (vs 48.1% UK workforce overall) filled jobs held by women and 16.1% (vs 16.4% UK workforce overall) held by disabled people.
Within the Sport sector, the share of filled jobs held by people in the Asian or Asian British ethnic group, mixed or multiple ethnic group, and other ethnic groups was lower than the UK workforce overall. Meanwhile, the share of Sport sector filled jobs held by people from the black, African, Caribbean or black British ethnic group and white ethnic group was larger than the UK workforce overall.
Within the Sport sector, the share of filled jobs held by people from the white ethnic group was 92.4% (vs 85.6% UK workforce overall), followed by 3.8% from the black, African, Caribbean or black British ethnic group (vs 3.4 UK workforce overall), 2.6% from the Asian or Asian British ethnic group (vs 7.5% UK workforce overall), 0.7% from the other ethnic groups (vs 2.0% UK workforce overall), and 0.5% from the mixed or multiple ethnic group (vs 1.5% UK workforce overall).

Figure 10: Proportion of filled jobs in the Sport sector and UK workforce by selected characteristics, 2022.
Further demographic information can be found in the published tables, including breakdowns by region, age, nationality, highest level of education and working pattern (full-time or part-time).
9. Gambling:
As of the 2022 calendar year, there were a total of 76,000 filled jobs in the Gambling sector, representing a similar figure to pre-pandemic (2019), and an increase of 2,000 filled jobs since the 2021 calendar year.
In percentage terms, much like the UK overall, employment in the Gambling sector was estimated to have changed little since 2019 (pre-pandemic). However, when compared to the previous year, employment in the Gambling sector increased at a faster rate.
Compared to 2019 (pre-pandemic), employment in the Gambling sector in 2022 had fallen by 0.5%, yet increased by 0.6% in the UK overall. On the other hand, from 2021 to 2022, employment in the Gambling sector increased by 3.4%, and in the UK overall by 1.5%.

Figure 11: Change in employment within the Gambling sector (excluding Tourism) and the UK overall, 2019 to 2022.
9.1 Demographic breakdowns
According to 2022 calendar year estimates, as a proportion, the share of filled jobs held by people classed as women and the share of filled jobs held by disabled people was smaller in the Gambling sector than in the UK workforce overall.
As of the 2022 calendar year, within the Gambling sector there were 42.4% (vs 48.1% UK workforce overall) filled jobs held by women and 12.5% (vs 16.4% UK workforce overall) held by people classed as disabled.
Within the Gambling sector, the share of filled jobs held by people in the white ethnic group (92.3%) was larger than the UK workforce overall (85.6%). In contrast, the share of filled jobs held by people from the Asian or Asian British group (3.7%) was less than the UK workforce overall (7.5%). Complete information on filled jobs by ethnicity of the Gambling sector workforce is not available due to disclosure control.

Figure 12: Proportion of filled jobs in the Gambling sector and UK workforce by selected characteristics, 2022.
Further demographic information can be found in the published tables, including breakdowns by region, age, nationality, highest level of education and working pattern (full-time or part-time).