Driver and rider testing and instructor statistics: October to December 2020
Published 18 March 2021

© Crown copyright 2021
This publication is licensed under the terms of the Open Government Licence v3.0 except where otherwise stated. To view this licence, visit nationalarchives.gov.uk/doc/open-government-licence/version/3 or write to the Information Policy Team, The National Archives, Kew, London TW9 4DU, or email: psi@nationalarchives.gov.uk.
Where we have identified any third party copyright information you will need to obtain permission from the copyright holders concerned.
This publication is available at https://www.gov.uk/government/statistics/driver-and-rider-testing-and-instructor-statistics-october-to-december-2020/driver-and-rider-testing-and-instructor-statistics-october-to-december-2020
Driver and Vehicle Standards Agency (DVSA) statistics on the numbers and pass rates for driving and riding theory and practical tests, and registered driving and riding instructors.
The key findings for the quarter October to December
The number of car practical tests conducted was lower compared to October to December 2019, as tests continued to be affected by the coronavirus (COVID-19) pandemic. 241,260 practical car driving tests were conducted in Great Britain, representing a decrease of 43.2% (Figure 1).
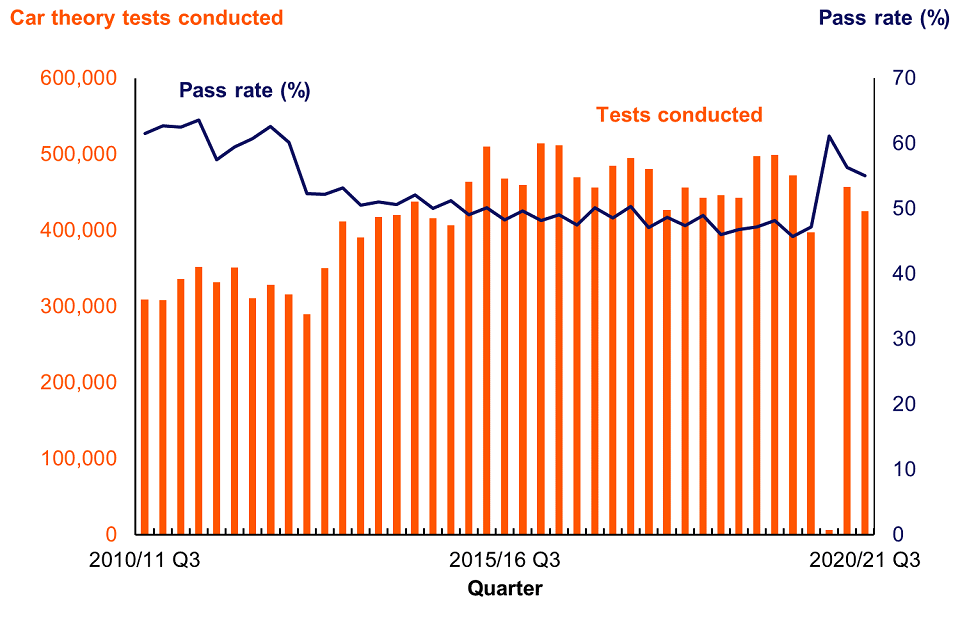
The reduction in the number of car theory tests was smaller, with 424,859 theory car driving tests conducted in Great Britain. This represents a decrease of 10.0% compared to October to December 2019 (Figure 2).
The pass rate for practical car driving tests was 49.4%, an increase of 4.0 percentage points compared to October to December 2019 (Figure 1).
For theory car driving tests, the pass rate was 55.0%, an increase of 9.2 percentage points compared to October to December 2019 (Figure 2).
Figure 1: Car practical tests conducted and pass rates, Great Britain, 2010 to 2011 (quarter 3) to 2020 to 2021 (quarter 3)
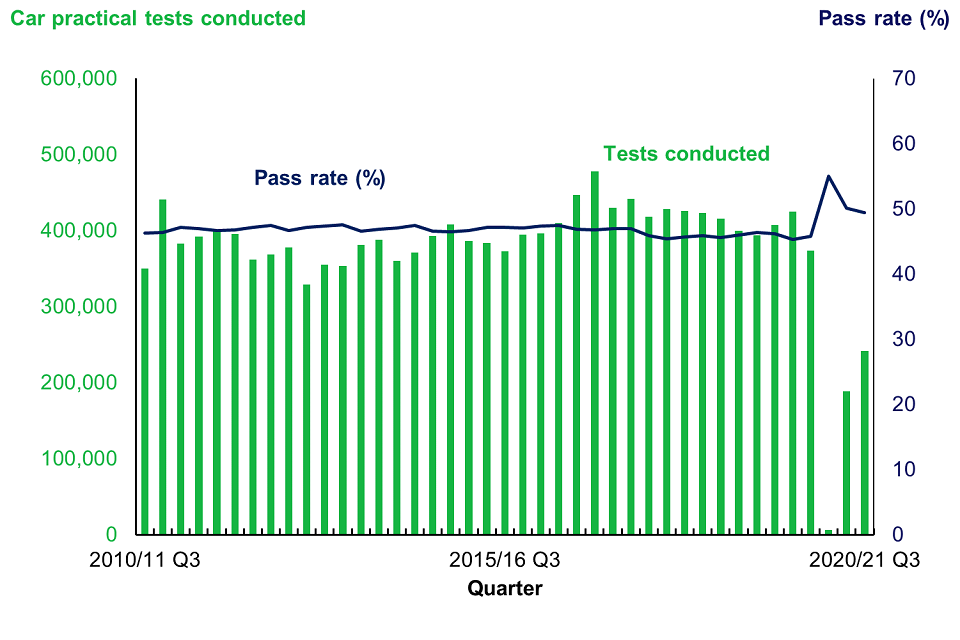
Figure 2: Car theory tests conducted and pass rates, Great Britain, 2010 to 2011 (quarter 3) to 2020 to 2021 (quarter 3)
There was also a decline in the number of practical motorcycle tests compared to October to December 2019, by -1.0% and -15.0% for practical tests module 1 and module 2 respectively, with 11,084 and 10,418 tests conducted in Great Britain for each test.
By contrast, there was an increase in motorcycle theory tests of 21.4% compared to October to December 2019, with 14,679 tests conducted in Great Britain.
The pass rate for motorcycle practical driving tests was 73.4% and 72.8% for practical tests module 1 and module 2, with respective increases of 4.0 and 2.0 percentage points compared to October to December 2019.
For motorcycle theory driving tests, the pass rate was 71.9%. This was an increase of 2.7 percentage points compared to October to December 2019.
Table 1: Car Theory and Car Practical tests by gender, Great Britain: October to December, 2019 and 2020
| October to December | 2020 | 2019 | Year on year change |
||||||
|---|---|---|---|---|---|---|---|---|---|
| Car | Tests Conducted | Tests Passed | Pass rate (%) | Tests Conducted | Tests Passed | Pass rate (%) | Tests Conducted | Tests Passed | Pass rate (percentage points) |
| Theory - Total1 |
424,859 | 233,688 | 55.0 | 472,196 | 216,091 | 45.8 | -10.0% | +8.1% | +9.2 |
| Theory - Female |
204,538 | 117,196 | 57.3 | 225,765 | 106,951 | 47.4 | -9.4% | +9.6% | +9.9 |
| Theory - Male |
220,240 | 116,428 | 52.9 | 246,331 | 109,079 | 44.3 | -10.6% | +6.7% | +8.6 |
| Practical - Total1 |
241,260 | 119,085 | 49.4 | 425,002 | 192,573 | 45.3 | -43.2% | -38.2% | +4.0 |
| Practical - Female |
118,220 | 55,381 | 46.8 | 222,115 | 93,111 | 41.9 | -46.8% | -40.5% | +4.9 |
| Practical - Male |
122,992 | 63,687 | 51.8 | 202,864 | 99,454 | 49.0 | -39.4% | -36.0% | +2.8 |
1 The sum of male and female tests may not always equal the total of all tests.
Table 2: Motorcycle tests, Great Britain: October to December, 2019 and 2020
| October to December | 2020 | 2019 | Year on year change |
||||||
|---|---|---|---|---|---|---|---|---|---|
| Motorcycle | Tests Conducted | Tests Passed | Pass rate (%) | Tests Conducted | Tests Passed | Pass rate (%) | Tests Conducted | Tests Passed | Pass rate (percentage points) |
| Theory | 14,679 | 10,556 | 71.9 | 12,088 | 8,361 | 69.2 | +21.4% | +26.3% | +2.7 |
| Practical module 1 | 11,084 | 8,132 | 73.4 | 11,191 | 7,768 | 69.4 | -1.0% | +4.7% | +4.0 |
| Practical module 2 | 10,418 | 7,584 | 72.8 | 12,253 | 8,670 | 70.8 | -15.0% | -12.5% | +2.0 |
Table 3: Large Goods Vehicle (LGV) tests, Great Britain: October to December, 2019 and 2020
| October to December | 2020 | 2019 | Year on year change |
||||||
|---|---|---|---|---|---|---|---|---|---|
| LGV | Tests Conducted | Tests Passed | Pass rate (%) | Tests Conducted | Tests Passed | Pass rate (%) | Tests Conducted | Tests Passed | Pass rate (percentage points) |
| Theory - multiple choice | 11,642 | 7,888 | 67.8 | 14,306 | 8,718 | 60.9 | -18.6% | -9.5% | +6.8 |
| Theory - hazard perception | 10,145 | 8,570 | 84.5 | 11,142 | 9,137 | 82.0 | -8.9% | -6.2% | +2.5 |
| Theory - CPC (Certificate of Professional Competency)1 | 6,790 | 5,054 | 74.4 | 8,794 | 6,103 | 69.4 | -22.8% | -17.2% | +5.0 |
| Practical - vocational | 13,418 | 7,740 | 57.7 | 17,685 | 10,403 | 58.8 | -24.1% | -25.6% | - 1.1 |
| Practical - CPC1 | 1,168 | 1,101 | 94.3 | 2,239 | 2,103 | 93.9 | -47.8% | -47.6% | + 0.3 |
1 CPC test passes are required in addition to all other LGV tests to drive professionally (i.e. as the main purpose of one’s job). CPC tests are not required to obtain a license to drive LGVs.
Table 4: Passenger Carrying Vehicle (PCV) tests, Great Britain: October to December, 2019 and 2020
| October to December | 2020 | 2019 | Year on year change |
||||||
|---|---|---|---|---|---|---|---|---|---|
| PCV | Tests Conducted | Tests Passed | Pass rate (%) | Tests Conducted | Tests Passed | Pass rate (%) | Tests Conducted | Tests Passed | Pass rate (percentage points) |
| Theory - multiple choice | 947 | 617 | 65.2 | 2,232 | 1,435 | 64.3 | -57.6% | -57.0% | +0.9 |
| Theory - hazard perception | 851 | 703 | 82.6 | 1,843 | 1,495 | 81.1 | -53.8% | -53.0% | +1.5 |
| Theory - CPC1 | 657 | 313 | 47.6 | 1,471 | 768 | 52.2 | -55.3% | -59.2% | - 4.6 |
| Practical - vocational | 682 | 380 | 55.7 | 1,874 | 1,146 | 61.2 | -63.6% | -66.8% | - 5.4 |
| Practical - CPC1 | 0 | 0 | n/a | 384 | 352 | 91.7 | -100.0% | -100.0% | n/a |
1 CPC test passes are required in addition to all other PCV tests to drive professionally (i.e. as the main purpose of one’s job). CPC tests are not required to obtain a license to drive PCVs.
Table 5: All tests (excluding CPC and ADI), Great Britain: October to December, 2019 and 2020
| October to December | 2020 | 2019 | Year on year change |
||||||
|---|---|---|---|---|---|---|---|---|---|
| All tests (excluding CPC and ADI) | Tests Conducted | Tests Passed | Pass rate (%) | Tests Conducted | Tests Passed | Pass rate (%) | Tests Conducted | Tests Passed | Pass rate (percentage points) |
| Theory | 463,123 | 262,022 | 57 | 513,807 | 245,237 | 48 | -9.9% | +6.8% | +8.8 |
| Practical | 276,862 | 142921 | 51.6 | 468,005 | 220,560 | 47.1 | -40.8% | -35.2% | +4.5 |
Table 6: Approved driving instructors (ADI) tests, Great Britain: October to December, 2019 and 2020
| October to December | 2020 | 2019 | Year on year change |
||||||
|---|---|---|---|---|---|---|---|---|---|
| ADI | Tests Conducted | Tests Passed | Pass rate (%) | Tests Conducted | Tests Passed | Pass rate (%) | Tests Conducted | Tests Passed | Pass rate (percentage points) |
| Part 1 (theory) | 2,688 | 1,425 | 53.0 | 2,620 | 1,148 | 43.8 | +2.6% | +24.1% | +9.2 |
| Part 2 (practical) | 1,107 | 692 | 62.5 | 1,402 | 830 | 59.2 | -21.0% | -16.6% | +3.3 |
| Part 3 (practical) | 1,046 | 428 | 40.9 | 1,624 | 552 | 34.0 | -35.6% | -22.5% | +6.9 |