Driver and rider testing and instructor statistics: April to June 2021
Published 23 September 2021

© Crown copyright 2021
This publication is licensed under the terms of the Open Government Licence v3.0 except where otherwise stated. To view this licence, visit nationalarchives.gov.uk/doc/open-government-licence/version/3 or write to the Information Policy Team, The National Archives, Kew, London TW9 4DU, or email: psi@nationalarchives.gov.uk.
Where we have identified any third party copyright information you will need to obtain permission from the copyright holders concerned.
This publication is available at https://www.gov.uk/government/statistics/driver-and-rider-testing-and-instructor-statistics-april-to-june-2021/driver-and-rider-testing-and-instructor-statistics-april-to-june-2021
About this release
This statistical release is published by the Department for Transport based on statistics produced by the DVSA, on the numbers and pass rates for driving and riding theory and practical tests conducted in Great Britain 1 April 2021 to 30 June 2021 (financial year quarter 1).
The driver and rider tests and instructors collection provides further detail of the key findings presented in this statistical release, including detailed data tables and operational data by test centre.
Headline figures for the quarter April to June 2021
Although tables 1 to 6 provide comparisons to 2020, it is more meaningful to compare with the equivalent quarter in 2019, as financial quarter 1 (April to June) 2020 was affected by the coronavirus (COVID-19) pandemic restrictions, with very low numbers of tests conducted (Figure 1, Figure 2).
The number of practical car driving tests conducted in Great Britain during quarter 1 (April to June) 2021 was 291,317. This is 26.0% lower compared to the 393,428 tests conducted in quarter 1 (April to June) 2019 (Figure 1).
There was a record number of 733,543 car theory tests conducted during quarter 1 (April to June) 2021, the highest ever figure for a quarter since the published series began, and 47.5% higher compared to quarter 1 (April to June) 2019 when 497,258 tests were conducted (Figure 2).
The pass rate for practical car driving tests during quarter 1 (April to June) 2021 was 51.6% (Figure 1), and for theory car driving tests in the same period the pass rate was 54.0% (Figure 2). For both types of test, pass rates during quarter 1 (April to June) 2021 were above pre-pandemic levels.
For motorcycle tests, the number of tests conducted was above pre-pandemic levels by 70% for the theory test and 18% for both practical tests, compared with 2019 quarter 1 (April to June).
The number of Large Goods Vehicles (LGV) theory tests conducted was higher compared with 2019 quarter 1 (April to June) ranging from 11% for the theory Certificate of Professional Competence (CPC) test to 31% for the hazard perception test. For LGV vocational tests, the number of tests conducted remained at similar levels to 2019 quarter 1 (April to June), whilst LGV practical CPC tests were 39% below levels in the same period.
Across all categories of Passenger Carrying Vehicle (PCV) tests, the number of tests conducted was noticeably lower in the quarter compared to pre-pandemic levels (April to June 2019). For the theory tests the fall was between 28% and 31% depending on test type, but higher for practical tests falling by 57% for the vocational test and 69% for the practical CPC test.
Figure 1: Car practical tests conducted and pass rates, Great Britain, quarterly, quarter 1 (April to June 2011) to quarter 1 (April to June 2021)
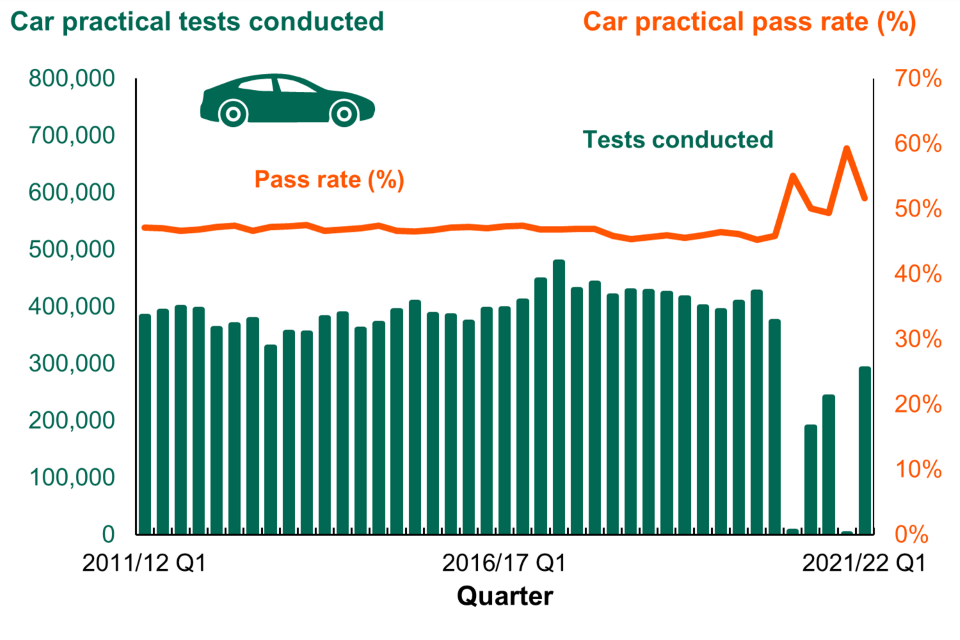
Figure 2: Car theory tests conducted and pass rates, Great Britain, quarterly, quarter 1 (April to June 2011) to quarter 1 (April to June 2021)
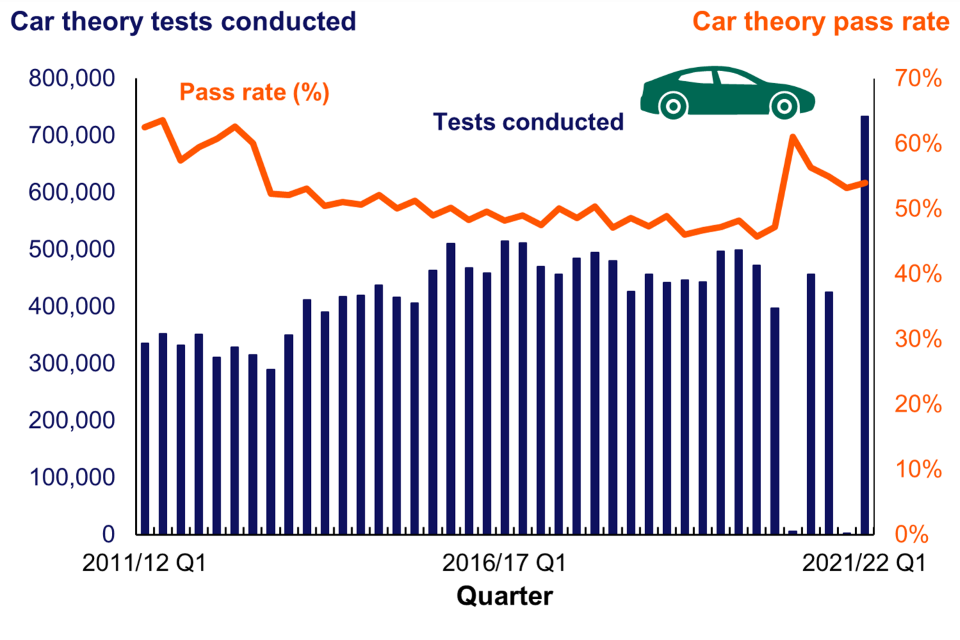
Table 1: Car Theory and Car Practical tests by gender, Great Britain, April to June (DRT0201), (DRT5201)
| Car test type | Gender | Tests Conducted (Apr to June 2021) | Tests Passed (Apr to June 2021) | Pass Rate (%) (Apr to June 2021) | Tests Conducted (Apr to June 2020) | Tests Passed (Apr to June 2020) | Pass Rate (%) (Apr to June 2020) | Tests Conducted (year on year percentage change) | Tests Passed (year on year percentage change) | Pass Rate (year on year percentage point change) |
|---|---|---|---|---|---|---|---|---|---|---|
| Practical | Total | 291,317 | 150,407 | 51.6 | 6,264 | 3,448 | 55.0 | + 4,550% | + 4,260% | - 3.4 |
| Practical | Female | 140,643 | 69,228 | 49.2 | 4,435 | 2,381 | 53.7 | + 3,070% | + 2,810% | - 4.5 |
| Practical | Male | 150,598 | 81,158 | 53.9 | 1,823 | 1,065 | 58.4 | + 8,160% | + 7,520% | - 4.5 |
| Theory | Total | 733,543 | 395,772 | 54.0 | 6,369 | 3,890 | 61.1 | + 11,400% | + 10,100% | - 7.1 |
| Theory | Female | 347,010 | 195,824 | 56.4 | 2,971 | 1,833 | 61.7 | + 11,600% | + 10,600% | - 5.3 |
| Theory | Male | 386,394 | 199,855 | 51.7 | 3,397 | 2,056 | 60.5 | + 11,300% | + 9,620% | - 8.8 |
Note: Total tests may not equal the sum of male and female tests.
Table 2: Motorcycle tests by test type, Great Britain, April to June (DRT0101), (DRT0102)
| Motorcycle test type | Tests Conducted (Apr to June 2021) | Tests Passed (Apr to June 2021) | Pass Rate (%) (Apr to June 2021) | Tests Conducted (Apr to June 2020) | Tests Passed (Apr to June 2020) | Pass Rate (%) (Apr to June 2020) | Tests Conducted (year on year percentage change) | Tests Passed (year on year percentage change) | Pass Rate (year on year percentage point change) |
|---|---|---|---|---|---|---|---|---|---|
| Theory | 36,983 | 26,936 | 72.8 | 927 | 735 | 79.3 | + 3,890% | + 3,560% | - 6.5 |
| Practical module 1 | 18,640 | 14,154 | 75.9 | 72 | 50 | 69.4 | + 25,800% | + 28,200% | + 6.5 |
| Practical module 2 | 17,073 | 12,476 | 73.1 | .. | .. | .. | .. | .. | .. |
Note: To avoid the possibility of identifying individuals taking the small number of tests carried out during the period of coronavirus (COVID-19) restrictions during April to June 2020, 2020 figures and year-on-year change figures have been redacted for motorcycle practical module 2 tests.
Table 3: Large Goods Vehicle (LGV) tests by test type, Great Britain, April to June (DRT0101), (DRT0102)
| LGV test type | Tests Conducted (Apr to June 2021) | Tests Passed (Apr to June 2021) | Pass Rate (%) (Apr to June 2021) | Tests Conducted (Apr to June 2020) | Tests Passed (Apr to June 2020) | Pass Rate (%) (Apr to June 2020) | Tests Conducted (year on year percentage change) | Tests Passed (year on year percentage change) | Pass Rate (year on year percentage point change) |
|---|---|---|---|---|---|---|---|---|---|
| Multiple choice (theory) | 19,278 | 12,600 | 65.4 | 454 | 343 | 75.6 | + 4,150% | + 3,570% | - 10.2 |
| Hazard perception (theory) | 16,273 | 13,653 | 83.9 | 372 | 323 | 86.8 | + 4,270% | + 4,130% | - 2.9 |
| Theory CPC | 10,345 | 7,697 | 74.4 | 92 | 61 | 66.3 | + 11,100% | + 12,500% | + 8.1 |
| Practical vocational | 18,761 | 10,772 | 57.4 | 631 | 499 | 79.1 | + 2,870% | + 2,060% | - 21.7 |
| Practical CPC | 1,547 | 1,466 | 94.8 | .. | .. | .. | .. | .. | .. |
Note 1: CPC test passes are required in addition to all other LGV tests to drive professionally (i.e. as the main purpose of one’s job). CPC tests are not required to obtain a license to drive LGVs.
Note 2: To avoid the possibility of identifying individuals taking the small number of tests carried out during the period of coronavirus (COVID-19) restrictions during April to June 2020, 2020 figures and year-on-year change figures have been redacted for LGV practical CPC tests.
Table 4: Passenger Carrying Vehicle (PCV) tests by test type, Great Britain, April to June (DRT0101), (DRT0102)
| PCV test type | Tests Conducted (Apr to June 2021) | Tests Passed (Apr to June 2021) | Pass Rate (%) (Apr to June 2021) | Tests Conducted (Apr to June 2020) | Tests Passed (Apr to June 2020) | Pass Rate (%) (Apr to June 2020) | Tests Conducted (year on year percentage change) | Tests Passed (year on year percentage change) | Pass Rate (year on year percentage point change) |
|---|---|---|---|---|---|---|---|---|---|
| Multiple choice (theory) | 1,516 | 999 | 65.9 | 25 | 15 | 60.0 | + 5,960% | + 6,560% | + 5.9 |
| Hazard perception (theory) | 1,339 | 1,122 | 83.8 | 20 | 14 | 70.0 | + 6,600% | + 7,910% | + 13.8 |
| Theory CPC | 979 | 493 | 50.4 | 20 | 14 | 70.0 | + 4,800% | + 3,420% | - 19.6 |
| Practical vocational | 861 | 509 | 59.1 | .. | .. | .. | .. | .. | .. |
| Practical CPC | 128 | 116 | 90.6 | 0 | 0 | n/a | n/a | n/a | n/a |
Note 1: CPC test passes are required in addition to all other PCV tests to drive professionally (such as, the main purpose of one’s job). CPC tests are not required to obtain a license to drive PCVs.
Note 2: To avoid the possibility of identifying individuals taking the small number of tests carried out during the period of coronavirus (COVID-19) restrictions during April to June 2020, 2020 figures and year-on-year change figures have been redacted for PCV vocational tests.
Table 5: Total practical and theory tests (excluding CPC and ADI tests), Great Britain, April to June (DRT0101), (DRT0102)
| Test type | Tests Conducted (Apr to June 2021) | Tests Passed (Apr to June 2021) | Pass Rate (%) (Apr to June 2021) | Tests Conducted (Apr to June 2020) | Tests Passed (Apr to June 2020) | Pass Rate (%) (Apr to June 2020) | Tests Conducted (year on year percentage change) | Tests Passed (year on year percentage change) | Pass Rate (year on year percentage point change) |
|---|---|---|---|---|---|---|---|---|---|
| Theory | 808,932 | 451,082 | 55.8 | 8,167 | 5,320 | 65.1 | + 9,800% | + 8,380% | - 9.4 |
| Practical | 346,652 | 188,318 | 54.3 | 7,047 | 4,060 | 57.6 | + 4,820% | + 4,540% | - 3.3 |
Total test definitions
Figures for total theory tests are the sum of the following theory tests:
- car
- motorcycle
- LGV multiple-choice
- LGV hazard-perception
- PCV multiple-choice
- PCV hazard-perception.
Figures for total practical tests are the sum of the following practical tests:
- car
- motorcycle module 1
- motorcycle module 2
- LGV vocational
- PCV vocational
All total test figures exclude Certificate of Professional Competence (CPC) tests and Approved Driving Instructor (ADI) tests.
Table 6: Approved Driving Instructor (ADI) tests by test type, Great Britain, April to June (DRT0101), (DRT0102)
| ADI test type | Tests Conducted (Apr to June 2021) | Tests Passed (Apr to June 2021) | Pass Rate (%) (Apr to June 2021) | Tests Conducted (Apr to June 2020) | Tests Passed (Apr to June 2020) | Pass Rate (%) (Apr to June 2020) | Tests Conducted (year on year percentage change) | Tests Passed (year on year percentage change) | Pass Rate (year on year percentage point change) |
|---|---|---|---|---|---|---|---|---|---|
| Part 1 (theory) | 5,258 | 2,691 | 51.2 | 0 | 0 | n/a | n/a | n/a | n/a |
| Part 2 (driving ability) | 2,099 | 1,332 | 63.5 | 0 | 0 | n/a | n/a | n/a | n/a |
| Part 3 (instructional ability) | 1,408 | 520 | 36.9 | 0 | 0 | n/a | n/a | n/a | n/a |
Background information
Practical test categories included are:
- B (car),
- A, A1 and A2 (motorcycles)
- C1 (medium-sized vehicles)
- C1E (medium-sized vehicles with a trailer)
- C (large vehicles)
- CE (large vehicles with a trailer)
- D1 (minibuses)
- D1E (minibuses with a trailer)
- D (buses)
- DE (buses with a trailer)
To gain a category CE licence, a driver must hold a category C licence before taking the test, whilst a category D licence is required before acquiring a category DE licence.
LGV and PCV vocational and CPC test differences
LGV and PCV practical vocational test figures are always higher than the corresponding CPC practical test figure, as CPC tests are only required to drive these vehicles professionally. Non-commercial use of these vehicles might include, for example, driving a horse box.
Official Statistics
Official Statistics are produced to the high professional standards set by the Code of Practice for Statistics. However, these statistics have not yet been assessed by the Office for Statistics Regulation.
Details of ministers and officials who receive pre-release access to these statistics up to 24 hours before release can be found in the pre-release access list.
Ethnicity information
Additional data on ethnicity of candidates are released via data.gov. This information is not published as part of the statistical release as many candidates do not declare their ethnicity. It is, therefore, highly likely that the information is subject to self-selection and reporting biases and neither DVSA nor DfT would recommend that users rely on these data being a true reflection of the ethnicity of all candidates.
Release of DfT statistics publications
To hear more about DfT statistics publications as they are released, please follow us on Twitter via our DfTstats account.
Next release
Driving and rider testing statistics are published quarterly. The next release is due in December 2021, which will cover the period up to the end of September 2021. The quarterly releases (typically published in September, December and March) have a reduced number of tables and commentary compared to the annual publication (typically published in June).
Any updates to these plans, including the exact publication date when known, will be advertised via the DfT statistical publications schedule.
Instructions for printing and saving
Depending on which browser you use and the type of device you use (such as an mobile or laptop) these instructions may vary.
You will find your print and save options in your browser’s menu. You may also have other options available on your device. Tablets and mobile device instructions will be specific to the make and model of the device.
How to search
Select Ctrl and F on a Windows laptop or Command and F on a Mac.
This will open a search box in the top right-hand corner of the page. Type the word you are looking for in the search bar and press enter.
Your browser will highlight the word, usually in yellow, wherever it appears on the page. Press enter to move to the next place it appears.
Contact details
Driving tests and instructor statistics