Detailed analysis of fires and response times to fires attended by fire and rescue services, England, year ending March 2026
Published 19 August 2026
Applies to England

© Crown copyright 2026
This publication is licensed under the terms of the Open Government Licence v3.0 except where otherwise stated. To view this licence, visit nationalarchives.gov.uk/doc/open-government-licence/version/3 or write to the Information Policy Team, The National Archives, Kew, London TW9 4DU, or email: psi@nationalarchives.gov.uk.
Where we have identified any third party copyright information you will need to obtain permission from the copyright holders concerned.
This publication is available at https://www.gov.uk/government/statistics/detailed-analysis-of-fires-england-year-ending-march-2026/detailed-analysis-of-fires-and-response-times-to-fires-attended-by-fire-and-rescue-services-england-year-ending-march-2026
Frequency of release: Annual
Forthcoming releases: Ministry of Housing, Communities and Local Government statistics release calendar
MHCLG responsible statistician: Ollie Gee
Press enquiries: NewsDesk@communities.gov.uk
Public enquiries: firestatistics@communities.gov.uk
This release presents more detailed analysis on fire incidents and response times to fires, which occurred in the year ending March 2026 (1 April 2025 to 31 March 2026) for fire and rescue services (FRSs) in England. For summary statistics and trends please refer to Fire and rescue incident statistics: England, year ending March 2026.
The statistics on fire incidents, victims of fires and response times to fires are sourced from the MHCLG’s online Fire and Rescue Data Platform (FaRDaP) and have been since November 2025. Fire data were collected by the Incident Recording System (IRS) until November 2025.
As FaRDaP is a continually updated database, the statistics published in this release may not match those held locally by FRSs and revisions may occur in the future (see the revisions section for further detail). This may be particularly relevant for fire-related fatalities, where a coroner’s report could lead to revisions in the data some time after the incident. It should also be noted that the numbers of fire-related fatalities are prone to year-on-year fluctuations, due to relatively low numbers. The year ending March 2018 had a particularly high number of fire-related fatalities due to the Grenfell Tower fire, though this year is not one of the comparator years in this release. On 4 September 2024, the final report of the inquiry was published (Grenfell Tower Inquiry: Phase 2 Report). The findings of this report may affect future statistics that include the Grenfell Tower fire.
All fire-related Ministerial responsibilities moved from the Home Office to the Ministry of Housing, Communities and Local Government (MHCLG) on 1 April 2025. This change followed a key recommendation from the Phase 2 report of the Grenfell Tower Inquiry, to bring all fire safety functions under one department. Therefore, as part of this move, all statistical publications and analysis on fire functions were also subject to the Machinery of Government (MoG) change.
Key results
In the year ending March 2026, there were:
- 170,597 fires attended by FRSs in England, an increase of 19% compared with the year ending March 2025 (143,049), an increase of 13% compared with 5 years ago (151,115) and an increase of 5.1% compared with 10 years ago (162,301) Source: FIRE0102
- 254 fire-related fatalities, a decrease of 9.3% compared with the previous year (280), an increase of 7.6% compared with 5 years ago (236), and a decrease of 17% compared with 10 years ago (305) Source: FIRE0502
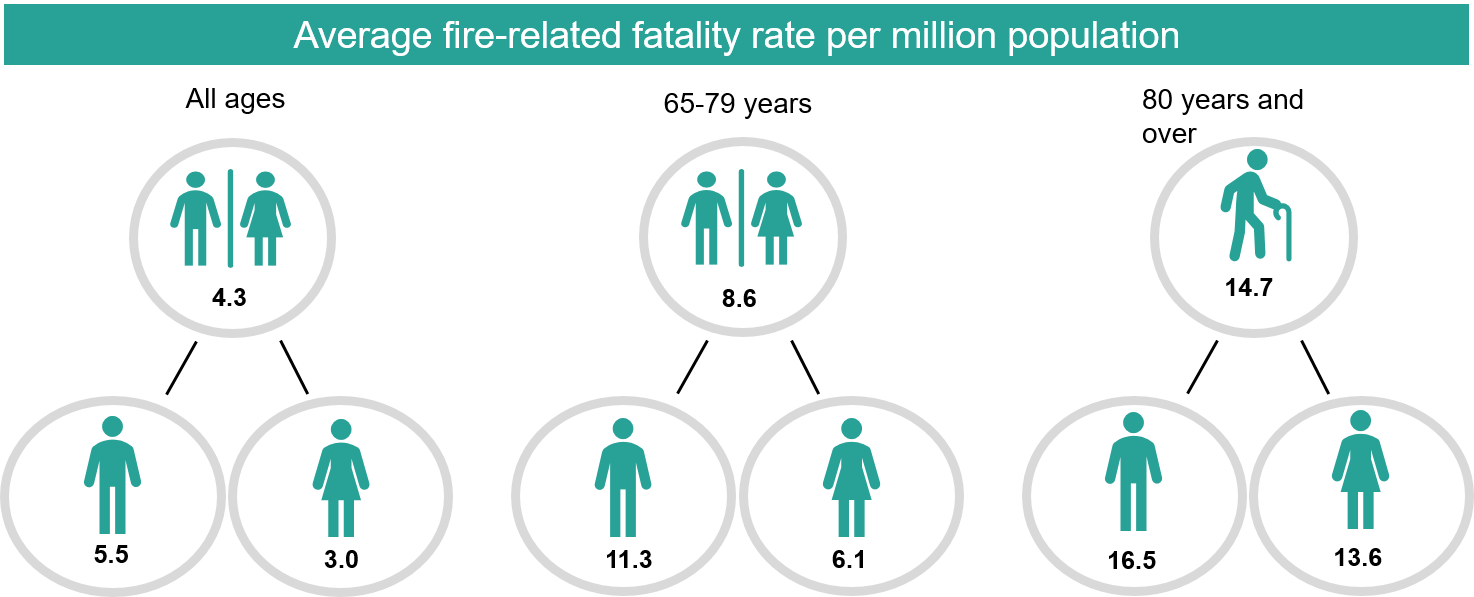
- 14.7 fire-related fatalities per million people[footnote 1] for those aged 80 years old and over, compared with 4.3 fire-related fatalities per million people of all ages Source: FIRE0503
- 5.5 fire-related fatalities per million population for men of all ages, compared with 3 fire-related fatalities per million for women of all ages Source: FIRE0503
Figure KR.1: Average fire-related fatality rate per million population
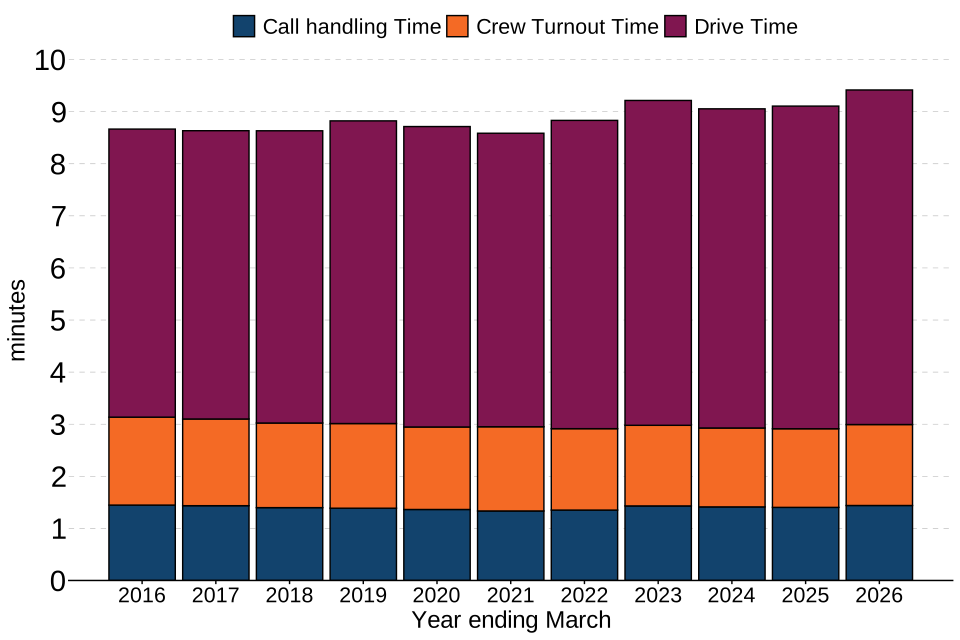
- the average response time to primary fires was 9 minutes and 25 seconds: an increase of 19 seconds compared with the previous year Source: FIRE1001
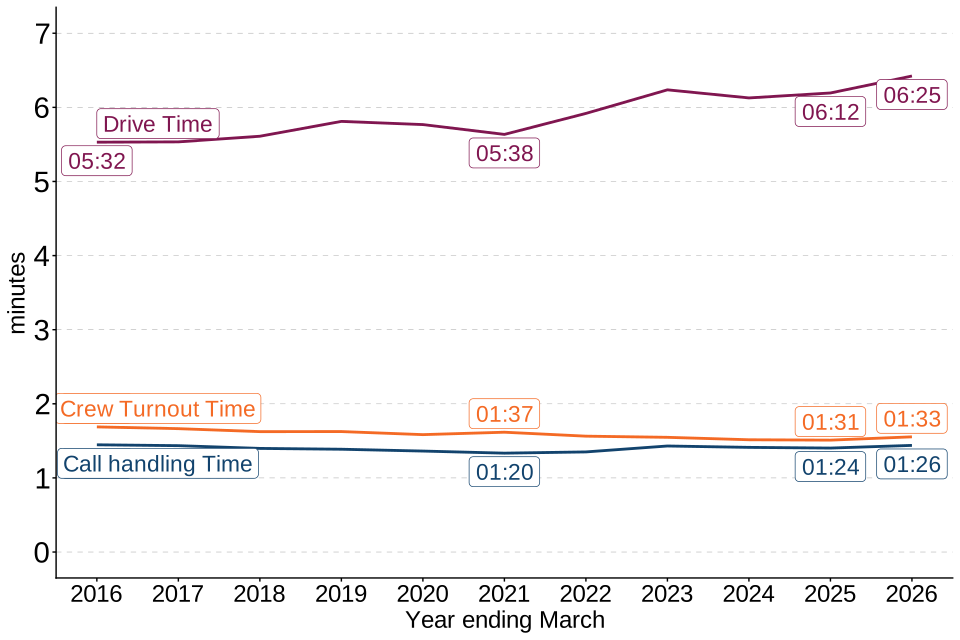
- the largest component was drive time (68%), which showed an increase of 13 seconds to 6 minutes and 25 seconds Source: FIRE1001
Figure KR.2: Response times to primary fires by component
1. Overview of fires attended
1.1 Key results
In the year ending March 2026:
- fires accounted for 27% of the 641,227 incidents attended by FRSs compared with 24% in the previous year, 29% 5 years ago and 31% 10 years ago; Source: FIRE0102
- there were 109,473 outdoor fires, an increase of 31% compared with the previous year (83,806), an increase of 20% compared with 5 years ago (91,543) and an increase of 22% compared with 10 years ago (89,817) (see Seasonal fire analyses)
- the month with the most fires attended by FRSs per day was August 2025 (an average of 714.5), in comparison the month with the most fires in the previous year was August 2024 (an average of 538.2); Source FIRE0802
Fire incidents are broadly categorised as primary, secondary or chimney fires, depending on the location, severity, and risk levels of the fire, and on the scale of response needed from FRSs to contain them. Primary fires are those considered to be the most serious or with a threat to life or property. See Fire statistics definitions guidance for detailed definitions of types of fires.
1.2 Trends in fire incidents
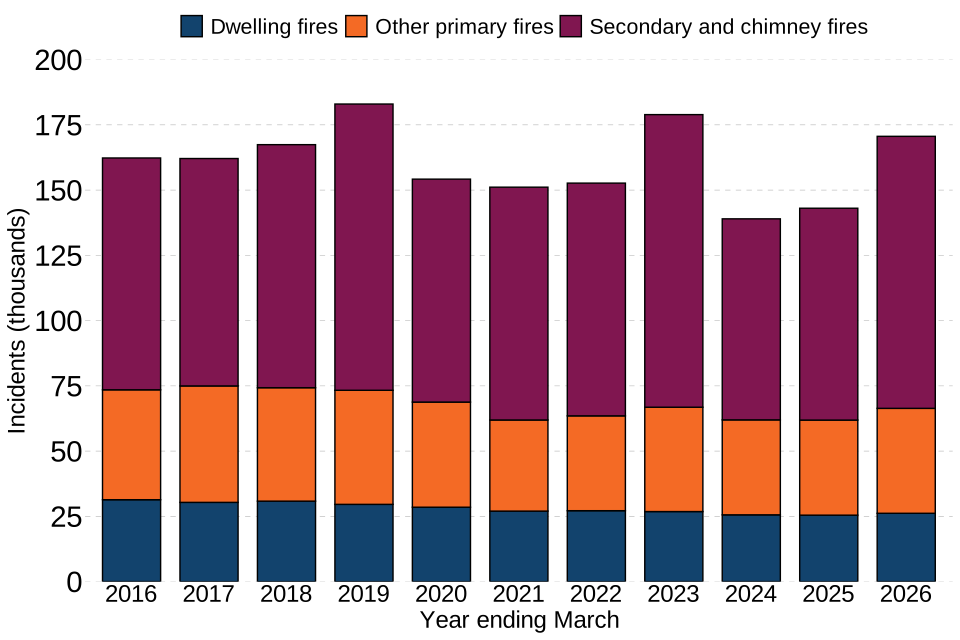
For around a decade, the total number of fires attended by FRSs decreased - falling by around two-thirds from a peak of around 474,000 in the year ending March 2004 to around 154,000 in the year ending March 2013. The total number of fires has fluctuated annually since year ending March 2013 between 138,000 and 183,000, with peaks in the year ending March 2019 and 2023, due to the hot, dry summers of 2018 and 2022 leading to more outdoor fires (primary outdoor and secondary fires). The latest year ending March 2026 shows a similar peak in the number of fires (170,597), also due to relatively hot, dry weather particularly in the spring as well as the summer of 2025.
The proportion of total fires that were outdoor fires has increased from a low of 50% in the year ending March 2013 to 64% in the year ending March 2026, the second-highest proportion since the year ending March 2004.
On the other hand, the two lowest figures recorded, since comparable statistics became available in the year ending March 1996, were the years ending March 2024 and 2025, due to cool and wet weather in these years (Source: Met Office). This contributes to an increase of 19% in fires attended by FRSs in England. The year ending March 2021 had the previous lowest figure recorded, likely because of the impact of restrictions in response to the COVID-19 pandemic (see figure 1.1).
Table 1: Number of fires, comparing the year ending March 2026 with 1, 5 and 10 years previously
| Incident Type | Year ending March 2026 | Year ending March 2025 | 1-year change | Year ending March 2021 | 5-year change | Year ending March 2016 | 10-year change |
|---|---|---|---|---|---|---|---|
| Fires | 170,597 | 143,049 | 19% | 151,115 | 13% | 162,301 | 5.1% |
| Primary fires | 66,383 | 61,889 | 7.3% | 61,924 | 7.2% | 73,495 | -9.7% |
| Dwelling fires | 26,180 | 25,465 | 2.8% | 27,018 | -3.1% | 31,385 | -17% |
| Accidental dwelling fires | 23,795 | 22,996 | 3.5% | 24,287 | -2.0% | 28,367 | -16% |
| Road vehicle fires | 19,600 | 18,546 | 5.7% | 17,525 | 12% | 20,864 | -6.1% |
| Other building fires | 13,679 | 13,193 | 3.7% | 11,924 | 15% | 16,028 | -15% |
| Outdoor primary fires | 6,924 | 4,685 | 48% | 5,457 | 27% | 5,218 | 33% |
| Secondary fires | 102,549 | 79,121 | 30% | 86,086 | 19% | 84,599 | 21% |
| Chimney fires | 1,665 | 2,039 | -18% | 3,105 | -46% | 4,207 | -60% |
Source: MHCLG, FIRE0102, FIRE0202
Figure 1.1: Fires attended by type of fire, England; the year ending March 2016 to the year ending March 2026
Source: FIRE0102
Seasonal fire analyses
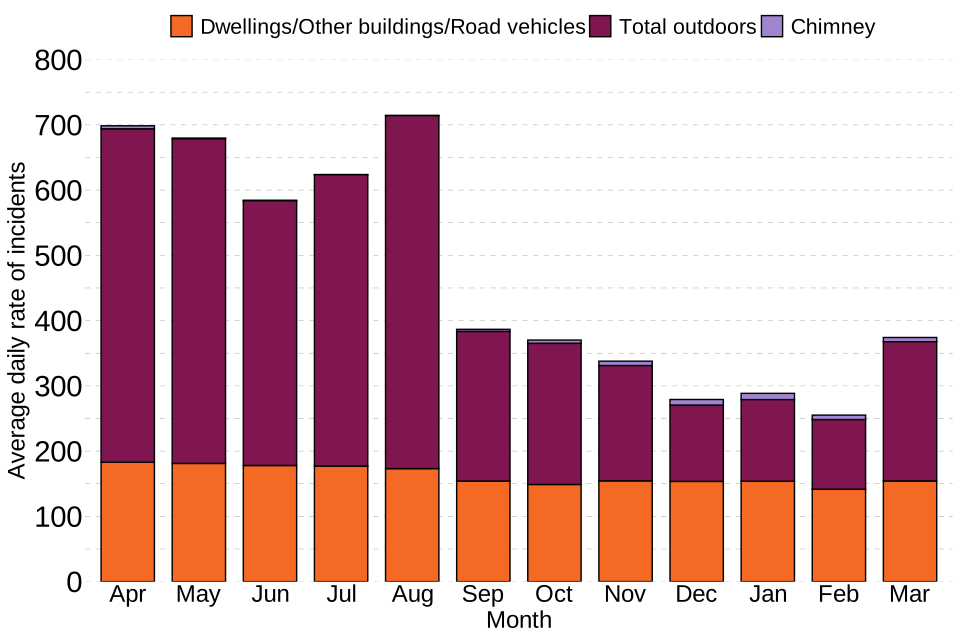
Very little seasonality was evident in dwelling fires, but other buildings and road vehicle fires showed a small increase in the summer months. Primary outdoor, secondary and chimney fires showed much stronger seasonal effects. There tends to be more grassland, refuse and other outdoor fires in the summer months and these seem to reflect weather patterns (see FIRE0802). Conversely, chimney fires are more numerous in the winter months. These seasonal effects are broadly similar each year but are affected by changes in weather patterns specific to that year, for example in the year ending March 2026 the average number of fires per day peaked in August (714.5), while in the previous year they were also highest in August but at a lower rate than the year ending March 2026 (538.2).
Figure 1.2 shows the average daily number of different types of fires in the year ending March 2026. It shows how stable the number of dwelling, other building and road vehicle fires are across months, compared with seasonal outdoor fires and, to a lesser extent, chimney fires. Due to a hot and dry spring in 2025 (Source: Met Office), a large number of average daily fire incidents are seen in April (698.5) and May 2025 (679.7), much higher than April (354.1) and May (382.2) in the previous year.
Figure 1.2: Average daily fire incidents by month and location, England; the year ending March 2026
Source: MHCLG, FIRE0802
The daily rate of all fires for the year ending March 2026 was 467.4 fires per day, of which 299.9 per day (64%) were outdoor fires. This daily rate was a 19% increase when compared with the previous year which had an average of 391.9 fires per day, of which 229.6 fires per day (59%) were outdoor fires (Source: Met Office).
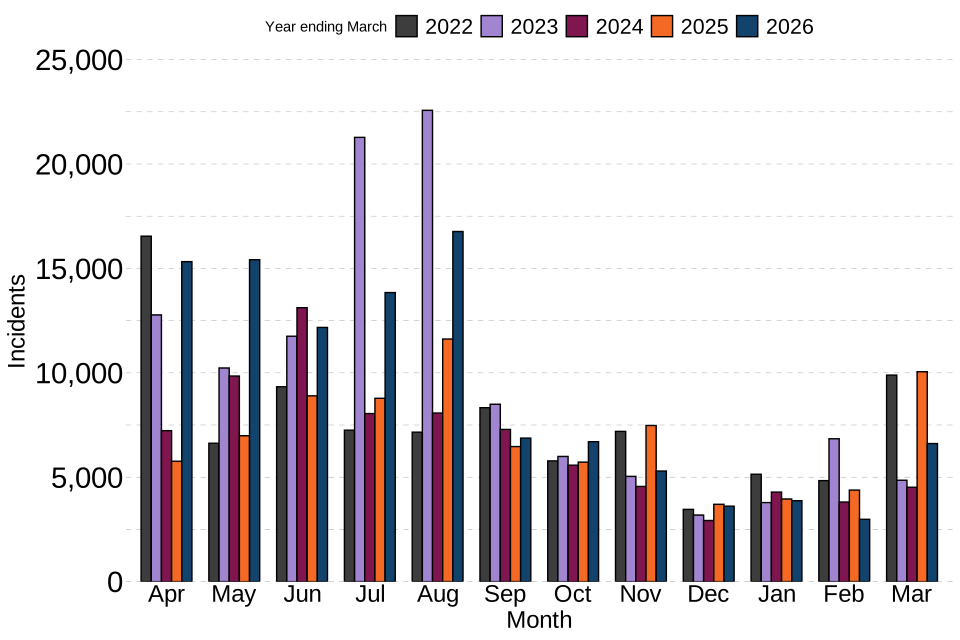
Figure 1.3 shows the number of outdoor fires attended across each month over the last 5 years. There were a particularly large number of outdoor fires in the quarter April to June 2025, influenced by a hot, dry spring.
The largest number of outdoor fires attended for a quarter in year ending March 2026 was in April to June 2025 (42,910); in comparison, in the year ending March 2025, July to September 2024 (26,864) saw the highest quarterly figure for that year. Through the timeseries, the quarter April to June usually has the highest number of outdoor fire incidents. The quarters April to June and July to September 2025 had more outdoor fires than the previous year, while October to December 2024 and January to March 2025 had higher numbers of outdoor fires than respective quarters in the latest year (Source: FIRE0802).
Figure 1.3: Outdoor fires attended by month, England; year ending March 2022 to year ending March 2026
Source: MHCLG, FIRE0802
Temporal fire analyses
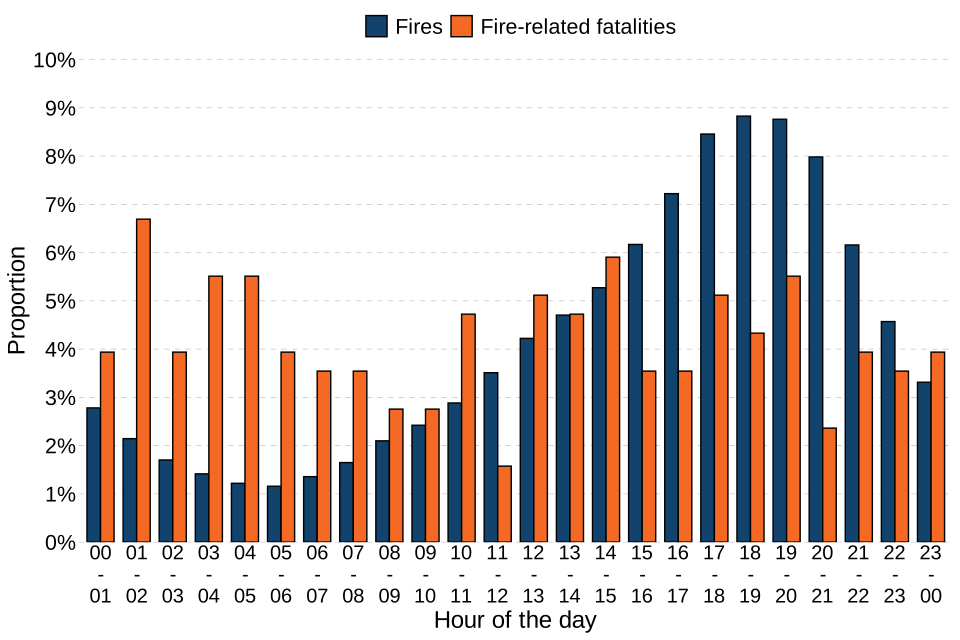
Each of the 7 individual hours between 15:00 and 22:00 (by time of call) had the highest proportion of fires, which is consistent with all previous years. These 7 hours accounted for over 50% of fire incidents. The peak hours were between 17:00 and 21:00, with each hour accounting for more than 8% of fires in the year ending March 2026, similar to previous years. (Source: FIRE0801)
The number of fire-related fatalities by hour showed less of a pattern across the day, but did show peaks during the night. The time with the highest proportion of fire-related fatalities was 01:00 to 02:00, accounting for 6.7% of fire-related fatalities.
Figure 1.4: Percentage of fires and fire-related fatalities by hour of the day, England; the year ending March 2026
Source: MHCLG, FIRE0801
2. Fire-related fatalities, non-fatal casualties, rescues, and evacuations
2.1 Key results
In the year ending March 2026:
- there were 254 fire-related fatalities, a decrease of 9.3% compared to year ending March 2025 (280); Source: FIRE0502
- men had a greater likelihood of dying in a fire than women (5.5 fire-related fatalities per million population for males compared with 3 per million for females); Source: FIRE0503
- there were 2,084 people rescued from dwelling fires, a decrease of 2.2% compared to year ending March 2025 (2,131); Source: FIRE0511
- there were 982 dwelling fire incidents involving an evacuation, an increase of 2.0% compared to year ending March 2025 (963); Source: FIRE0511
The key results of fire-related fatalities, non-fatal casualties, rescues, and fire-related incidents involving an evacuation have been summarised in table 2.1 below.
Table 2.1: Number of fatal fires, fire-related fatalities, non-fatal casualties, rescues, and fire incidents involving an evacuation, comparing the year ending March 2026 with 1, 5 and 10 years previously
| Victim type | Year ending March 2026 | Year ending March 2025 | 1-year change | Year ending March 2021 | 5-year change | Year ending March 2016 | 10-year change |
|---|---|---|---|---|---|---|---|
| Fire-related fatalities | 254 | 280 | -9.3% | 236 | 7.6% | 305 | -17% |
| Fatal fires | 239 | 255 | -6.3% | 223 | 7.2% | 268 | -11% |
| Non-fatal casualties | 6,848 | 6,449 | 6.2% | 6,371 | 7.5% | 7,673 | -11% |
| Rescues from dwelling fires | 2,084 | 2,131 | -2.2% | 2,289 | -9.0% | 2,568 | -19% |
| Dwelling fires with an evacuation | 982 | 963 | 2.0% | 1,091 | -10.0% | 1,375 | -29% |
2.2 Fire-related fatalities and non-fatal casualties by location of fire
In the year ending March 2026, there were:
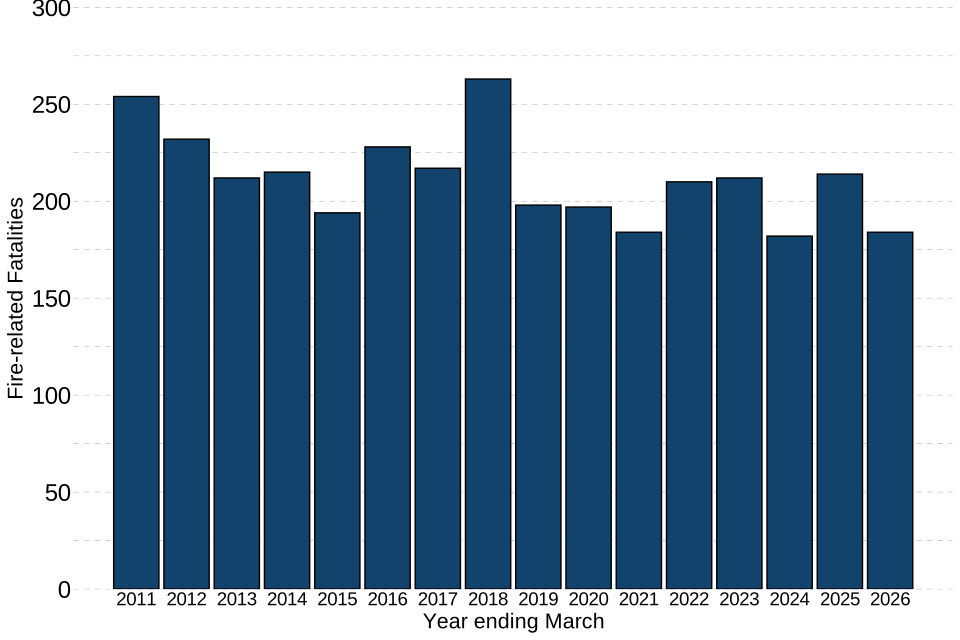
- 184 dwelling fire-related fatalities (72% of all fire-related fatalities), a decrease of 14% compared to the previous year (214); Source: FIRE0502
- 17 other building fire-related fatalities (6.7% of all fire-related fatalities), an increase of 21% compared to the previous year (14); Source: FIRE0502
- 37 road vehicle fire-related fatalities (15% of all fire-related fatalities), an increase of 23% compared to the previous year (30); Source: FIRE0502
- 16 other outdoor fire-related fatalities (6.3% of all fire-related fatalities), a decrease of 27% compared to the previous year (22); Source: FIRE0502
Figure 2.1: Number of fire-related fatalities in dwelling fires, England; the year ending March 2011 to the year ending March 2026
Source: MHCLG, FIRE0502
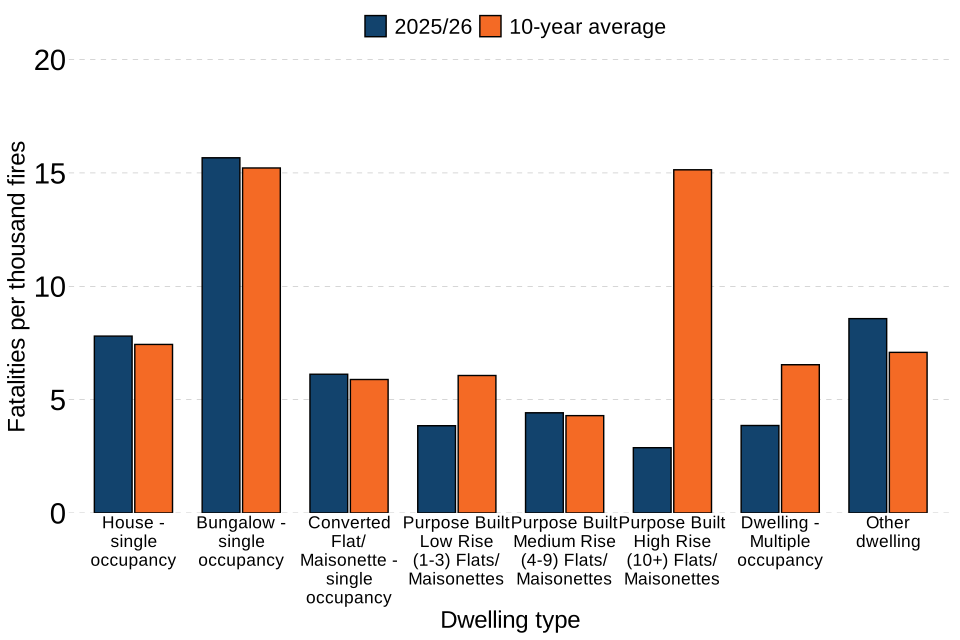
The majority of dwelling fire-related fatalities occur in houses (57%), while the majority of dwelling fires also occur in houses (51%). There were 7.8 fatalities per thousand fires in houses in the year ending March 2026, similar to the ten-year average rate (7.4).
In the year ending March 2026, the highest rate of fatalities per thousand fires was in bungalows (15.7), which was also similar to the rate over the last decade (15.2).
The ten-year average rate of fatalities per thousand fires in purpose-built high-rise flats/maisonettes is higher in figure 2.2 due to the 72 fire-related fatalities in the Grenfell Tower fire contributing to 73 fire-related fatalities in high-rise flats in the year ending March 2018. In the year ending March 2026, there were 2 fire-related fatalities in purpose-built high-rise flats of 27 fire-related fatalities in all purpose-built flats/maisonettes, and the rate of fatalities per thousand fires was lowest in high-rise flats (2.9); Source: FIRE0205.
Figure 2.2: Fire-related fatalities per thousand fires in dwelling fires by dwelling type, England; the year ending March 2026 compared to the 10-year average
Source: MHCLG, FIRE0205
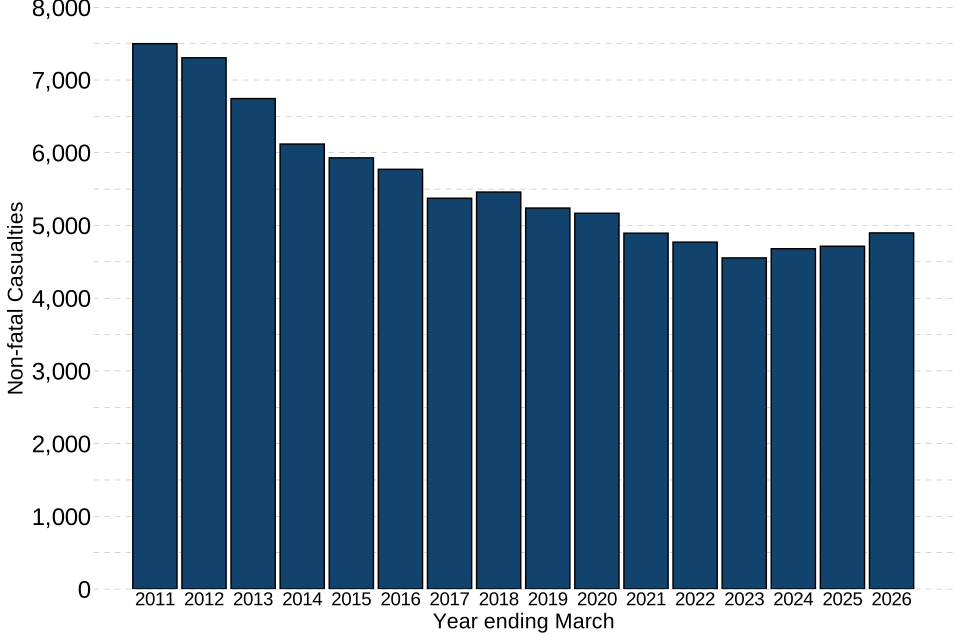
In the year ending March 2026, there were 6,848 non-fatal casualties. When considered by type of fire, there were the following trends:
- 4,898 non-fatal casualties in dwelling fires (72% of all casualties), an increase of 3.9% on the previous year (4,714)
- 991 non-fatal casualties in other building fires (14% of all casualties), an increase of 7.7% on the previous year (920)
- 516 non-fatal casualties in road vehicle fires (7.5% of all casualties), an increase of 4.2% on the previous year (495)
- 443 non-fatal casualties in other outdoor fires (6.5% of all casualties), an increase of 38% on the previous year (320)
Figure 2.3: Number of non-fatal casualties in dwellings, England; the year ending March 2011 to the year ending March 2026
Source: MHCLG, FIRE0502
2.3 Fire-related fatalities and non-fatal casualties by gender and age
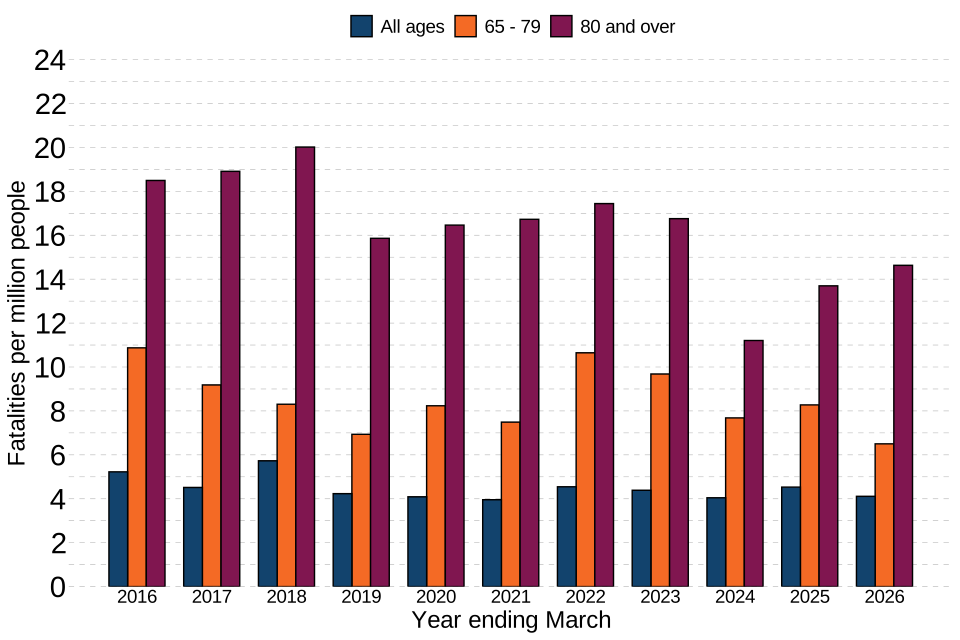
The likelihood of dying in a fire generally increases with age, as illustrated in figure 2.4. In the year ending March 2026, 40% of all fire-related fatalities in England were in people aged 65 years and over. This was a decrease of 0.6 percentage points compared to the previous year (41%).
When broken down by age group, the fatality rate was:
- 8.6 fatalities per million people for those aged 65 to 79 years old, while in the year ending March 2025 there were 8.8 fatalities per million people aged 65 to 79; Source: FIRE0503
- 14.7 fatalities per million people for those aged 80 years old and over, compared with 15.2 fatalities per million people in this age category in the year ending March 2025 see figure 2.4; Source: FIRE0503
- for the age band covering those aged 10 years and under, there were 1.3 fatalities per million people, while in the year ending March 2025 there were 1.2 fatalities per million people; Source: FIRE0503
- the lowest rate was among those aged 6 to 10 years old at 0.9 fatalities per million people, which compares to 0.8 in the same age category in the year ending March 2025; Source: FIRE0503
In the year ending March 2026, 38% of all fire-related non-fatal casualties in England were in people aged between 25 and 54 years old. This was a decrease of 1 percentage point on the previous year (39%). However, the non-fatal casualty rate was highest in those aged 80 years and over (167.8 casualties per million people).
Figure 2.4: Fatality rate (fatalities per million people) for all ages and selected age bands, England; the year ending March 2016 to the year ending March 2026
Source: FIRE0503a
Men have a greater likelihood of dying and getting injured in a fire than women. In the year ending March 2026, there were 156 male fire-related fatalities, compared with 92 for females (5.5 fatalities per million people among men, compared with 3 fatalities per million people among women); Source: FIRE0503.
In the year ending March 2026, there were 3,978 male non-fatal casualties (131.3 per million) compared to 2,581 for females (81.9 per million); Source: FIRE0503.
2.4 Causes of deaths and injuries
FaRDaP records the cause of death or nature of injury for fire-related fatalities and non-fatal casualties in fires. In the year ending March 2026, where known, the most common cause of death for fire-related fatalities was ‘burns’ (78). ‘Burns’ accounted for 31% of fire-related fatalities and compares with 31% (86) of fire-related fatalities the previous year. The proportions for causes of death of fire-related fatalities are fairly stable across most years. In the year ending March 2026, the category of ‘unspecified’ decreased by 2.4% on the previous year to 40, accounting for 16% of fire-related fatalities. (Source: FIRE0504)
There were 4,314 non-fatal casualties in accidental dwelling fires in the year ending March 2026. Of the 42% of non-fatal casualties in accidental dwelling fires[footnote 2] requiring hospital treatment (1,832), in the year ending March 2026:
- 772 were caused by ‘overcome by gas or smoke’ (42%), the largest category of injury
- 402 were caused by ‘burns’ (22%)
- 330 were caused by ‘other breathing difficulties’ (18%)
- All the other categories combined comprised the remaining 18% of injuries requiring hospital treatment in accidental dwelling fires. (Source: FIRE0506)
2.5 Rescues and evacuations
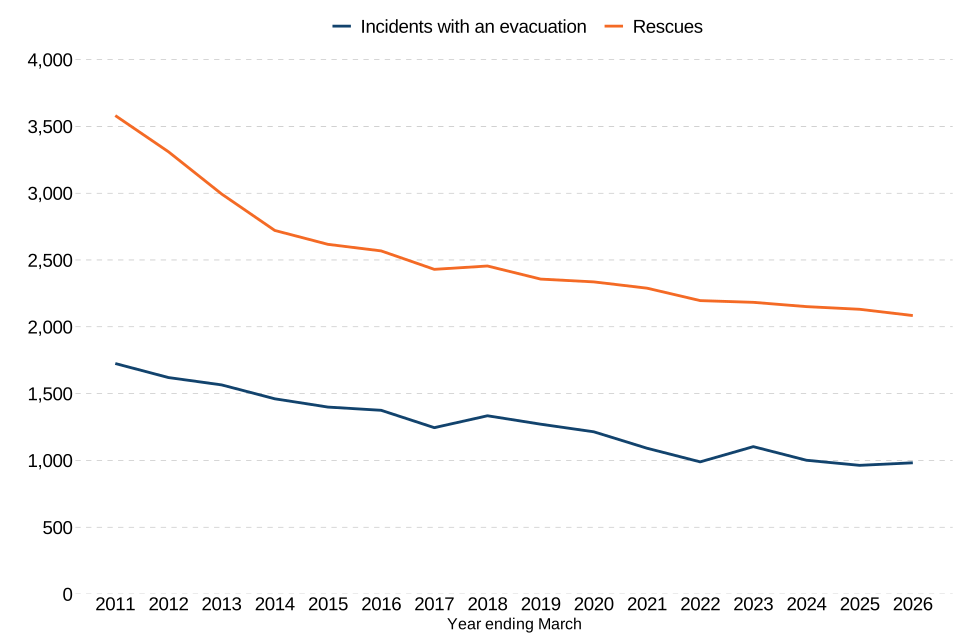
In the year ending March 2026, 73% of rescues from primary fires were in dwellings. The number of people rescued from dwellings attended by FRSs has generally been on a downward trend since data started being collected online, decreasing from 3,682 in the year ending March 2010 to 2,084 in the year ending March 2026, see figure 2.5.
Figure 2.5: Number of people rescued and incidents involving an evacuation from dwelling fires, England; the year ending March 2011 to the year ending March 2026
Source: FIRE0511
The number of dwelling fires attended that involved an evacuation has also generally been on a downward trend, see figure 2.5, decreasing from 1,725 in the year ending March 2011 to 982 in the year ending March 2026.
3. Extent of damage and spread of fire
The extent of damage (due to smoke, and or heat, and or water) to dwellings and other buildings is recorded by the area in square metres (m2) broken down into 13 categories, from ‘None’ up to ‘Over 10,000’ square metres[footnote 3]. Dwelling fires with more than 5,000m2 of damage and other buildings fires with more than 1,000m2 of damage can skew the averages, so were removed from the averages reported here[footnote 4]. However, for completeness, other calculations are available in tables FIRE0204 and FIRE0305, which accompany this release.
The spread of fire in dwellings and other buildings is recorded according to the extent the fire reached different parts of the building, based on 8 categories from ‘no fire damage’ to ‘fire spread to the whole building’.
3.1 Key results
In the year ending March 2026:
- the average area of damage to dwellings was 14.6m2, a decrease of 1.4% compared with the previous year (14.8m2)
- the average area of damage to other buildings was 23.4m2, an increase of 4.9% compared with the previous year (22.3m2)
- 29% of dwelling fires had no fire damage and 14% were larger fires, compared with 29% and 13%, respectively, the previous year [footnote 5]
- 22% of other building fires had no fire damage and 30% were larger fires, compared with 22% and 26%, respectively, the previous year.
3.2 Extent of damage
The average extent of damage to dwellings has generally decreased, since the year ending March 2004. In the latest year, the average area of damage to dwellings in England has decreased by 1.4% on the previous year (Source: FIRE0204).
The average area of damage to other buildings (excluding those over 1,000m2) has been on a fluctuating but generally downward trend since the year ending March 2010 (from when the average extent of damage to other buildings started being more accurately recorded)[footnote 6]. In the latest year, the average area of damage to other buildings in England was 23.4m2, which is the second-lowest figure over the period (Source: FIRE0305).
3.3 Spread of fire
In the year ending March 2026, nearly one-third (29%) of dwelling fires had no fire damage, in around a third (34%) the damage was limited to the item first ignited and in roughly a quarter (22%) the damage was limited to the room of origin. The remaining 14% of dwelling fires were larger fires. (Source: FIRE0203)
In the year ending March 2026, 22% of other building fires had no fire damage, for 29% the damage was limited to the item first ignited and for 20% the damage was limited to the room of origin. The remaining 30% of other building fires were larger fires. (Source: FIRE0304)
4. Causes of dwelling fires and fire-related fatalities
FaRDaP collects information on the source of ignition, the cause of fire, which item or material was mainly responsible for the spread of the fire, and ignition power [footnote 7].
4.1 Key results
In the year ending March 2026:
- of the 23,795 accidental dwelling fires[footnote 8], 27% were caused by ‘misuse of equipment or appliances’, a decrease of 1.2 percentage points compared to 29% in the year ending March 2025; Source: FIRE0601
- there were 2,385 deliberate dwelling fires, a decrease of 3.4% on the previous year (2,469); Source: FIRE0601
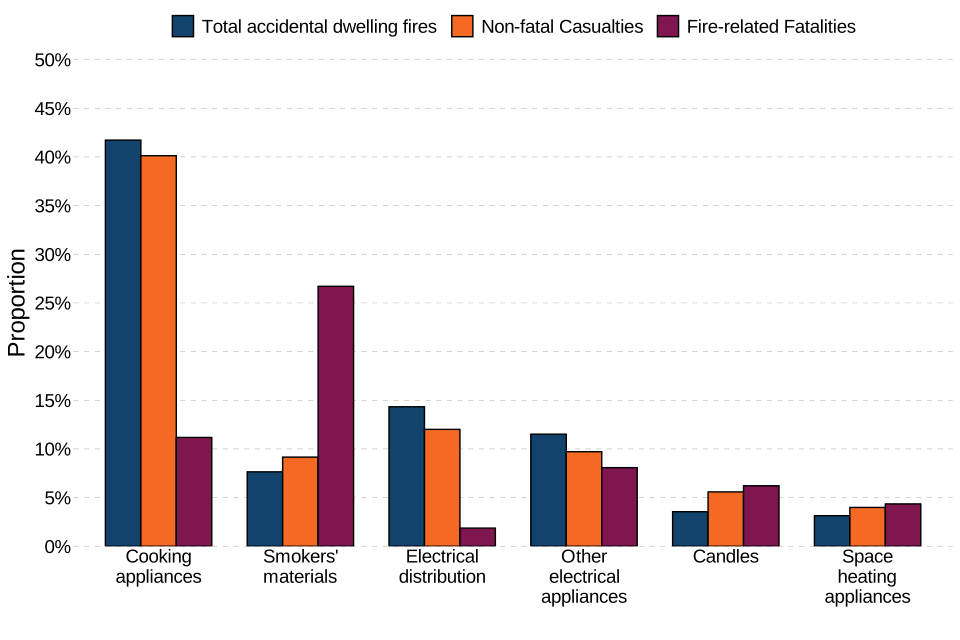
- cooking appliances were the largest specified ignition category for accidental dwelling fires, accounting for 42% of these fires, but only 11% of the fire-related fatalities; Source: FIRE0602
- smoking materials were the source of ignition in 7.6% of accidental dwelling fires, but accounted for the largest proportion of fire-related fatalities in accidental dwelling fires at 27%
4.2 Sources of ignition in accidental dwelling fires
Since the year ending March 2011 (when the data was first recorded), the number of accidental dwelling fires has decreased by 25%. While the number of accidental dwelling fires with ‘cooking appliances’ as the source of ignition have decreased by 37% since year ending March 2011, it still accounts for 42% of all accidental dwelling fires, in comparison it accounted for 50% of accidental dwelling fires in year ending March 2011. The decrease in accidental dwelling fires has been driven by reductions in the number of fires with a known source of ignition. However, the number of accidental dwelling fires with ‘Other/unspecified’ source of ignition has increased by 36%, accounting for 16% of all accidental dwelling fires. (Source: FIRE0602)
Figure 4.1 shows the proportion of accidental dwelling fires, and their resulting non-fatal casualties and fire-related fatalities, attributable to different sources of ignition[footnote 9]. While cooking appliances account for the largest proportion of ignition source for accidental dwelling fires and non-fatal casualties, ‘smokers materials’ accounts for the largest source of ignition for fire-related fatalities. (Source: FIRE0601, Dwelling fires dataset)
Figure 4.1: Percentage of fires, non-fatal casualties, and fire-related fatalities in accidental dwelling fires by selected sources of ignition, England; year ending March 2026
Source: MHCLG, FIRE0602
The source of ignition that accounted for the largest proportion of other building fires (excluding other and unspecified) was ‘electrical distribution’ (17%), while the largest specified ignition source for fire-related fatalities was ‘space heating appliances’ (29%).
4.3 Main cause of, and material mainly responsible for, dwelling fires
Exactly how a fire originated, and the material that was mainly responsible for it spreading, are both important determinants in the outcomes of fires. Similarly to sources of ignition, the most common causes and materials responsible for the spread of fires are not those that lead to the greatest proportion of fire-related fatalities.
Of the 26,180 dwelling fires in the year ending March 2026:
- 27% were caused by ‘misuse of equipment or appliance’, see figure 4.2, a decrease of 1.2 percentage points when compared to 29% in the previous year; Source: Dwelling fires dataset
- ‘textiles, upholstery and furnishings’ was the material mainly responsible for the spread of primary dwelling fires in 22% of cases, but 48% of associated fire-related fatalities; it was the item first ignited in 27% of primary dwelling fires; Source: FIRE0603
Figure 4.2: Percentage of accidental dwelling fires by cause of fire, England; year ending March 2026
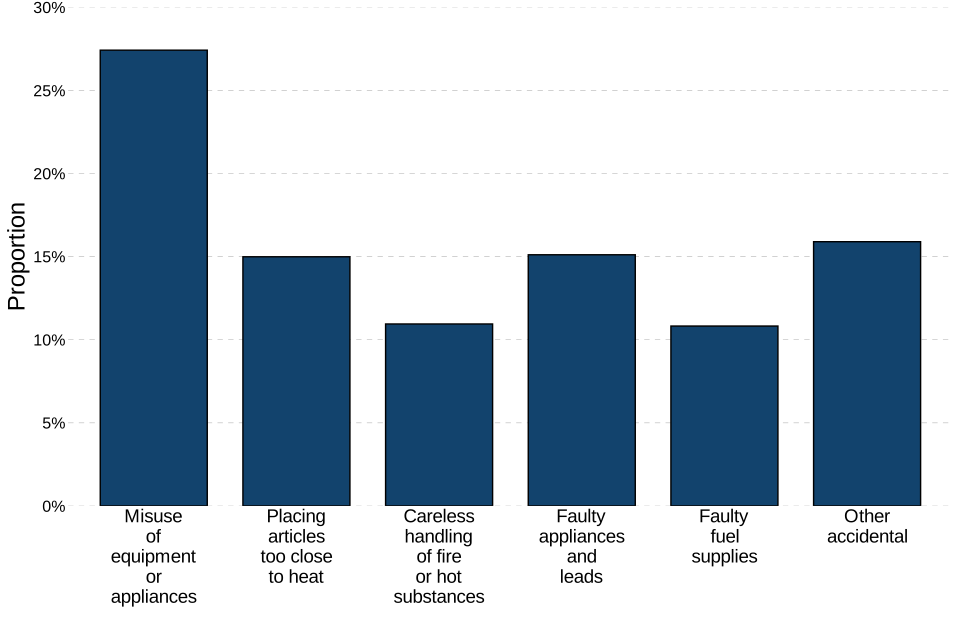
Source: FIRE0601
5. Smoke alarm function
Reasons alarms did not function as expected
Did not operate: alarm battery missing; alarm battery defective; system not set up correctly; system damaged by fire; fire not close enough to detector; fault in system; system turned off; fire in area not covered by system; detector removed; alerted by other means; other; not known.
Operated but did not raise the alarm: no person in earshot; occupants did not respond; no other person responded; other; not known.
5.1 Key results
In the year ending March 2026:
- fires where a smoke alarm was not present accounted for 23% (6,026) of all dwelling fires and 24% (44) of all dwelling fire-related fatalities Source: FIRE0702
- dwelling fires where a smoke alarm failed to operate accounted for 19%, virtually unchanged (0.3 percentage points) on the previous year Source: FIRE0702
- fires where a smoke alarm was not present accounted for 46% (6,330) of all other building fires and 76% (13) of all other building fire-related fatalities Source: FIRE0706
- other building fires where a smoke alarm failed to operate accounted for 10%, which was virtually unchanged from 10% in the previous year Source: FIRE0706
5.2 Smoke alarms in dwelling fires
Fires where a smoke alarm was present but either did not operate or did not raise the alarm accounted for 29% of all dwelling fires (19% and 10% respectively) in the year ending March 2026, similar to previous years.
In the year ending March 2026, ‘fire products did not reach detector(s)’[footnote 10] and ‘fire in area not covered by system’ accounted for 66% of all failure to operate reasons for smoke alarms in dwelling fires. Table 5.1 provides a summary of the reasons smoke alarms did not operate in dwelling fires in year ending March 2026.
As for all years since the year ending March 2011, the most common category of smoke alarm failure in dwelling fires involving any victims[footnote 11] was ‘other’ (including ‘alerted by other means’, ‘system damaged by fire’, ‘other’ and ‘don’t know’); Source: FIRE0704
Table 5.1: Reason smoke alarms did not operate in dwelling fires and dwelling fires resulting in casualties, England, year ending March 2026
| Reason alarm did not operate | Fires | Casualties |
|---|---|---|
| Missing battery | 1.8% | 7.2% |
| Defective battery | 3.1% | 8.7% |
| Other act preventing alarm from operating | 2.6% | 13% |
| Fire products did not reach detector(s) | 49% | 8.7% |
| Fire in area not covered by system | 17% | 10% |
| Faulty system / incorrectly installed | 2.4% | 13% |
| Other | 24% | 39% |
Notes:
- Includes all non-fatal casualties and fire-related fatalities
- Other includes ‘alerted by other means’, ‘system damaged by fire’, ‘other’ and ‘don’t know’
5.3 Smoke alarm function and outcomes
Figure 5.1 shows the proportion of dwelling fires and associated fire-related fatalities where the alarm was ‘present, operated and raised the alarm’, ‘present but did not raise the alarm’, ‘present but did not operate’ or ‘absent’. It shows that a smoke alarm was present and raised the alarm (functioned as intended) in 48% of dwelling fires, 38% of fire-related fatalities and 51% of non-fatal casualties in the year ending March 2026. (Source: FIRE0702)
Alarms were absent in a higher proportion of fire-related fatalities (24%) than for non-fatal casualties (20%) and in dwelling fires (23%) in the year ending March 2026. Although the difference is smaller than in previous years, this pattern is consistent with previous years.
Figure 5.1: Smoke alarm operation outcomes for dwelling fires, fire-related fatalities and non-fatal casualties, England; in the year ending March 2026
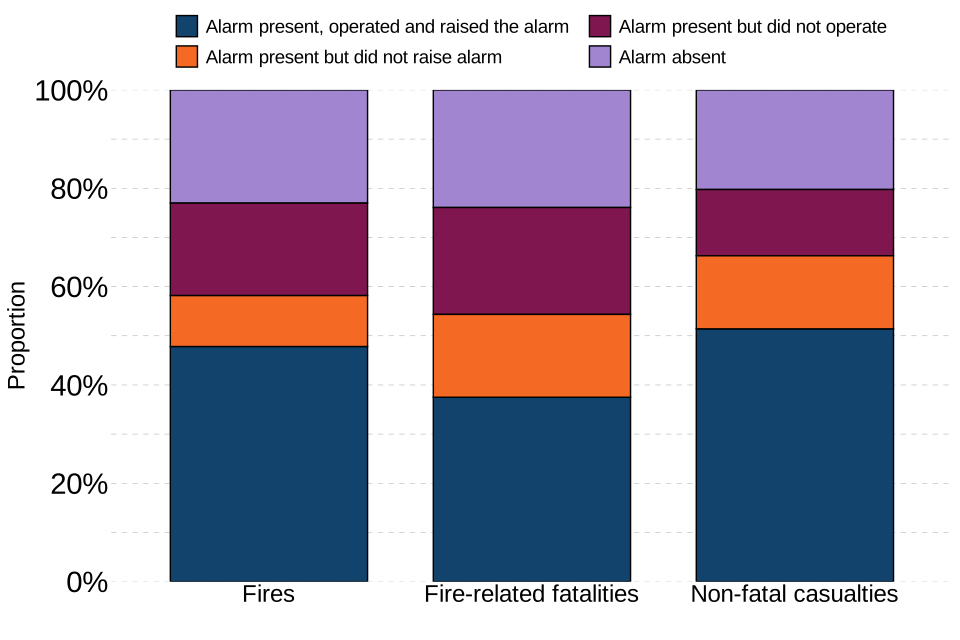
Source: MHCLG, FIRE0702
5.4 Smoke alarms in other building fires
In the year ending March 2026, in other buildings:
- fires where a smoke alarm was not present, accounted for 46% of other building fires, compared to 44% in the previous year; Source: FIRE0706
- fires where a smoke alarm was present but did not raise the alarm, accounted for 4.9%, compared to 5.4% in the previous year; Source: FIRE0706
- fires where a smoke alarm was present but did not operate, accounted for 10%, virtually unchanged compared to 10% in the previous year; Source: FIRE0706
6. Summary of total response time trends to fire incidents
Total response time is the minutes and seconds elapsed from the time of call to the arrival of the first vehicle to the incident. Time of call is based on the time that the call is received by Command and Control (the Fire Control room).
The following incidents are not included in response time totals:
- road vehicle fires, where the road vehicle was abandoned;
- derelict property fires;
- where an FRS learned of the fire when it was known to have been extinguished (known as ‘late calls’);
- where the total response time for an incident was over an hour or less than 1 minute (to avoid erroneous data or exceptional incidents from skewing the averages);
- where the sequence of events (time of call - mobilisation - vehicle mobile - arrival at scene) in an incident is not recorded in a logical sequence, either through recording error (for example a vehicle appears to have arrived before it left) or absence of data (null values).
Due to these exclusions, the number of incidents that the response times analysis is based on is lower than the reported number of incidents in FIRE0102. The number of incidents that the response time calculation is based on is provided in FIRE1001, analysis of the exclusions is provided in section 11. Further information.
6.1 Key results
In the year ending March 2026:
- the average total response time to primary fires in England was 9 minutes and 25 seconds; Source: FIRE1001
- there was an increase of 19 seconds in the average first appliance response time to primary fires since the previous year; Source: FIRE1001
- the average total response time to secondary fires in England saw an increase of 36 seconds, compared with the previous year, to 9 minutes and 58 seconds; Source: FIRE1001
6.2 Response times to fire incidents
Figure 6.1: Average total response times (minutes) by type of fire, England; year ending March 2016 to year ending March 2026
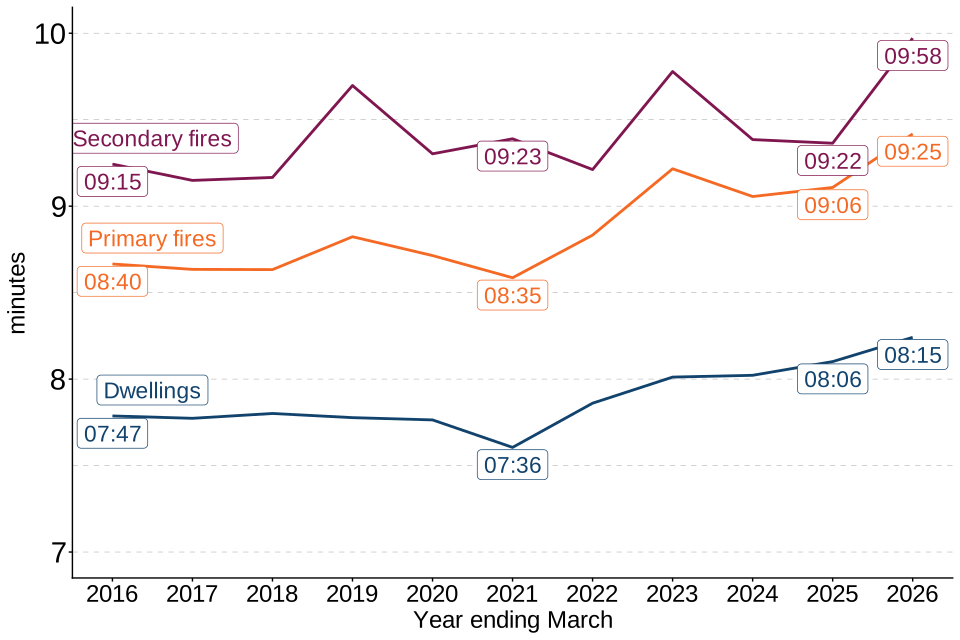
Source: MHCLG, FIRE1001
Notes:
- y axis is from 7 to 10 minutes
Table 6.1: Average response times, comparing the year ending March 2026 with 1, 5 and 10 years previously
| Type of fire | Year ending March 2026 | Year ending March 2025 | 1-year change | Year ending March 2021 | 5-year change | Year ending March 2016 | 10-year change |
|---|---|---|---|---|---|---|---|
| Primary fires | 9m 25s | 9m 06s | +19s | 8m 35s | +50s | 8m 40s | +45s |
| Dwellings | 8m 15s | 8m 06s | +9s | 7m 36s | +39s | 7m 47s | +28s |
| Other buildings | 9m 12s | 9m 03s | +9s | 8m 36s | +36s | 8m 26s | +46s |
| Road vehicles | 10m 19s | 10m 12s | +7s | 9m 27s | +52s | 9m 48s | +31s |
| Other outdoors | 12m 10s | 11m 10s | +1m 0s | 11m 08s | +1m 2s | 10m 58s | +1m 12s |
| Secondary fires | 9m 58s | 9m 22s | +36s | 9m 23s | +35s | 9m 15s | +43s |
Source: FIRE1001
7. Response time components
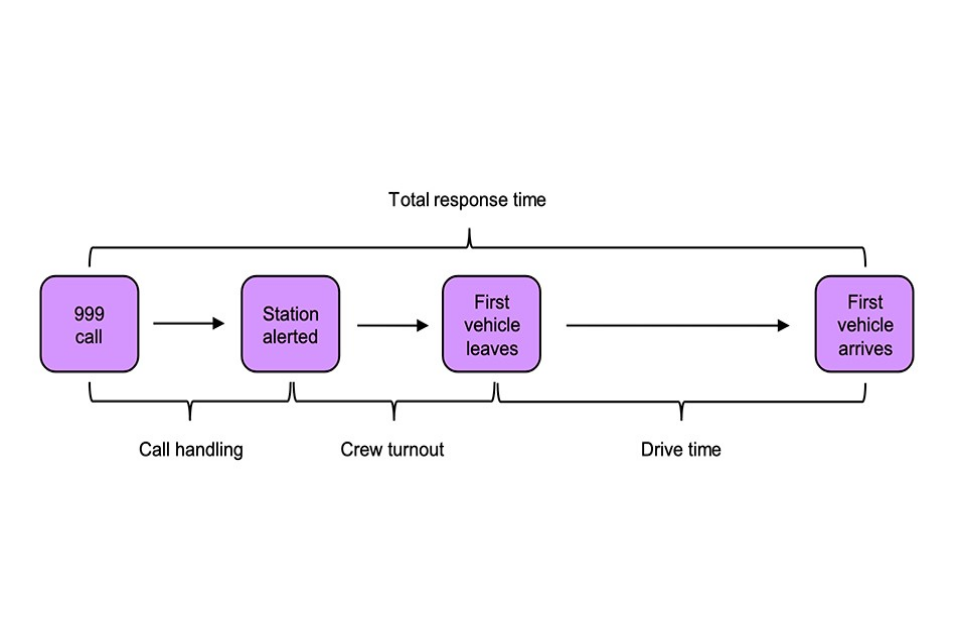
The total response time (from time of call to time of first arrival) can be divided into call handling time, crew turnout time and drive time. These data are drawn from the online data collection system and so are only available from year ending March 2011 onwards (see FIRE1001).
The components of response times are defined as:
- Call handling time is the duration between the time of call (when Command and Control in the Fire Control room received the call) and the point at which the station is alerted;
- Crew turnout time is the duration between the time at which the station is alerted and the time the first vehicle departs (the time it takes for the firefighters to prepare to leave);
- Drive time is the duration between the time the first vehicle leaves to the time at which the first vehicle arrives at the scene of the incident (not necessarily the same vehicle).
7.1 Key results
In year ending March 2026:
- the average call handling time for primary fires showed an increase of 2 seconds compared with the previous year to 1 minute and 26 seconds (Source: FIRE1001)
- the average crew turnout time for primary fires showed an increase of 2 seconds compared with the previous year to 1 minute and 33 seconds
- the average drive time for primary fires showed an increase of 13 seconds compared with the previous year to 6 minutes and 25 seconds
- of the average total response time, call handling accounted for 15%, crew turnout accounted for 17% and drive time accounted for 68%
Figure 7.1: Average response time (minutes) to primary fires by response time component (stacked), England; year ending March 2016 to year ending March 2026
Source: MHCLG, FIRE1001
7.2 Call Components by type of fire
It should be noted that it is difficult to isolate the impact of any individual factor on response times. Many factors at a local and national level contribute to the different call components, with some of these factors discussed below. Response times reflect the geography of the FRS, including the urban-rural nature of the FRS, new developments, and the strategic position of fire stations and appliances.
Response times to dwelling fires are the fastest for all types of fires, for all 3 of the response time components, with this trend occurring each year since data became available in year ending March 2011. This likely reflects the relative ease with which a street address can be communicated on the telephone and the urgency with which an FRS responds to fires with the greatest potential risk to life.
In contrast, primary outdoor fires typically have the slowest times for each of the 3 call components, which could reflect the difficulty of describing an outdoor location without a street address (call handling) and the difficulty of finding it once mobile (drive time). Similarly, secondary fires have response times that are slower than primary fires, likely as most of these locations are outdoor, more rural and have a lower risk to life or property.
Table 7.1: Response times to primary fires by component, England; year ending March 2026 compared with 1, 5 and 10 years previously
| Component of Response Time | Year ending March 2026 | Year ending March 2025 | 1-year change | Year ending March 2021 | 5-year change | Year ending March 2016 | 10-year change |
|---|---|---|---|---|---|---|---|
| Total Response Time | 9m 25s | 9m 06s | +19s | 8m 35s | +50s | 8m 40s | +45s |
| Call Handing Time | 1m 26s | 1m 24s | +2s | 1m 20s | +6s | 1m 27s | -1s |
| Crew Turnout Time | 1m 33s | 1m 31s | +2s | 1m 37s | -4s | 1m 41s | -8s |
| Drive Time | 6m 25s | 6m 12s | +13s | 5m 38s | +47s | 5m 32s | +53s |
Source: FIRE1001
Table 7.2: Percentage of total response time to primary fires by component, England; year ending March 2026 compared with 1, 5 and 10 years previously
| Component of Response Time | Year ending March 2026 | Year ending March 2025 | 1-year change | Year ending March 2021 | 5-year change | Year ending March 2016 | 10-year change |
|---|---|---|---|---|---|---|---|
| Call Handing Time | 15% | 15% | -0.1pp | 16% | -0.3pp | 17% | -1.4pp |
| Crew Turnout Time | 17% | 17% | -0.1pp | 19% | -2.3pp | 19% | -3.0pp |
| Drive Time | 68% | 68% | 0.2pp | 66% | 2.6pp | 64% | 4.4pp |
Source: MHCLG, FIRE1001
Notes:
- pp stands for percentage points
8. Total response times by type of Fire and Rescue Authority (FRA)
8.1 Response times by FRA
Of the 44 fire and rescue authorities (FRAs), 7 showed a decrease in average total response time to primary fires between year ending March 2025 and year ending March 2026. Source: FIRE1001.
For primary outdoor fires, 8 FRAs showed a decrease in average total response time.
Figure 8.1: Average response times to primary fires by FRA, England; and average change in response time for year ending March 2026 compared to 2025
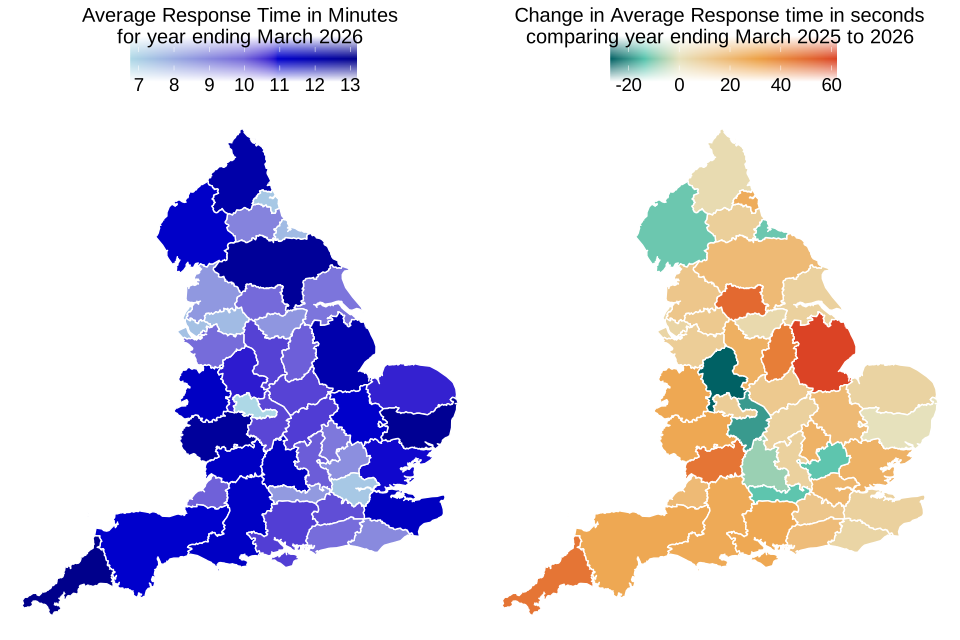
Notes:
- Colour scale does not start at 0, for the average response time in minutes for year ending March 2025
- Between September 2024 and June 2025 Suffolk FRS could not submit all incidents due to technical reasons. Figures for Suffolk over this time period are therefore an underestimate.
- Suffolk’s data have been excluded from the map on the right and the change in average response time has been manually set to 0 seconds
- The colours included in this figure may not be accessible to everyone; the numbers used to generate this figure can be found in table FIRE1001
Source: MHCLG, FIRE1001
8.2 Response times by type of FRA
FRAs can be grouped into 4 rural-urban classifications (Majority rural, Intermediate rural, Intermediate urban and Urban)[footnote 12].
Average response times to primary fires are faster in more urban areas and faster still in the subset of urban FRAs which are metropolitan[footnote 13]. The difference in average response times between urban and majority rural FRAs was 3 minutes and 48 seconds in year ending March 2026, an increase from 2 minutes and 58 seconds ten years ago. The largest difference in average response times is between urban and all other FRAs, with average response times in urban FRAs 2 minutes and 27 seconds quicker than intermediate urban FRAs in the latest year.
As can also be seen in table 8.1, the average response time to primary fires in more rural FRAs is higher (see figure 8.1). In the year ending March 2026, average response times to primary fires increased fairly similarly across all locations compared to the previous year. Over the past decade, average response times to primary fires have increased the most in more rural FRAs and the least in urban FRAs. See figure 8.2 for further detail.
For the specific response time components, the trend for call handling varies between all FRAs; however, the crew turnout time and drive time both increase for more rural FRAs compared to urban FRAs, likely reflecting the crew type (generally more on-call firefighters in rural FRAs) and the distance to incidents, see table 8.2 for further detail.
Crew turnout times for majority and intermediate rural FRAs are typically 1 minute to 1.5 minutes longer than urban FRAs in each year, likely due to the higher proportion of on-call firefighters[footnote 14], who first need to get to a station once alerted.
Figure 8.2: Average total response times (minutes) to primary fires by type of FRA, England; year ending March 2016 to year ending March 2026
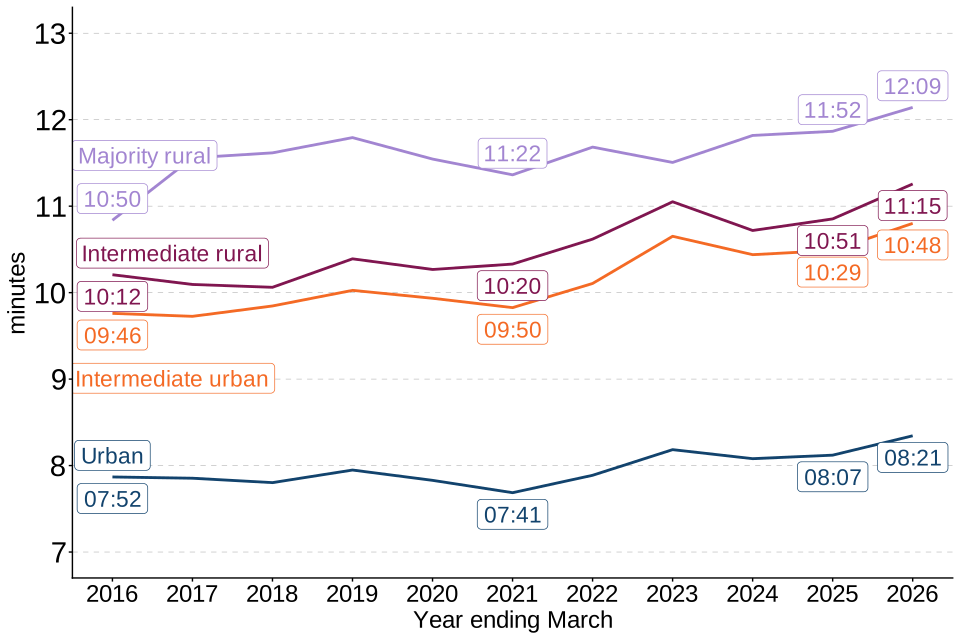
Source: MHCLG, FIRE1001
Notes:
- y axis is from 7 to 13 minutes
Table 8.1: Response times to primary fires by type of FRA, England; year ending March 2026 compared with 1, 5 and 10 years previously
| Location Category | Year ending March 2026 | Year ending March 2025 | 1-year change | Year ending March 2021 | 5-year change | Year ending March 2016 | 10-year change |
|---|---|---|---|---|---|---|---|
| England | 9m 25s | 9m 06s | +19s | 8m 35s | +50s | 8m 40s | +45s |
| Urban | 8m 21s | 8m 07s | +14s | 7m 41s | +40s | 7m 52s | +29s |
| Intermediate urban | 10m 48s | 10m 29s | +19s | 9m 50s | +58s | 9m 46s | +1m 2s |
| Intermediate rural | 11m 15s | 10m 51s | +24s | 10m 20s | +55s | 10m 12s | +1m 3s |
| Majority rural | 12m 09s | 11m 52s | +17s | 11m 22s | +47s | 10m 50s | +1m 19s |
Source: FIRE1001
Table 8.2: Component of response times to primary fires by type of FRA, England; year ending March 2026
| Location Category | Call Handling Time | Crew Turnout Time | Drive Time | Total response time |
|---|---|---|---|---|
| England | 1m 26s | 1m 33s | 6m 25s | 9m 25s |
| Urban | 1m 28s | 1m 09s | 5m 44s | 8m 21s |
| Intermediate urban | 1m 28s | 1m 58s | 7m 21s | 10m 48s |
| Intermediate rural | 1m 13s | 2m 28s | 7m 34s | 11m 15s |
| Majority rural | 1m 33s | 2m 28s | 8m 07s | 12m 09s |
Source: FIRE1001
9. Distribution of total response times
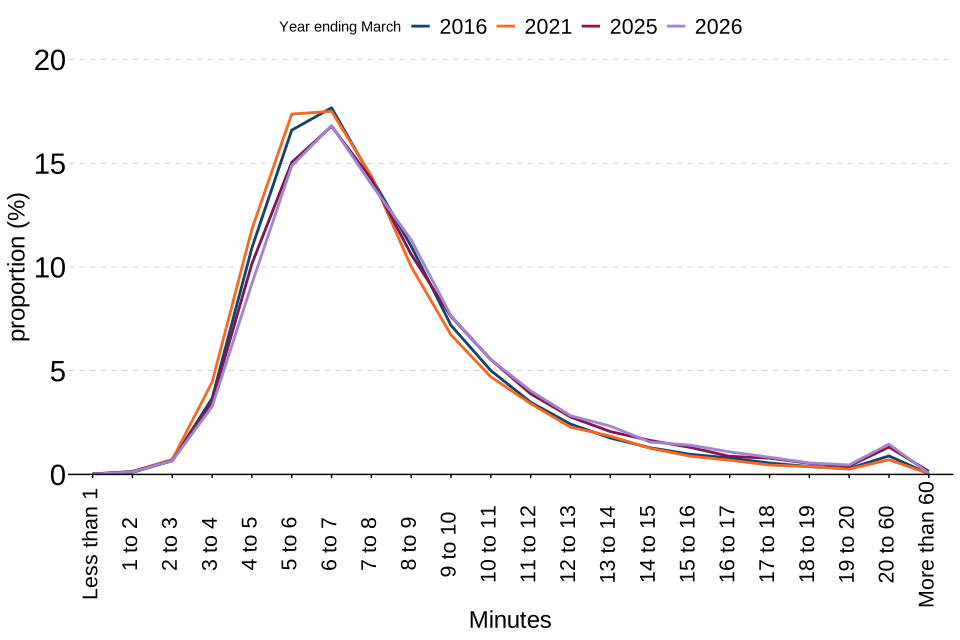
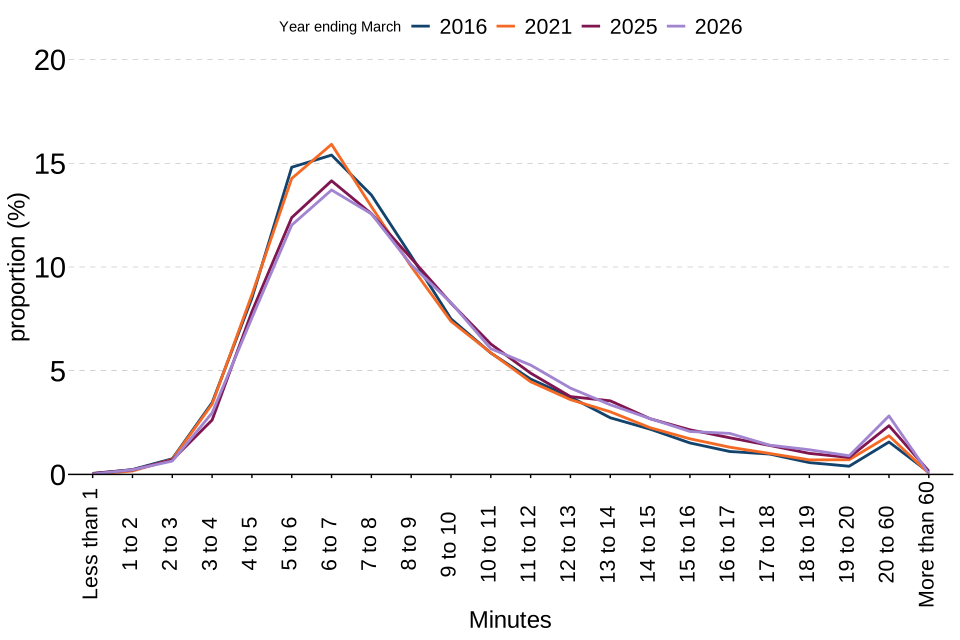
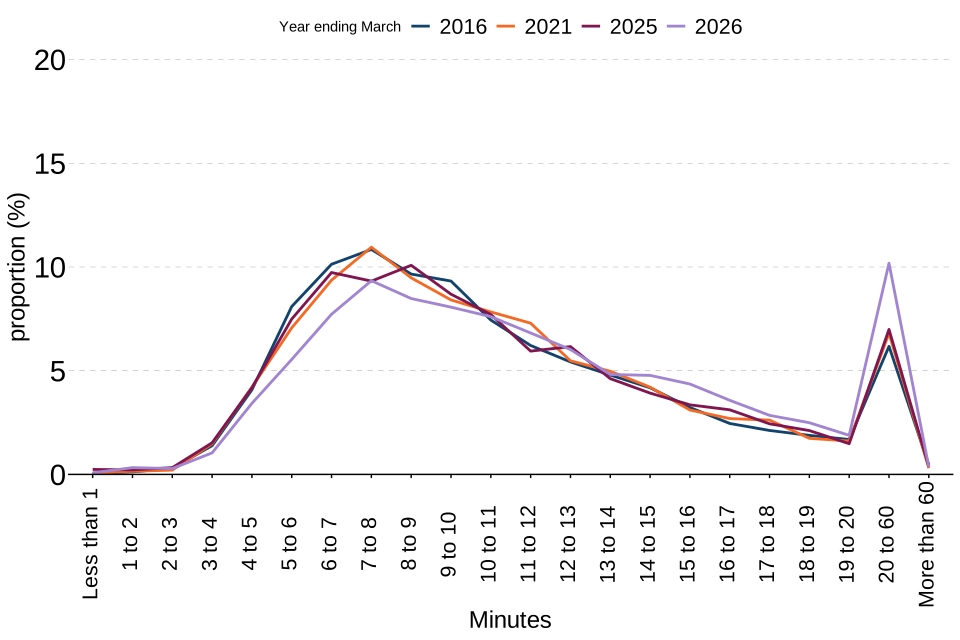
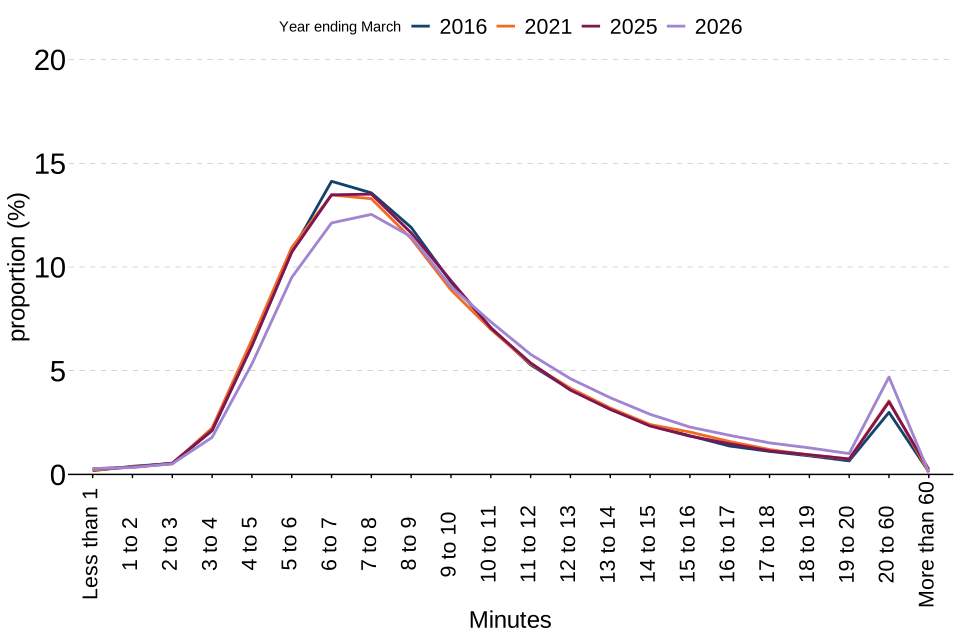
Chapters 6 to 8 present (mean) average response times; however, many FRSs measure their performance based on the proportion of incidents attended within various target times. Fire statistics table FIRE1004 provides incident counts by 1-minute bands (until 20 minutes where it is grouped by 20-60 minutes and more than 60 minutes) for primary and secondary fires.
9.1 Key results
In year ending March 2026:
- the most common response time band for all fire types, except for primary other outdoors fires was 6 to 7 minutes
- 67% of all primary fires were responded to within 10 minutes, decreasing by 2.3 percentage points compared with the previous year
- 78% of dwelling fires were responded to within 10 minutes, decreasing by 0.9 percentage points compared with the previous year
- 68% of other building fires were responded to within 10 minutes, decreasing by 1.1 percentage points compared with the previous year
- 44% of primary outdoor fires were responded to within 10 minutes, decreasing by 7.5 percentage points compared with the previous year
- 63% of secondary fires were responded to within 10 minutes, decreasing by 5.3 percentage points compared with the previous year
A greater proportion of dwelling fires were responded to within 10 minutes (78%), relative to the other fire types. This is likely due to the comparative ease of describing street addresses via telephone and the urgency with which FRSs respond to fires with increased risk to life or property. A smaller proportion of outdoor primary fires and secondary fires were responded to within 10 minutes, 44% and 63% respectively, likely due to these incidents typically being less urgent or occurring in more rural locations. In the year ending March 2026, a larger proportion of outdoor primary fires (11%) and secondary fires (4.8%) were responded to in 20 minutes or more than one, five and ten years ago. Outdoor fires are on average further away from fire stations and take longer to reach.
Figure 9.1: Proportion of primary fires in dwellings attended by FRSs in 1-minute total response time bands, England; year ending March 2026 compared with 1, 5 and 10 years previously
Source: MHCLG, FIRE1004
Figure 9.2: Proportion of primary fires in other buildings attended by FRSs in 1-minute total response time bands, England; year ending March 2026 compared with 1, 5 and 10 years previously
Source: MHCLG, FIRE1004
Figure 9.3: Proportion of primary fires in other outdoors attended by FRSs in 1-minute total response time bands, England; year ending March 2026 compared with 1, 5 and 10 years previously
Source: MHCLG, FIRE1004
Figure 9.4: Proportion of secondary fires attended by FRSs in 1-minute total response time bands, England; year ending March 2026 compared with 1, 5 and 10 years previously
Source: MHCLG, FIRE1004
Table 9.1: Proportion of fire incidents responded to within 10 minutes by type of fire incident, England; year ending March 2026 compared with 1, 5 and 10 years previously
| Type of fire | Year ending March 2026 | Year ending March 2025 | 1-year change | Year ending March 2021 | 5-year change | Year ending March 2016 | 10-year change |
|---|---|---|---|---|---|---|---|
| Primary fires | 67% | 69% | -2.3pp | 74% | -6.9pp | 74% | -6.7pp |
| Dwellings | 78% | 79% | -0.9pp | 83% | -5.3pp | 82% | -4.3pp |
| Other buildings | 68% | 69% | -1.1pp | 73% | -5.4pp | 75% | -6.6pp |
| Road vehicles | 58% | 59% | -0.6pp | 65% | -7.2pp | 63% | -5.0pp |
| Other outdoors | 44% | 52% | -7.5pp | 51% | -7.1pp | 54% | -9.7pp |
| Secondary fires | 63% | 68% | -5.3pp | 68% | -4.9pp | 69% | -6.2pp |
Source: FIRE1004
Notes:
- pp stands for percentage points
10. Response times and outcomes
There is no straightforward relationship between response times and the outcome of a fire. Many factors outside the control of FRSs will affect the outcome of fires, including the type of fire and the time elapsed before the fire was discovered. This section looks at response times in relation to victims (fatalities and non-fatal casualties) and rescues.
10.1 Key results
In year ending March 2026:
- the average total response time to dwelling fires involving victims and/or rescues in England was 7 minutes and 57 seconds, a decrease of 1 second compared with year ending March 2025 (Source: FIRE1002)
- the average total response time to dwelling fires without victims and/or rescues in England was 8 minutes and 16 seconds, an increase of 9 seconds compared with year ending March 2025 (Source: FIRE1002)
Dwelling fires with victims and/or rescues have had consistently faster average response times than dwelling fires with no victims and/or rescues. These comprise a relatively small number of incidents (9.4% of all dwelling fires since year ending March 2010 involved victims and/or rescues), so are potentially more susceptible to fluctuations in average response times. The pattern is consistent across all years in the series (between 9% and 10% in each year). This suggests that while dwelling fires are responded to the most quickly of all primary fire types, see figure 6.1), response times are faster for incidents that appear to involve a risk to life, if it has been possible to collect this information from the caller.
Dwelling fires with victims consistently have faster response time components than those without victims. In the year ending March 2026, for dwelling fires with victims:
- call handling time was the same as for those without victims
- the crew turnout time was 7 seconds quicker than for those without victims
- the drive time was 12 seconds quicker than for those without victims
11. Further information
This release contains statistics about incidents and response times to fire incidents attended by fire and rescue services (FRSs) in England. The statistics are sourced from the MHCLG’s online Fire and Rescue Data Platform (FaRDaP). This system allows FRSs to complete an incident form for every incident attended, be it a fire, a false alarm or a non-fire incident (also known as a Special Service incident). FaRDaP was formerly the Incident Recording System (IRS) until November 2025. The online IRS was introduced in April 2009. Previously, paper forms were submitted by FRSs and an element of sampling was involved in the data compilation process.
Fire and Rescue Incident Statistics and other MHCLG statistical releases are available via the Statistics at MHCLG pages on the GOV.UK website.
Data tables linked to this release and all other fire statistics releases can be found on the MHCLG’s Fire statistics data tables page.
Guidance for using these statistics and other fire statistics outputs, including a Quality Report, is available on the fire statistics guidance page.
The information published in this release is kept under review, taking into account the needs of users and burdens on suppliers and producers, in line with the Code of Practice for Statistics.
All fire-related Ministerial responsibilities moved from the Home Office to the Ministry of Housing, Communities and Local Government (MHCLG) on 1 April 2025. This change followed a key recommendation from the Phase 2 report of the Grenfell Tower Inquiry, to bring all fire safety functions under one department. Therefore, as part of this move, all statistical publications and analysis on fire functions were also subject to the Machinery of Government (MoG) change.
If you have any comments, suggestions, or enquiries, please contact the team via email using firestatistics@communities.gov.uk or via the user feedback form on the fire statistics collection page.
Other related publications
MHCLG publish 4 other statistical releases covering fire and rescue services.
These include:
-
Fire and rescue incident statistics, England: provides statistics on trends in fires, casualties, false alarms, non-fire incidents and response times to fire incidents attended by fire and rescue services in England, updated quarterly
-
Detailed analysis of non-fire incidents attended by fire and rescue services, England: focuses on non-fire incidents attended by fire and rescue services across England, including analysis on overall trends, fatalities and non-fatal casualties in non-fire incidents, and further detailed analysis of different categories of non-fire incidents
-
Fire and rescue workforce and pensions statistics: focuses on total workforce numbers, workforce diversity and information regarding leavers and joiners; covers both pension fund income and expenditure and firefighters’ pension schemes membership; and includes information on incidents involving attacks on firefighters
-
Fire prevention and protection statistics, England: focuses on trends in smoke alarm ownership, fire prevention and protection activities by fire and rescue services
The Ministry of Housing, Communities and Local Government also publish other related statistical releases on fire.
These include:
- the English Housing Survey: fire and fire safety report, which focuses on the extent to which the existence of fire and fire safety features vary by household and dwelling type and this report focuses on whether people felt safe from fire in their homes, by household and dwelling type
Fire statistics are published by the other UK nations:
Scottish fire statistics and Welsh fire statistics are published based on FaRDaP. Fire statistics for Northern Ireland are published by the Northern Ireland Fire and Rescue Service using data from a system similar to the Incident Recording System, which means that they are not directly comparable to English, Welsh and Scottish data.
Accredited official statistics status
Following the National Statistics designation review by the Office for Statistics Regulation the term “Accredited Official Statistics” was introduced to describe National Statistics in September 2023. This release was formerly badged as “National Statistics” and should now be considered “Accredited Official Statistics”. National Statistics is the legal term set out in the Statistics and Registration Service Act 2007 for “Accredited Official Statistics” that have been judged by the Office for Statistics Regulation (OSR)[footnote 15], to comply with the Code of Practice for Statistics (“the Code”). This means these statistics meet the standards of trustworthiness, quality and value as set out in “the Code”. Further information about accredited official statistics can be found on the OSR’s website.
Incidents included in response times analysis
Where the response times sections of this report (6 to 10) reference incident numbers, it refers to fire incidents included in FIRE1001, not total incidents from FIRE0102. FIRE1001 has incidents excluded that took more than an hour or less than 1 minute or had the date-time stamps incorrectly recorded. For more information on the method used to calculate response times and the underlying assumptions, please see the guidance available here: fire statistics definitions. FIRE1001 does not include chimney fires, so for the remaining fires included in FIRE1001 accounted for 92% of all fire incidents in year ending March 2026. For the specific fire types included in FIRE1001, the proportion of incidents included in the response time calculation was as follows:
- 95% of dwelling fires
- 95% of other buildings fires
- 78% of road vehicle fires
- 97% of outdoor primary fires
- 92% of secondary fires
Fire and Rescue Data Platform (FaRDaP) data collection system
This release contains statistics on incidents attended by fire and rescue services (FRSs) in England. Incident data was collected through the Incident Recording System (IRS) until November 2025. Since then, the statistics have been sourced from the Fire and Rescue Data Platform (FaRDaP).
FaRDaP allows FRSs to complete an incident record for every incident attended, including fires, false alarms and non-fire incidents (also known as special service incidents).
From autumn/winter 2026, FRSs will begin transitioning to FaRDaP v2. The new version includes additional questions, amendments to existing questions, and new response options for some existing questions. For example, a new response option of “air fryer” has been added to the question on sources of ignition.
We intend to publish statistics derived from some of these new data items from autumn/winter 2027 onwards. The scope and timing of these publications will depend on the rate at which FRSs transition to FaRDaP v2 and the quality and completeness of the data collected through the new and amended questions.
Revisions
FaRDaP is a continually updated database, with FRSs adding incidents daily. The figures in this release refer to records of incidents that occurred up to and including 31 March 2026. This includes incident records that were submitted to FaRDaP by 12 May 2026, when a snapshot of the database was taken for the purpose of analysis. As a snapshot of the database was taken on 12 May 2026, the statistics published may not match those held locally by FRSs and revisions may occur in the future.
Between September 2024 and June 2025 Suffolk FRS could not submit all incidents due to technical reasons. Figures for Suffolk over this time period are therefore an underestimate.
The analysis on the likelihood of dying in a dwelling fire depending on working smoke alarm ownership is now based on a five-year average rather than a single year. This change has been made to improve stability and reduce the impact of year-to-year fluctuations due to the relatively low number of fatal dwelling fires. The five-year average provides a more reliable indication of the relative risk associated with the presence or absence of a working smoke alarm.
-
Fatality rates per million people by age and gender are based on a rolling five-year average due to the number of fatalities by age and gender being relatively small and prone to fluctuation. ↩
-
Casualties requiring hospital treatment covers all injury categories listed in FIRE0506 with the exception of ‘first aid given’ or ‘precautionary checks’. ↩
-
For a list of the damaged area size bands, see the fire statistics definitions document. ↩
-
Excluding these area categories removed 4 dwelling fires (approximately 0.01% of all dwelling fires) and 146 other buildings fires (approximately 1.1% of all other building fires) for the year ending March 2026. ↩
-
Larger fires are comprised of the following FaRDaP categories: ‘limited to floor of origin’, ‘limited to 2 floors’, ‘affecting more than 2 floors’, ‘limited to roofs and spaces’ or the ‘whole building’. ↩
-
Some incidents in FaRDaP have been recorded as “deliberate” in one question but “accidental” in another question. We believe this is because the information has circumvented quality assurance checks. This means that the figures for deliberate fires in our published tables do not match always match. The MHCLG will be working with FRSs to improve the quality of this data. ↩
-
For a more detailed definition on the different types of cause of fire, see the definitions document and IRS Guidance. ↩
-
This excludes 3,756 ‘Other and Unspecified’ accidental dwelling fires, 56 fire-related fatalities in accidental dwelling fires and 742 accidental dwelling fire casualties. ↩
-
Fire products did not reach detectors(s) can be where the smoke alarms present were poorly sited (for example not on the floor of origin) so the smoke did not reach the detector. ↩
-
This includes non-fatal casualties and fire-related fatalities. ↩
-
As defined by the Department for Environment, Food and Rural Affairs (DEFRA) and Office for National Statistics (ONS) 2021 Census Rural Urban Classification of Local Authorities and other geographies. There are 20 FRAs classified as Urban, 13 FRAs classified as Intermediate urban, 9 FRAs classified as Intermediate rural, and 3 FRAs classified as Majority rural. The Rural Urban Classification (RUC) for FRAs was updated in 2026 to use the 2021 Census RUC. This RUC is also applied to historical data. ↩
-
Metropolitan FRAs are a subset of those in the Urban category, while non-metropolitan comprises those in Majority rural, Intermediate rural, Intermediate urban and the remainder of Urban FRAs. There are 7 FRAs classified as metropolitan and 37 FRAs classified as non-metropolitan FRAs. ↩
-
Also known as ‘retained duty firefighters’. ↩
-
OSR are the regulatory arm of the UK Statistics Authority. ↩