DCMS Economic Estimates 2020: Trade – Technical and quality assurance report
Updated 24 May 2024

© Crown copyright 2024
This publication is licensed under the terms of the Open Government Licence v3.0 except where otherwise stated. To view this licence, visit nationalarchives.gov.uk/doc/open-government-licence/version/3 or write to the Information Policy Team, The National Archives, Kew, London TW9 4DU, or email: psi@nationalarchives.gov.uk.
Where we have identified any third party copyright information you will need to obtain permission from the copyright holders concerned.
This publication is available at https://www.gov.uk/government/statistics/dcms-sectors-economic-estimates-2020-trade/dcms-economic-estimates-2020-trade-technical-and-quality-assurance-report
This document covers the following topics:
- An overview of the content covered in the statistical release ‘DCMS Economic Estimates 2020: Trade’
- An overview of DCMS Sectors, how they are defined, and limitations of these definitions
- The methodology underlying the statistical release, including data sources
- The processes used to check that the estimates have been produced correctly
- Other sources of information for the DCMS sectors
- Further information, including contact details for DCMS statisticians.
1. Overview of release
The statistics release ‘DCMS Economic Estimates 2020: Trade’ report provides
- estimates of exports and imports of goods in DCMS Sectors (up to and including 2020) constructed from HMRC Overseas Trade Statistics, which use international classification codes; Commodity (or CN08) codes.
- estimates of exports and imports of services by businesses in DCMS Sectors (up to and including 2020) constructed from ONS official statistics using international classifications (Standard Industrial Classification (SIC) codes).
- exports and imports of tourism (up to and including 2020) constructed from the International Passenger Survey.
Values of imports and exports are given in current prices and have not been adjusted for inflation. Year on year increases between figures given in current prices are likely to be higher than the ‘real’ (inflation-adjusted) value. Changes over time are therefore reported here as changes in the proportion of total UK imports and exports.
These statistics are further broken down by selected countries, regions and continents (with the exception of Tourism). The latest year for which these estimates are available is 2020.
Data are available for each DCMS Sector (excluding Civil Society) and sub-sectors within the Creative Industries, Digital Sector, and Cultural Sector. There is significant overlap between DCMS Sectors so users should be aware that the estimate for “DCMS Sectors Total” is lower than the sum of the individual sectors.
The estimates in the publication are consistent with national (UK) estimates, published by the Office for National Statistics (ONS) and HMRC.
1.1 Code of Practice for Statistics
DCMS Sector Economic Estimates 2020: Trade is an official statistic and has been produced to the standards set out in the Code of Practice for Statistics. In June 2019, the DCMS Sector Economic Estimates were badged as National Statistics. This affirms that the statistics have met the requirements of the Code of Practice for Statistics. The DCMS Sector Economic Estimates for Trade presented in this report remain official statistics as advised by the Office for Statistics Regulation.
1.2 Users
The users of these statistics fall into five broad categories:
- Ministers and other political figures
- Policy and other professionals in DCMS and other Government departments
- Industries and their representative bodies
- Charitable organisations
- Academics
The primary use of these statistics is to monitor the performance of the industries in the DCMS sectors, helping to understand how current and future policy interventions can be most effective.
2. Sector definitions
In order to measure the size of the economy it is important to be able to define it. DCMS uses a range of definitions based on internal or UK agreed definitions.
Trade in goods estimates are defined by 8-digit commodity codes of the Combined Nomenclature (CN) based on the Harmonised System (HS) of tariff nomenclature used to identify categories of goods. A list of commodity codes used in DCMS Sectors and sub-sectors for the trade in goods estimates are available in the accompanying tables.
Trade in services estimates are based on the Standard Industrial Classification 2007 (SIC) codes of the business trading the service. A list of SIC codes appearing in each sector and subsector for the trade in services estimates can be found in the accompanying tables.
This means nationally consistent sources of data can be used and enables international comparisons.
2.1 Overview of DCMS Sectors
Main sector definitions
The sectors for which DCMS has responsibility are:
- Civil Society
- Creative Industries
- Cultural Sector
- Digital Sector
- Gambling (services only)
- Sport
- Telecoms (services only)
- Tourism [covered on a separate basis to the other sectors]
The estimates of trade in Civil Society are not covered in this release, as there are no formally recognised measures of imports or exports for goods and/or services from the data sources available for this Sector.
Estimates of trade in the Gambling and Telecoms sectors are only available for imports or exports of services as there are no goods traded by the sectors.
Tourism is defined by the characteristics of the consumer in terms of whether they are a tourist or resident, rather than by the goods and services produced themselves. Expenditure by overseas tourist visitors to the UK is used as a proxy for exports of goods and services for Tourism. Expenditure by UK residents on their visits abroad is used as a proxy for imports of goods and services for Tourism.
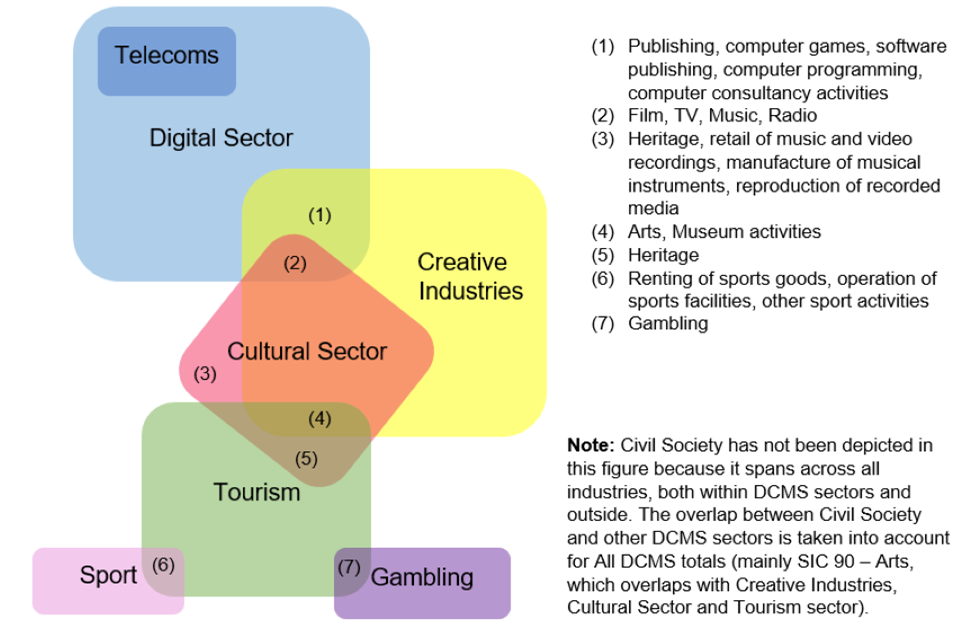
The development of individual sector definitions in isolation as new sectors have fallen within the department’s remit has meant that there is overlap between DCMS sectors. For example, the Cultural Sector is defined using SIC codes that are nearly all within the Creative Industries, whilst the Telecoms Sector is completely within the Digital Sector.
Figure 1 below visually shows the overlap between DCMS Sectors in terms of SIC codes. Users should note that this does not give an indication of the magnitude of the value of overlap. For this, users should consult the main report.
Figure 1: Overlap of SIC codes within DCMS Sectors
Other sector definitions
Additional analysis is presented for the Audio Visual sector.
The definition of the Audio Visual sector (see below) is intended to reflect the sectors covered by the EU Audio Visual Media Services Directive.
- 59.11 - Motion picture, video and television programme production activities
- 59.12 - Motion picture, video and television programme post-production activities
- 59.13 - Motion picture, video and television programme distribution activities
- 59.2 - Sound recording and music publishing activities
- 60.1 - Radio broadcasting
- 60.2 - Television programming and broadcasting activities
- 63.91 - News agency activities
- 63.99 - Other information service activities n.e.c.
- 77.22 - Renting of video tapes and disks
- 77.4 - Leasing of intellectual property and similar products, except copyrighted works
2.2 Details and limitations of sector definitions
This section looks at sector definitions in more detail, and provides an overview of limitations.
There are substantial limitations to the underlying classifications. As the balance and make-up of the economy changes, the SIC, finalised in 2007, is less able to provide the detail for important elements of the UK economy related to DCMS Sectors, and therefore best fit SIC codes have been used to produce these estimates. The following section describes limitations for specific DCMS sector definitions.
Creative Industries
The Creative Industries were defined in the Government’s 2001 Creative Industries Mapping Document as “those industries which have their origin in individual creativity, skill and talent and which have a potential for wealth and job creation through the generation and exploitation of intellectual property”.
To allow the Creative Industries to be measured, DCMS worked with others to develop a statistical definition of the Creative Industries which reflects this definition. DCMS uses a “Creative Intensity” to determine which industries (at 4 digit SIC) are Creative. The Creative Intensity is the proportion of occupations in an industry that are creative and, if the intensity is above a set threshold, that industry is typically defined as Creative. More information can be found in the 2016 methodology document.
Cultural Sector
There are significant limitations to the DCMS measurement of the Cultural Sector arising from the lack of detailed disaggregation possible using the standard industrial classifications. There are many cases where culture forms a small part of an industry classification and therefore cannot be separately identified and assigned as culture using standard data sources. DCMS consulted on the definition of Culture and published a response in April 2017.
It is recognised that, due to the limitations associated with SIC codes, the SIC code used in past publications as a proxy for the Heritage sector (91.03 - Operation of historical sites and building and similar visitor attractions) is likely to be an underestimate of this sector’s value. We have changed the name of the Heritage sector to ‘Operation for historical sites and similar visitor attractions’ to reflect this.
Digital Sector
The definition of the Digital sector used by DCMS is based on the OECD definition of the ‘information society’. This is a combination of the OECD definition for the “ICT sector” as well as including the definition of the “content and media sector”. An overview of the SIC codes included in each of these sectors is available in the OECD Guide to Measuring the Information Society 2011 (see Box 7.A1.2 on page 159 and Box 7.A1.3 on page 164).
The definition used for the Digital Sector does not allow consideration of the value added of “digital” to the wider economy e.g. in health care or construction. DCMS policy responsibility is for digital across the economy and therefore this is a significant weakness in the current approach.
Gambling
The definition of gambling used in the DCMS Sectors Economic Estimates is consistent with the internationally agreed definition, SIC 92, Gambling and betting activities. * Note on SIC 92.00 The Gambling sector (SIC 92.00) is relatively small and therefore changes in trading activity, reporting structure or industrial classification for any business can have a large impact on the overall sector figures. This was witnessed in 2015 and 2017 data particularly, whilst in 2018 and 2019 the exports for services failed disclosure checks for similar reasons. Care should therefore be taken when comparing these figures over time.
Sport
For the purpose of this publication the statistical definition of sport has been used. This incorporates only those 4-digit Standard Industrial Classification (SIC) codes which are predominantly sport (see the definitions table published alongside the methodology note).
DCMS also publishes estimates of sport based on the EU agreed Vilnius definition. The Vilnius definition is a more comprehensive measure of sport which considers the contribution of sport across a range of industries, for example sport advertising, and sport related construction. The methodology for the DCMS Sport Satellite Account is currently being reviewed and therefore has not been used in these estimates.
Telecoms
The definition of telecoms used in the DCMS Sectors Economic Estimates is consistent with the internationally agreed definition, SIC 61, Telecommunications. Please note that as well as appearing as a sector on its own, Telecoms is also entirely included within the Digital Sector as one of the sub-sectors.
Tourism
Tourism is defined by the characteristics of the consumer in terms of whether they are a tourist or resident rather than by the goods and services produced themselves. This, therefore, differs from “traditional” industries such as gambling or telecoms which are defined by the goods and services produced themselves, and means that a different approach to defining the industry must be used. The UK estimates are based on the methodology and definition set out in the UN International Recommendations for Tourism Statistics 2008 (IRTS 2008).
3. Methodology
This section provides details of how estimates of imports and exports of goods and services are produced.
3.1 Trade in goods
Estimates of imports and exports of goods presented in this statistical release were collected from HMRC’s Intrastat survey (for EU trade) and customs import and export entries (for non-EU trade), which record the movement (for trade purposes) of goods across international borders. They are constructed on a ‘Cross-border’ basis i.e. goods entering and leaving an economic territory are recorded as imports and exports and use international classification codes; Commodity (or CN08) codes[footnote 1]. For example, gold that is moving from one owner to another in the same vault would have to cross a border from one country to the next to classify as trade.
3.2 Trade in services
Estimates of imports and exports of services are based on data from the International Trade in Services (ITIS) survey [footnote 2]. The data are calculated on a ‘Balance of Payments’ basis i.e. services entering and leaving an economic territory are not recorded as imports or exports unless they change ownership (between UK residents and non-residents). By contrast, the goods data defines exports and imports on a cross-border basis (even if the ownership has not changed). Total UK estimates which are used to calculate the percentage of UK total for each sector are taken from the annual Pink Book, which balances inward and outward transactions to/from the UK. The data used are:
- Exports of services, (KTMQ – reference in the PinkBook tables)
- Imports of services, (KTMR – reference in the PinkBook tables)
3.3 Trade in Tourism
Exports and imports of goods and services for Tourism are taken from estimates of spend by overseas residents in the UK and spend by UK residents abroad, respectively. This data is sourced from the ONS International Passenger Survey (IPS) in which there is no attempt to classify goods and services or spend by industry. Unlike estimates for other DCMS sectors, we therefore provide estimates of trade in both goods and services combined for Tourism using the definitions below:
- Imports of tourism – spending by UK residents on trips abroad
- Exports of tourism – spending by overseas residents during visits to the UK
The data source for estimates of trade in Tourism, the International Passenger Survey, was suspended from 16 March 2020 to January 2021 as a result of the pandemic. There are therefore no breakdowns available by world regions or individual countries, and no additional reporting of trade in tourism estimates in the accompanying statistical report or data tables.
3.4 Trade by destination/source
The estimates in the release are further broken down by all listed individual partners, plus selected continents, regional areas and other amalgamations (e.g. European Union member states, North American Free Trade Association members, Gulf states).
This is an expansion on previous statistics based on user needs and improvements to processes for the statistics.
3.5 Summary of data sources
In summary, the data presented in this report on trade in services
- are based on official statistics data sources
- are based on internationally-harmonised codes
- are based on survey data and, as with all data from surveys, there will be an associated error margin surrounding these estimates [footnote 3]
This means we cannot say an estimate of, for example, 20% is very accurate for the whole population. Our best estimates, from the survey sample, suggest that the figure is 20%, but due to the degree of error, the true population figure could perhaps be 18% or 22%. This is not an issue with the quality of the data or analysis; rather it is an inherent principle when using survey data to inform estimates.
This means the estimates are:
- comparable at both a national and international level.
- comparable over time, allowing trends to be measured and monitored
However, this also means the estimates are subject to limitations of the underlying classifications of the make-up of the UK economy. For example, the standard industrial classification (SIC) codes were developed in 2007 and have not been revised since. Emerging sectors, such as Artificial Intelligence, are therefore hard to capture and may be excluded or mis-coded.
4. Quality assurance processes
This section summarises the quality assurance processes applied during the production of these statistics by our data providers, HMRC and the Office for National Statistics (ONS), as well as those applied by DCMS.
4.1 Quality Assurance Processes at HMRC - Trade in goods
Data for goods trade with EU countries was formerly collected through the Intrastat system - a monthly business survey used to determine the level of trade conducted within the EU. UK businesses that trade to or from other EU Member States, and which meet the reporting threshold (described in the next section) for intra-EU Arrivals and Dispatches were legally obliged to submit supplementary trade declarations using the Intrastat system.
Data for non-EU trade in goods are collected from customs declarations made to HMRC when goods leave or enter the UK (Customs Handling of Import and Export Freight (CHIEF) system). These data are combined to produce overall import and export estimates. HMRC applies disclosure control to the data before it is released to DCMS.
Note on change to data collection methods
Up to 31 December 2020, UK to EU export statistics were collected via the Intrastat statistical survey. For goods moving from 1 January 2021, GB to EU export statistics are compiled direct from customs export declarations made according to the requirements of the Taxation (Cross Border Trade) Act [footnote 4]. As a result of the changes, there is a break in the timeseries for published UK to EU export statistics from January 2021. These will not be directly comparable to UK to EU export statistics published for previous months and years.
UK imports from EU statistics are not impacted by any change in 2021. The Intrastat survey continues to operate for all UK (GB and NI) imports (arrivals) from the EU.
Although this does not affect the comparability of data before 1 January 2021; it is still important to know that the change has been made to future statistics.
Sampling frame and data collection
Businesses whose annual value of arrivals and/or dispatches exceeds a given exemption threshold are required to provide an Intrastat declaration each month, showing full details of their arrivals (imports) and dispatches (exports) during that month. The thresholds are reviewed annually to minimise the burden on business of the Intrastat system whilst maintaining the coverage by value of UK trade required by European legislation. For example, for the calendar years 2010 - 2013 these thresholds were set at £600,000 for arrivals and £250,000 for dispatches; it changed to £1.5m for arrivals after 2013. These detailed Intrastat declarations are required to cover at least 93 per cent of the value of trade for arrivals, and at least 97 per cent of the value of trade for dispatches.
Businesses are expected to submit their data by the 21st day of the following month, so for instance; January data must be submitted by the 21st of February.
The fields that are collected are as follows:
- Commodity Code
- Invoice Value
- Net mass/Supplementary Unit (where appropriate as determined by Commodity Code)
- Country of Destination or Dispatch (COD)
- Delivery Terms (if the business reaches the Delivery terms threshold)
- Nature of Transaction
There are two main ways of submitting Intrastat data electronically, either via the Internet or using Electronic Data Interchange (EDI):
- The secure system for submitting via the Internet is accessed from the HMRC website and businesses can choose to either key directly onto an online form or submit offline using a Comma Separated Variable (CSV) file.
- The EDI facility allows HMRC to receive data in the Electronic Data Interchange for Commerce and Transport (EDIFACT) Standard
Validation and quality assurance
HMRC carries out extensive validation procedures as part of its data processing. A validity error is where a field has been submitted in an incorrect format or is missing where required. Validity checks are done electronically by HMRC computer systems. Suspect fields are verified by reference to the original source document or by contacting the business or agent. Special attention is paid to high value traders to ensure that all significant value transactions are included when the trade statistics are first produced.
Auto corrections are built into HMRC computer systems to cope with certain common types of error. Examples include obsolete commodity codes, partially invalid commodity codes (e.g. only the first six of the eight digits are valid), invalid/obsolete country/port codes etc.
Other checks on the trade data focus on value and quantity data. For example, HMRC carry out credibility checks on the relationships between the fields:
- ‘Value’ and ‘Quantity 1’ (i.e. net mass)
- ‘Value’ and ‘Quantity 2’ (i.e. supplementary units such as number of items)
- ‘Quantity 1’ and ‘Quantity 2’
Credibility checking is a tool for ensuring that the detailed data obtained is realistic and viable. These checks are not meant to indicate that a particular item is incorrect but that it is different from the norm. If this highlights a potential error, then the data will be investigated, often by contacting the business, and corrected where necessary (subject to risk profiling and resources available).
Administrative data from CHIEF is supplied to HMRC in the form of daily file transmissions of cleared/departed customs declarations to their data processing system, called TS93. This system allows for data validation and quality checking so that they can make data-led amendments to both CHIEF and Intrastat data. CHIEF and TS93 systems are both used to carry out credibility checking of trade data within HMRC.
4.2 Quality Assurance Processes at ONS - Trade in services
Quality assurance at ONS takes place at a number of stages, outlined below. To note, information presented here on the data sources are taken from the International trade in services Quality Methodology Information (QMI) and should be credited to the ONS.
The International Trade In Services (ITIS) data shows the import and export activity of UK companies overseas and is the main source of information for UK trade. The data is based solely on survey data.
Sampling frame and data collection
ITIS data are based on a quarterly sample of approximately 2,200 businesses and an annual sample of approximately 18,200 businesses. Response rate targets are 85% for both annual and quarterly ITIS data.
The survey data from both the quarterly and annual results are combined to produce the annual ITIS estimates and are used as a main data source to compile total trade in services estimates. It is worth noting that the surveys do not provide full coverage of the UK economy, and excluded sectors include: travel and transport; banking and other financial institutions; higher education; and most activities in the legal professions.
The ITIS survey is supplemented by the Annual Business Survey (ABS). Historically, ITIS’ product-level estimates have been derived from the ABS. Since 2018, product- and industry-level data have been improved by directly surveying companies operating in some industries from ITIS itself. However, the ABS is still used as part of the process, for example to help inform the sample for these industries.
ITIS data are collected by both industry and service on a geographical basis, by collecting data for the countries to which services are exported to and where they are imported from. The ITIS estimates are published annually.
Data relating to the import or export of goods are excluded from this survey. However, merchanting (earnings from arranging the sale of goods between two countries outside the UK and where the goods never physically enter the UK) is included along with earnings from commodity trading. As with merchanting, the services element is calculated as the businesses’ profit minus the loss.
Validation and quality assurance
There is no simple way of measuring the accuracy of ITIS statistics, that is, the extent to which they measure the underlying “true” value for a particular period. Non-sampling errors are not easy to quantify and include errors of coverage, measurement, processing and non-response. Various procedures and checks are made to ensure these errors are minimised. As ITIS is based on survey responses, ONS systems validate these entries and prompt confirmation of suspect data is sought.
Every effort is made to ensure that the series are comparable over time. International standards (BPM6[footnote 5] and MSITS 2010[footnote 6]) are used in the production of ITIS data; therefore, figures published by the UK should be comparable with other countries. UK representation in working groups will ensure that the UK is synchronised with any changes in international standards.
Survey returns are run through a series of checks to identify errors. These checks ensure that:
- responses to individual questions are consistent within the questionnaire as a whole, that is, totals equate to the sum of the parts
- the return is consistent with historical data from the business
Further quality assurance applied includes the detection and treatment of outliers; application of imputation (ratio and means of ratio); and the application of disclosure control. Statistical disclosure control methodology is applied to the ITIS survey data before release of the publication. This means that some published tables have been altered to ensure that information attributable to an individual or individual organisation is not identifiable in any published outputs. The Code of Practice for Statistics describes the data protection procedures applied.
4.3 Quality assurance process at ONS – Trade in Tourism
Travel and tourism statistics are usually based on the results of the International Passenger Survey (IPS), but the survey was suspended on 16 March 2020 because of the coronavirus (COVID-19) pandemic. No IPS data were collected for the period when the survey was not operational. Tourism data for the months April to December 2020, are based on administrative sources and modelling[footnote 7].
Outlined below are details of the quality assurance process at ONS for the International Passenger Survey.
Sampling frame and data collection
The IPS conducts between 700,000 and 800,000 interviews a year, of which over 250,000 are used to produce estimates of overseas travel and tourism. Published estimates are based on face-to-face interviews with a random sample of passengers as they enter or leave the UK by the principal air, sea and tunnel routes.
The IPS uses a multi-stage sample design, where the sampling for air, sea and tunnel travel is carried out separately, although the underlying principle for each mode of travel is broadly similar. In the absence of a sampling frame of travellers, time periods (or sea or shuttle crossings) at selected ports and routes are chosen at the first stage and travellers are then systematically selected at fixed intervals from a random start within these interviewing shifts or crossings at the second stage.
Validation and quality assurance
Numerous checks are built into the Computer Assisted Data Input (CADI) program, which acts as the first form of data validation and thus reduces the number of errors. On return of survey data to the office, a comprehensive suite of edits and validation checks are carried out to clarify (and correct where necessary) any outstanding issues with the data. These include:
- checking zero spend, for example, from the completed questionnaire
- checking high spend to ensure this has been correctly coded
- coding towns, countries, airlines, not included on the interviewers’ coding frames
- checking missing information to determine whether anything was written on the paper questionnaire that would enable the information to be input
- reviewing internal inconsistencies that have been identified, or flagged by the interviewer
Where the responses for the main items of interest are missing, the values are imputed on a topic by topic basis where the method is broadly similar for each topic. The IPS implements a mean-value within class imputation procedure as detailed in the IPS methodology[footnote 8].
5. Quality assurance processes at DCMS
The majority of quality assurance of the data underpinning the DCMS Sectors Economic Estimates Trade release takes place at HMRC and ONS, through the processes described above. However, further quality assurance checks are carried out within DCMS at various stages.
Production of the report is typically carried out by one member of staff, whilst quality assurance is completed by at least one other, to ensure an independent evaluation of the work.
5.1 Data requirements
For Trade in Goods, data for the UK totals are downloadable from the HMRC website, via the “build your own tables” platform, however for ease of use, HMRC provide bespoke analysis for DCMS sectors, sent to the department as an excel spreadsheet which includes breakdowns by countries. HMRC apply disclosure control to the data before sending it to DCMS and therefore DCMS does not apply any further disclosure control. More information can be found on the UK Trade Info website.
For the Trade in Services data, DCMS discusses its data requirements with ONS and these are formalised as a Data Access Agreement (DAA). The DAA covers which data are required, the purpose of the data, and the conditions under which ONS provide the data. Discussions of requirements and purpose with ONS improve the understanding of the data at DCMS, helping us to ensure we receive the correct data and use it appropriately.
For Tourism estimates, data are taken directly from the ONS International Passenger Survey (IPS).
5.2 Checking of the data delivery
Trade in Goods
Once the data is sent to DCMS, the following initial steps are taken:
- Check for changes made to the Combined Nomenclature codes by EU agencies using correlation tables and whether these affect any of the DCMS Sector goods codes
- Decide how and where (in which DCMS Sector, if applicable) to classify the new Commodity Codes (resulting from the changes). This is done by matching the CN08 codes to the European Classification of Economic Activities (NACE) 2.1 at the 4-digit level, which is equivalent to 4 digit SIC codes.
- Lookup tables can then be created for DCMS sectors by identifying SIC codes for each sector. These tables are published along with the published statistics for Trade in Goods in the DCMS Sectors.
Data analysis
The Trade in Goods table production is carried out in the programming language R with built in code to calculate the Below Threshold Trade Average estimates for EU Trade. The Intrastat dataset only requires trade above set thresholds to be included (£250,000 for exports; £1.5m for imports). If a business’s EU Exports and/or Imports for a calendar year exceed the threshold (£250,000 for EU exports and £1,500,000 for EU imports) they are required to submit monthly Intrastat supplementary declarations. Therefore, an estimate for trade below this threshold is required and this is called BTTA. BTTA is only estimated for EU trade, so this does not affect Non-EU trade.
Once tables have been run in R and exported in Excel for the latest year, DCMS builds in the following checks at this stage:
- Checks that summing up breakdowns gives the same figure as the total they contribute to. E.g.:
- Do sub-sectors within the Creative Industries sum to the Creative Industries total?
- Do the individual geographic figures sum up to the wider geographic total (e.g. do the individual continents sum up to the World total?)?
- “Sense checks” of the data. E.g.:
- Are the proportions of each sector and subsectors similar to last year? If not, could this because of changes to the methodology?
- Looking at any large differences between the data and possible causes to these.
Trade in services
For these Trade in Services estimates, we have an ongoing data access agreement with ONS which allows DCMS to have early access to the estimates prior to publication by ONS. Outputs are provided to us in aggregated form based on R code supplied by DCMS. One csv file is provided for exports (receipts), and another for imports (payments), for the most recent year.
For this particular data we check that:
- We have received all data at the 4 digit SIC code level, which is required for us to aggregate up to produce estimates for our sectors and sub-sectors.
- There is no repetition of totals in order to avoid double counting.
- Data at the 4 digit SIC code has not been rounded unexpectedly. This would cause rounding errors when aggregating up to produce estimates for our sectors and sub-sectors.
Data analysis
Data provided by ONS requires secondary and tertiary disclosure controls to minimise risk of disclosive data being published. These are applied by DCMS in Excel. DCMS also builds in the following checks at this stage:
- Checks that summing up breakdowns gives the same figure as the total they contribute to. E.g.:
- Do sub-sectors within the Creative Industries sum to the Creative Industries total?
- Do the individual geographic figures sum up to the wider geographic total (e.g. do the individual continents sum up to the World total?)? Do these geographic classifications satisfy the relevant guidance (e.g. BPM6)?
- “Sense checks” of the data, which can then be queried with ONS colleagues. E.g.:
- Are the proportions of each sector and subsectors similar to last year? If not, why?
- Looking at any large differences between the data, when compared like-for-like with the previous year.
Trade in Tourism
For the Tourism estimates, DCMS take the latest figures from the IPS that are published by the ONS. Additionally, some specific, detailed country breakdowns data are received from Visit Britain (for example, breakdowns for smaller countries not published by the ONS). The relevant data from both these datasets are then included in the published tables.
For the Tourism data, we check that:
- The data has been copied correctly from the files received by the data provider.
- The correct data year is copied over.
5.3 Quality assurance of data analysis
Once analysis is complete for the goods and services data, DCMS document the checks needed for quality assurers to carry out.
The checks for this release include:
- Introductory checks (correct files, years etc. used).
- Checking that the various stages of data processing have been correctly calculated. This includes checking that:
- The syntax is accurate
- The correct codes (SIC or Commodity) have been aggregated together to form DCMS sector (and sub-sector) estimates.
- That all codes we require are included, and that any non-DCMS codes have not been included by accident.
- Checking the data to make sure it is not possible to derive disclosive data from the figures that are published. (Only applicable for Services data).
- Making sure the correct data has been pasted to the final tables for publication and are formatted correctly.
- Making sure all charts are linking (correctly) to the right data and all maps produced are using the correct data.
5.4 Dissemination
Finalised figures are disseminated within spreadsheets and a written report (which includes written text, graphs, tables and infographics) published on GOV.UK. Since spring 2020 statistical reports are published in HTML format. These are produced by the Trade statistics lead. Before publishing, a quality assurer checks the figures match between the working-level analysis, the tables and the written report. The quality assurer also makes sure any statements made about the figures (e.g. regarding trends) are correct according to the analysis and checks for spelling or grammar errors.
6. Other data sources
It is recognised that there are different ways to define sectors, but their relevance depends on what they are needed for. Government generally favours classification systems which are: * rigorously measured, * internationally comparable, * nationally consistent, and * ideally applicable to specific policy interventions.
These are the main reasons for DCMS constructing sector classifications from 8-digit commodity codes of the Combined Nomenclature (CN) and Standard Industrial Classification (SIC) codes. However, DCMS accepts that there are limitations with these approaches and alternative definitions can be useful where a policy-relevant grouping of businesses crosses existing 8-digit commodity codes and Standard Industrial Classification (SIC) codes. DCMS is aware of other estimates of its sectors. These estimates use various methods and data sources, and can be useful for serving several purposes, e.g. monitoring progress under specific policy themes such as community health or the environment, or measuring activities subsumed across a range of SICs and commodity codes.
The table below shows different sources of analysis measuring UK trade from other organisations. The sources also include data on some DCMS sectors although definitions differ across the organisations. It is recognised that there will be many other sources of evidence from industry bodies, for example, which have not been included in this table. This will be developed over time to capture a wider spectrum of stakeholder’s releases.
Table 1: Alternative data sources measuring UK trade.
| Organisation | Summary of data source |
|---|---|
| Office for National Statistics (ONS) | UK Trade statistics compiled by ONS are measured through both imports and exports of goods and/or services. Data is supplied from over 30 feeder sources including a variety of admin sources, the main one being HMRC (for goods data) and from surveys such as ITIS (international Trade in Services) and IPS (International Passenger Survey). ONS makes several adjustments to the trade in goods data provided by HMRC to meet the international definitions of Balance of Payments statistics - for example recording when goods actually change ownership. This adjustment enables the trade in goods figures to be added to the trade in services figures to give a total trade figure that is consistent on a balance of payment basis. |
| Department for International Trade (DIT) | DIT publishes statistics on international trade, including imports and exports, strategic export controls, foreign direct investment, and inward investment. Data published by DIT draws on a number of sources from the Office for National Statistics (ONS), HM Revenue & Customs (HMRC) and international databases. |
| United Nations Conference on Trade and Development (UNCTAD) | UNCTAD collects, manages and disseminates data, statistics and trends in international trade and trade policy, including customs tariffs, tariff preferences, trade agreements, non-tariff measures and trade defence measures, and trade flows. Data is available for its 195 members, including the UK. |
| Organisation for Economic Co-operation and Development (OECD) | The OECD is an intergovernmental economic organisation with 38 member countries (including the UK) ,founded in 1961 to stimulate economic progress and world trade. The OECD publishes statistics on exports and imports of OECD countries and provides a detailed insight into the most recent trends in trading patterns for OECD countries with the rest of the world. Data are broken down by economic groupings, by country (including the UK) and by region. |
| World Trade Organisation (WTO) | The WTO publishes statistics on merchandise trade and trade in services statistics (annual, quarterly and monthly), market access indicators (bound, applied & preferential tariffs), non-tariff information as well as other indicators. Data is available for its 164 members, including the UK. |
7. Next Steps
We encourage our users to engage with us so that we can improve our statistics and the documentation surrounding them. If you would like to comment on this quality assurance report, or have any enquiries please get in touch at evidence@dcms.gov.uk.
-
CN08 is based on the Harmonised System (HS) of tariff nomenclature and are 8 digit codes that identify categories of goods. The first 6 digits correspond to the HS code, with the 7th and 8th digits adding further detail. This is an internationally standardised system of coding for classifying goods for trade. DCMS Sectors are defined at the 4 digit SIC code level, and therefore a conversion from SIC to the CN codes was used to find the best match. ↩
-
The ITIS survey is completed by service-trading businesses who fill out a series of fields, essentially estimating trade in services to the nearest £1000 for a range of service types. They also log their business, which is then matched to an industry SIC code ↩
-
Sampling error is the error caused by observing a sample (as in a survey) instead of the whole population (as in a census). While each sample is designed to produce the “best” estimate of the true population value, a number of equal-sized samples covering the population would generally produce varying population estimates. ↩
-
(HMRC): UK Overseas Trade in Goods Statistics Summary of 2021 Trade in Goods, Methodology notes ↩
-
(European Central Bank): Implementation of the Balance of Payments and International Investment Position Manual (BPM6) ↩
-
(OECD): Manual on Statistics of International Trade in Services ↩
-
(ONS): Overseas Travel and Tourism: 2020 – Section 6: Data Sources and quality ↩