DCMS Sectors Economic Estimates 2019: Trade in services - Technical and Quality Assurance report
Updated 24 May 2024

© Crown copyright 2024
This publication is licensed under the terms of the Open Government Licence v3.0 except where otherwise stated. To view this licence, visit nationalarchives.gov.uk/doc/open-government-licence/version/3 or write to the Information Policy Team, The National Archives, Kew, London TW9 4DU, or email: psi@nationalarchives.gov.uk.
Where we have identified any third party copyright information you will need to obtain permission from the copyright holders concerned.
This publication is available at https://www.gov.uk/government/statistics/dcms-sectors-economic-estimates-2019-trade-in-services/dcms-sectors-economic-estimates-2019-trade-in-services-technical-and-quality-assurance-report
This document covers the following topics:
- an overview of the content covered in the statistical release ‘DCMS Economic Estimates 2019: Trade in Services’
- an overview of DCMS Sectors, how they are defined, and limitations of these definitions (in particular as related to the trade statistics)
- the methodology underlying the statistical release, including data sources
- the processes used to check that the estimates have been produced correctly
- other sources of information for the DCMS sectors
- further information, including contact details for DCMS statisticians.
1. Overview of release
The statistics release ‘DCMS Economic Estimates 2019: Trade in Services’ reports estimates of exports and imports of services by value for businesses in DCMS Sectors (excluding Tourism and Civil Society) in current prices. Any changes between years may reflect changes in the absolute value of the £ (affected by the domestic rate of inflation and by exchange rates), as well as changes in actual trade volume.
These statistics are further broken down by selected countries, regions and continents. The latest year for which these estimates are available is 2019. Estimates of trade in services have been constructed from ONS official statistics using international classifications (Standard Industrial Classification (SIC) codes).
Data are available for each DCMS Sector (excluding Tourism and Civil Society) and subsectors within the Creative Industries, Digital Sector, and Cultural Sector. There is significant overlap between DCMS Sectors so users should be aware that the estimate for “DCMS Sectors Total” is lower than the sum of the individual sectors.
The estimates in the publication are consistent with national (UK) estimates, published by the Office for National Statistics (ONS).
1.1 Code of Practice for Statistics
DCMS Sector Economic Estimates 2019: Trade in Services is an official statistic and has been produced to the standards set out in the Code of Practice for Statistics. In June 2019, the DCMS Sector Economic Estimates were badged as National Statistics. This affirms that the statistics have met the requirements of the Code of Practice for Statistics. The DCMS Sector Economic Estimates for Trade presented in this report remain official statistics as advised by the Office for Statistics Regulation.
1.2 Users
The users of these statistics fall into five broad categories:
- Ministers and other political figures
- Policy and other professionals in DCMS and other Government departments
- Industries and their representative bodies
- Charitable organisations
- Academics
The primary use of these statistics is to monitor the performance of the industries in the DCMS sectors, helping to understand how current and future policy interventions can be most effective.
2. Sector definitions
2.1 Overview of DCMS Sectors
Main sector definitions
The sectors for which DCMS has responsibility are:
- Civil Society
- Creative Industries
- Cultural Sector
- Digital Sector
- Gambling
- Sport
- Telecoms
- Tourism
In order to measure the size of the economy it is important to be able to define it. DCMS uses a range of definitions based on internal or UK agreed definitions. All definitions are based on the Standard Industrial Classification 2007 (SIC) codes. This means nationally consistent sources of data can be used and enables international comparisons.
The development of individual sector definitions in isolation as new sectors have fallen within the department’s remit has meant that there is overlap between DCMS sectors. For example, the Cultural Sector is defined using SIC codes that are nearly all within the Creative Industries, whilst the Telecoms Sector is completely within the Digital Sector.
Figure 1 below visually shows the overlap between DCMS Sectors in terms of SIC codes. Users should note that this does not give an indication of the magnitude of the value of overlap. For this, users should consult the main report. A list of SIC codes appearing in each sector and subsector can be found in the tables accompanying the release.
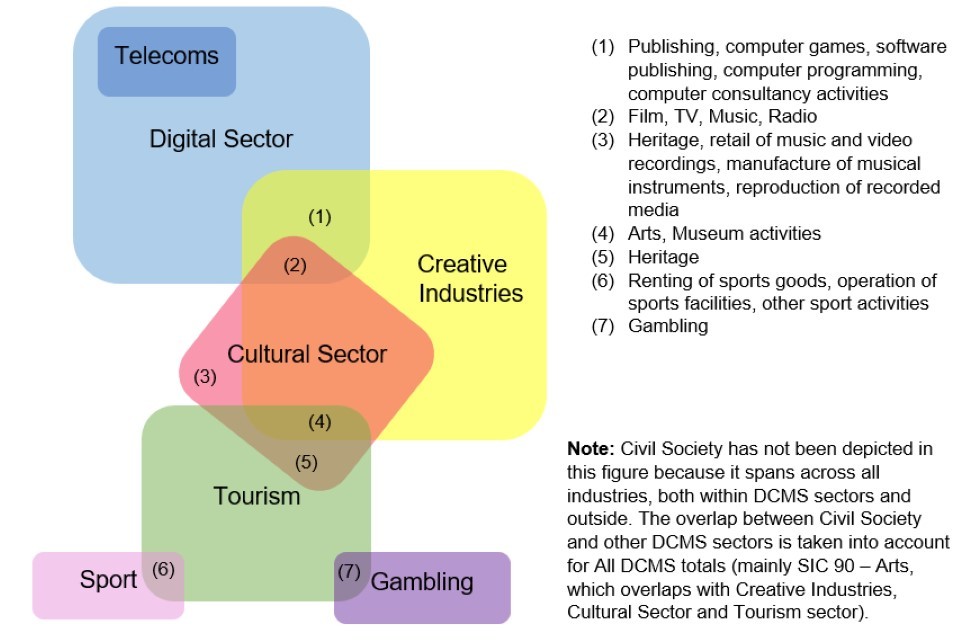
Figure 1: Overlap of SIC codes within DCMS Sectors
Other sector definitions
Additional analysis is presented for the Audio Visual sector.
The definition of the Audio Visual sector (see below) is intended to reflect the sectors covered by the EU Audio Visual Media Services Directive.
- 59.11 - Motion picture, video and television programme production activities
- 59.12 - Motion picture, video and television programme post-production activities
- 59.13 - Motion picture, video and television programme distribution activities
- 59.2 - Sound recording and music publishing activities
- 60.1 - Radio broadcasting
- 60.2 - Television programming and broadcasting activities
- 63.91 - News agency activities
- 63.99 - Other information service activities n.e.c.
- 77.22 - Renting of video tapes and disks
- 77.4 - Leasing of intellectual property and similar products, except copyrighted works
2.2 Details and limitations of sector definitions
This section looks at sector definitions in more detail, and provides an overview of limitations. There are substantial limitations to the underlying classifications. As the balance and make-up of the economy changes, the SIC, finalised in 2007, is less able to provide the detail for important elements of the UK economy related to DCMS Sectors, and therefore best fit SIC codes have been used to produce these estimates. The following section describes limitations for specific DCMS sector definitions.
Civil Society
In July 2016, DCMS took on responsibility for the Office for Civil Society (renamed “Civil Society and Youth” in January 2021), which covers charities, voluntary organisations or trusts, social enterprises, mutuals and community interest companies. The Civil Society sector is not like a traditional industry and therefore data are not readily available in the usual data sources. Civil Society estimates for trade in services are not available.
Creative Industries
The Creative Industries were defined in the Government’s 2001 Creative Industries Mapping Document as “those industries which have their origin in individual creativity, skill and talent and which have a potential for wealth and job creation through the generation and exploitation of intellectual property”.
The definition used for the Creative Industries in this release does not allow consideration of the value added of “creative” to the wider economy, such as Creative Occupations outside the Creative Industries. DCMS policy responsibility is for creative industries across the economy and therefore this is a significant weakness in the current approach.
Cultural Sector
There are significant limitations to the DCMS measurement of the cultural sector arising from the lack of detailed disaggregation possible using the standard industrial classifications. There are many cases where culture forms a small part of an industry classification and therefore cannot be separately identified and assigned as culture using standard data sources. DCMS consulted on the definition of Culture and published a response in April 2017.
It is recognised that, due to the limitations associated with SIC codes, the SIC code used in past publications as a proxy for the Heritage sector (91.03 - Operation of historical sites and building and similar visitor attractions) is likely to be an underestimate of this sector’s value. We have changed the name of the Heritage sector to ‘Operation for historical sites and similar visitor attractions’ to reflect this.
Digital Sector
The definition used for the Digital Sector does not allow consideration of the value added of “digital” to the wider economy e.g. in health care or construction. DCMS policy responsibility is for digital across the economy and therefore this is a significant weakness in the current approach.
Gambling
The definition of gambling used in the DCMS Sectors Economic Estimates is consistent with the internationally agreed definition, SIC 92, Gambling and betting activities.
Sport
The definition of sport used in the release is based on the EU agreed core/statistical Vilnius definition, which includes only SIC codes which are predominately sport.
Tourism
Estimates of imports and exports for Tourism are based on a different methodology to other DCMS sectors, which combines goods and services together using the International Passenger Survey. The 2019 data for this was published in October 2020, concurrent with our Trade in Goods estimates, and is not included in this release.
3. Methodology
This section provides details of how estimates of imports and exports of services are produced.
Estimates in the publication are in current prices (i.e. not adjusted for inflation) and are based on data from the International Trade in Services (ITIS) survey.
3.1 Method
The ITIS survey is completed by service-trading businesses who fill out a series of fields, essentially estimating trade in services to the nearest £1000 for a range of service types. They also log their business, which is then matched to an industry SIC code.
For DCMS, we receive these fields after some cleaning set out below. We then aggregate the relevant value of trade for each of the DCMS SIC codes to get estimates for our sectors and subsectors, including understanding how these sectors and subsectors overlap.
The definitions of ‘exports’ and ‘imports’ for the services data are calculated on a ‘Balance of Payments’ basis i.e. services entering and leaving an economic territory are not recorded as imports or exports unless they change ownership (between UK residents and non-residents). By contrast, the goods data defines exports and imports on a cross-border basis (even if the ownership has not changed).
As part of the aggregation process there is a multi-stage process for disclosure control. This uses factors like the number and size of businesses to check that the statistics published do not disclose any potentially sensitive information relating to any identifiable business.
Total UK estimates which are used to calculate the percentage of UK total for each sector are taken from the annual Pink Book, which balances inward and outward transactions to/from the UK. The data used are:
- Exports of services, KTMQ
- Imports of services, KTMR
Note on SIC 92.00: The Gambling sector (SIC 92.00) is relatively small and therefore changes in trading activity, reporting structure or industrial classification for any business can have a large impact on the overall sector figures. This was witnessed in 2015 and 2017 data particularly, whilst in 2018 and 2019 the exports for services failed disclosure checks for similar reasons. Care should therefore be taken when comparing these figures over time.
3.2 Trade by destination/source
The estimates in the release are further broken down by all listed individual partners, plus selected continents, regional areas and other amalgamations (e.g. European Union member states, North American Free Trade Association members, Gulf states). Country classifications are consistent with the Balance of Payments Vademecum.
This is an expansion on previous statistics based on user needs and improvements to processes for the statistics.
3.3 Summary of data sources
In summary, the data presented in this report on trade in services
- are based on official statistics data sources
- are based on internationally-harmonised codes
- are based on survey data and, as with all data from surveys, there will be an associated error margin surrounding these estimates[footnote 1]
This means the estimates are:
- comparable at both a national and international level.
- comparable over time, allowing trends to be measured and monitored
However, this also means the estimates are subject to limitations of the underlying classifications of the make-up of the UK economy. For example, the standard industrial classification (SIC) codes were developed in 2007 and have not been revised since. Emerging sectors, such as Artificial Intelligence, are therefore hard to capture and may be excluded or mis-coded.
4. Quality assurance processes
This section summarises the quality assurance processes applied during the production of these statistics by our data providers, the Office for National Statistics (ONS), as well as those applied by DCMS.
4.1 Quality Assurance Processes at ONS
Quality assurance at ONS takes place at a number of stages, outlined below. To note, information presented here on the data sources are taken from the International trade in services Quality Methodology Information (QMI) and should be credited to the ONS.
The International Trade In Services (ITIS) data shows the import and export activity of UK companies overseas and is the main source of information for UK trade. The data is based solely on survey data.
4.2 Sampling frame and data collection
ITIS data are based on a quarterly sample of approximately 2,200 businesses and an annual sample of approximately 18,200 businesses. Response rate targets are 85% for both annual and quarterly ITIS data.
The survey data from both the quarterly and annual results are combined to produce the annual ITIS estimates and are used as a main data source to compile total trade in services estimates. It is worth noting that the surveys do not provide full coverage of the UK economy, and excluded sectors include: travel and transport; banking and other financial institutions; higher education; and most activities in the legal professions.
The ITIS survey is supplemented by the Annual Business Survey (ABS). Historically, ITIS’ product-level estimates have been derived from the ABS. Since 2018, product- and industry-level data have been improved by directly surveying companies operating in some industries from ITIS itself. However, the ABS is still used as part of the process, for example to help inform the sample for these industries.
ITIS data are collected by both industry and service on a geographical basis, by collecting data for the countries to which services are exported to and where they are imported from. The ITIS estimates are published annually.
Data relating to the import or export of goods are excluded from this survey. However, merchanting (earnings from arranging the sale of goods between two countries outside the UK and where the goods never physically enter the UK) is included along with earnings from commodity trading. As with merchanting, the services element is calculated as the businesses’ profit minus the loss.
Validation and quality assurance
There is no simple way of measuring the accuracy of ITIS statistics, that is, the extent to which they measure the underlying “true” value for a particular period. Non-sampling errors are not easy to quantify and include errors of coverage, measurement, processing and non-response. Various procedures and checks are made to ensure these errors are minimised. As ITIS is based on survey responses, ONS systems validate these entries and prompt confirmation of suspect data is sought.
Every effort is made to ensure that the series are comparable over time. International standards (BPM6 and MSITS 2010) are used in the production of ITIS data; therefore, figures published by the UK should be comparable with other countries. UK representation in working groups will ensure that the UK is synchronised with any changes in international standards.
Survey returns are run through a series of checks to identify errors. These checks ensure that:
- responses to individual questions are consistent within the questionnaire as a whole, that is, totals equate to the sum of the parts
- the return is consistent with historical data from the business
Further quality assurance applied includes the detection and treatment of outliers; application of imputation (ratio and means of ratio); and the application of disclosure control. Statistical disclosure control methodology is applied to the ITIS survey data before release of the publication. This means that some published tables have been altered to ensure that information attributable to an individual or individual organisation is not identifiable in any published outputs. The Code of Practice for Statistics describes the data protection procedures applied.
4.3 Quality assurance processes at DCMS
The majority of quality assurance of the data underpinning the DCMS Sectors Economic Estimates Trade in Services release takes place at ONS, through the processes described above. However, further quality assurance checks are carried out within DCMS at various stages.
Production of the report is typically carried out by one member of staff, whilst quality assurance is completed by at least one other, to ensure an independent evaluation of the work.
Data requirements
Compared to the summer 2019 publication, which featured Trade in Goods, Trade in Services and Tourism estimates (which measures tourist expenditure on both goods and services combined) for the years up to 2017, the subsequent Trade in Services data (2018 estimates and 2019 estimates) have been published on a more timely basis, in response to user needs. In particular, they are published only days after the headline ONS estimates for ITIS.
As part of this, DCMS submitted a business case specifying its updated data requirements to ONS. To reduce the risk of accidental disclosure of unpublished data, ONS agreed to use software produced by DCMS to calculate the figures required for this report and supply these to DCMS rather than the full microdata.
It is still expected that the raw data shall be provided following the release of these statistics, as in previous years. The terms of use for these data is formalised in a Data Access Agreement (DAA) between DCMS and ONS. The DAA covers which data are required, the purpose of the data, and the conditions under which ONS provide the data. Discussions of requirements and purpose with ONS improve the understanding of the data at DCMS, helping us to ensure we receive the correct data and use it appropriately.
Checking of the data delivery
For these Trade in Services estimates, one csv file is provided for exports, and another for imports, for the most recent year. We check we have received data for all sectors and for all relevant 4-digit SIC codes (for the overlap charts).
Later in February, or in March, one raw data file will be received from the ONS, sent in csv format. For 2015 data and older, we were sent two files in text file format - one for Exports (‘Receipts’) and one for Imports (‘Payments’).
For this particular data we check that:
- We have received all data at the 4 digit SIC code level, which is required for us to aggregate up to produce estimates for our sectors and sub-sectors.
- There is no repetition of totals in order to avoid double counting.
- Data at the 4 digit SIC code has not been rounded unexpectedly. This would cause rounding errors when aggregating up to produce estimates for our sectors and sub-sectors.
Data analysis
For this release, the data (Trade in Services 2019) is provided to us by ONS in aggregated form based on R code supplied by DCMS. However, these still require secondary and tertiary disclosure controls to minimise risk of disclosive data being published. These are applied by DCMS in Excel.
DCMS also builds in the following checks at this stage:
- Checks that summing up breakdowns gives the same figure as the total they contribute to. E.g.:
- Do sub-sectors within the Creative Industries sum to the Creative Industries total?
- Do the individual geographic figures sum up to the wider geographic total (e.g. do the individual continents sum up to the World total?)? Do these geographic classifications satisfy the relevant guidance (e.g. BPM6)?
- “Sense checks” of the data, which can then be queried with ONS colleagues. E.g.:
- Are the proportions of each sector and subsectors similar to last year? If not, why?
- Looking at any large differences between the data, when compared like-for-like with the previous year.
Quality assurance of data analysis
Once analysis is complete, DCMS document the checks needed for quality assurers to carry out. The checks for this release include:
- Introductory checks (correct files, years etc. used).
- Checking the data to make sure it is not possible to derive disclosive data from the figures that are published.
- Making sure the correct data has been pasted to the final tables for publication and are formatted correctly.
- Making sure all charts are linking (correctly) to the right data and all maps produced are using the correct data.
For the full raw data, DCMS will also carry out extra checks, which may include:
- Using a different software package (SPSS) to attempt to replicate (a sample of) the outputs produced by R (currently the main package used to calculate the statistics).
- Checking that the various stages of data processing have been correctly calculated. This includes checking that:
- The syntax is accurate
- The correct codes have been aggregated together to form DCMS sector (and sub-sector) estimates.
- That all codes we require are included, and that any non-DCMS codes have not been included by accident.
Dissemination
Finalised figures are disseminated within Excel tables and a written report (which includes written text, graphs, tables and infographics) published on GOV.UK. Since spring 2020 statistical reports are published in HTML format. These are produced by the Trade statistics lead. Before publishing, a quality assurer checks the figures match between the working-level analysis, the tables and the written report. The quality assurer also makes sure any statements made about the figures (e.g. regarding trends) are correct according to the analysis and checks for spelling or grammar errors.
5. External Data Sources
It is recognised that there are always different ways to define sectors, but their relevance depends on what they are needed for. Government generally favours classification systems which are
- rigorously measured,
- internationally comparable,
- nationally consistent, and
- ideally applicable to specific policy interventions.
These are the main reasons for DCMS constructing sector classifications from Standard Industrial Classification (SIC) codes. However, DCMS accepts that there are limitations with this approach and alternative definitions can be useful where a policy-relevant grouping of businesses crosses existing Standard Industrial Classification (SIC) codes. DCMS is aware of other estimates of DCMS Sectors. These estimates use various methods and data sources, and can be useful for serving several purposes, e.g. monitoring progress under specific policy themes such as community health or the environment, or measuring activities subsumed across a range of SICs.
The main data sources for trade in services are the International Trade in Services (ITIS) datasets and the ONS Pink Book, which includes all services and balance of payments estimates (ITIS excludes travel, transport and banking), These do not precisely look at our sectors, and one of them uses the same dataset, but provide potential alternative proxies for our sectors.
For analysis looking at service types, as opposed to breakdowns of all services trade by business, the ONS publish information on the Modes of Supply for Trade in Services. These are estimated to be consistent with the ONS Pink Book estimates.
NESTA’s Policy and Evidence Centre used DCMS statistics and other data sources to produce a report on trade and the creative industries sector.
It is recognised that there will be many other sources of evidence from industry bodies, for example, which have not been included above. We encourage statistics producers within DCMS sectors who have not been referenced to contact the economic estimates team at evidence@dcms.gov.uk.
6. Further information
For enquiries on this release, please email evidence@dcms.gov.uk.
For general enquiries contact:
Department for Digital, Culture, Media and Sport
100 Parliament Street London
SW1A 2BQ
Telephone: 020 7211 6000
DCMS statisticians can be followed on Twitter via @DCMSInsight.
The Economic Estimates of DCMS Sectors release is an Official Statistics publication and has been produced to the standards set out in the Code of Practice for Statistics. For more information, see https://www.statisticsauthority.gov.uk/code-of-practice/.
-
Sampling error is the error caused by observing a sample (as in a survey) instead of the whole population (as in a census). While each sample is designed to produce the “best” estimate of the true population value, a number of equal-sized samples covering the population would generally produce varying population estimates. This means we cannot say an estimate of, for example, 20% is very accurate for the whole population. Our best estimates, from the survey sample, suggest that the figure is 20%, but due to the degree of error, the true population figure could perhaps be 18% or 22%. This is not an issue with the quality of the data or analysis; rather it is an inherent principle when using survey data to inform estimates. ↩