DCMS Sectors Economic Estimates 2019: Trade in services
Updated 24 May 2024

© Crown copyright 2024
This publication is licensed under the terms of the Open Government Licence v3.0 except where otherwise stated. To view this licence, visit nationalarchives.gov.uk/doc/open-government-licence/version/3 or write to the Information Policy Team, The National Archives, Kew, London TW9 4DU, or email: psi@nationalarchives.gov.uk.
Where we have identified any third party copyright information you will need to obtain permission from the copyright holders concerned.
This publication is available at https://www.gov.uk/government/statistics/dcms-sectors-economic-estimates-2019-trade-in-services/dcms-sectors-economic-estimates-2019-trade-in-services
Released: 11 February 2021
Geographic Coverage: United Kingdom
1. Introduction
This release provides estimates of exports and imports of services by businesses in DCMS Sectors (excluding Tourism and Civil Society) in current prices up to and including 2019.
The results are not affected by the coronavirus (COVID-19) pandemic in 2020 and the EU Exit transition period as the latest year for which data is reported is 2019.
This release covers trade in services only. Exports and imports of goods (up to and including 2019) was published on 29 October 2020.
Values of imports and exports are given in current prices and have not been adjusted for inflation. Year on year increases between figures given in current prices are likely to be higher than the ‘real’ (inflation-adjusted) value. Changes over time are therefore reported here as changes in the proportion of total UK imports and exports of services that are accounted for by businesses in DCMS sectors.
As stated in the Trade in Goods 2019 publication, minor planned revisions have been made to this Trade in Services data from 2015 up to and including 2018. These revisions include:
- A fuller set of countries than in previous Trade in Services publications
- Small modifications in country classifications, following a further clarification in line with the Balance of Payments Vademecum.
1.1 DCMS Sectors Economic Estimates
These statistics are part of a wider family of DCMS economic statistics (including gross value added, employment, business demographics etc.). These DCMS-Sector economic estimates enable stakeholders to evaluate the economic contribution of DCMS Sectors, which are not traditional National Account Sectors, and to understand how current and future policy interventions can be most effective.
The DCMS Sectors covered in this report are:
- Creative Industries
- Cultural Sector
- Digital Sector
- Gambling
- Sport
- Telecoms
Estimates of trade in the Tourism Sector are available in the DCMS Sectors Economic Estimates 2019: Trade publication, and are not included here.
The estimates of trade in Civil Society are not covered in this release, as there are no formally recognised measures of imports or exports for this Sector from the data sources available.
There is significant overlap between DCMS Sectors so readers should be aware that the estimate for “DCMS Sectors total” is lower than the sum of the individual Sectors. This is illustrated in Annex A.
2. Headline Findings
In 2019, trade in DCMS Sector (excluding Tourism and Civil Society) services in current prices was:
- £38.5 billion of service imports, 17.7% of total UK service imports, the same proportion as 2018 (17.7%).
- £62.9 billion of service exports, 19.8% of total UK service exports, a lower proportion than in 2018 (21.0%).
Figure 1 shows the value of exports and imports of services in current prices between 2015[footnote 1] and 2019 (total amounts and as a percentage of total UK services trade).
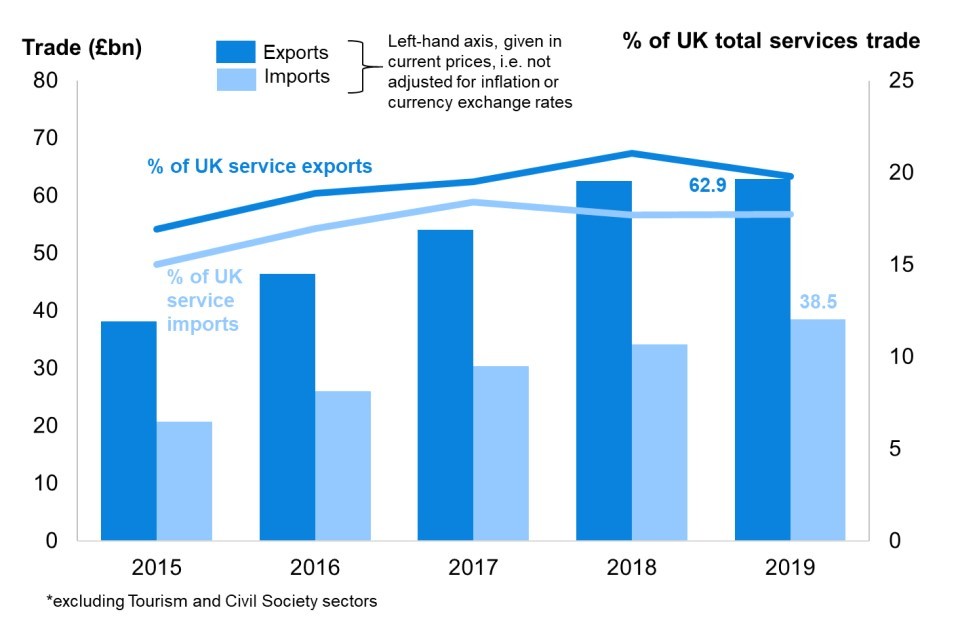
Figure 1: Trade in DCMS Sector (excl. Tourism and Civil Society) services, as a percentage of the UK total: 2015 to 2019
Exports of services have consistently been higher than imports of services i.e, the UK has run a trade in DCMS-sector services surplus with the rest of the world since 2015. The proportion of UK service exports and imports accounted for by DCMS Sectors grew between 2015 and 2017, with a peak in 2018 for service exports, and has since fluctuated between 19.5% and 21.0% for exports and between 17.7% and 18.4% for imports.
2.1 Trade by DCMS Sectors
The two DCMS Sectors which imported the most services in 2019 were:
- the Digital Sector, which imported £33.5bn worth of services (86.8% of the DCMS Sector total service imports)
- the Creative Industries, which imported £21.9bn worth of services (57.0% of the DCMS Sector total service imports)
The two DCMS Sectors which exported the most services in 2019 were:
- the Digital Sector, which exported £51.9bn worth of services (82.5% of the DCMS Sector total service exports)
- the Creative Industries, which exported £37.9bn worth of services (60.2% of the DCMS Sector total service exports).
Readers should note that DCMS Sectors are not mutually exclusive. For more detail, see DCMS Sector overlaps in Annex A.
2.2 Trade with the European Union (EU) and with non-European Union (non-EU) countries
- Of the £38.5bn services imported by DCMS Sector businesses in 2019, £17.4bn (45.3%) were imported from EU countries and £21.1bn (54.7%) were imported from non-EU countries.
- Of the £62.9bn of services exported by DCMS Sector businesses in 2019, £24.9bn (39.5%) were exported to EU countries and £38.1bn (60.5%) were exported to non-EU countries.
2.3 Trade with individual countries
The individual countries from which DCMS Sector businesses imported the most services in 2019 were:
- USA: £9.8bn of services, 25.5% of total DCMS Sector service imports
- Ireland: £5.0bn of services,13.0% of total DCMS Sector service imports
- India: £3.1bn of services, 8.1% of total DCMS Sector services imports.
The individual countries to which DCMS Sector businesses exported the most services in 2019 were:
- USA: £18.0bn of services, 28.6% of total DCMS Sector service exports
- Ireland: £4.1bn of services 6.5% of total DCMS Sector services exports
- Germany: £3.8bn of services, 6.1% of total DCMS Sector services exports
3. Imports of services
This chapter summaries the key facts and trends for the imports of services by DCMS Sectors (excluding Tourism and Civil Society).
3.1 Imports of services by DCMS Sector businesses
In 2019, of the £38.5bn services imported by DCMS Sectors:
- £33.5bn was imported by the Digital Sector (15.4% of UK service imports, an increase from 13.4% in 2015)
- £21.9bn was imported by the Creative Industries (10.1% of UK service imports, an increase from 7.2% in 2015)
- £5.3bn was imported by the Cultural Sector (2.5% of UK service imports, an increase from 2.2% in 2015)
- £4.3bn was imported by the Telecoms Sector (2.0% of UK service imports, a decrease from 3.7% in 2015)
- £1.2bn was imported by the Sport Sector (0.5% of UK service imports, the same proportion as 2015)
- £0.2bn was imported by the Gambling Sector[footnote 2] (0.1% of UK service imports, an increase from 0.04% in 2015)
Readers should note that DCMS Sectors are not mutually exclusive. For more detail, see DCMS Sector overlaps in Annex A.
Figure 2 shows the breakdown of imports of services by DCMS Sectors as a percentage of UK service imports. Specifically:
- In 2015, DCMS Sector service imports accounted for 15.0% of total UK service imports. By 2019 this had increased to 17.7%.
- The Digital Sector and Creative Industries are the biggest importers of services across the DCMS Sectors for all years between 2015 and 2019.
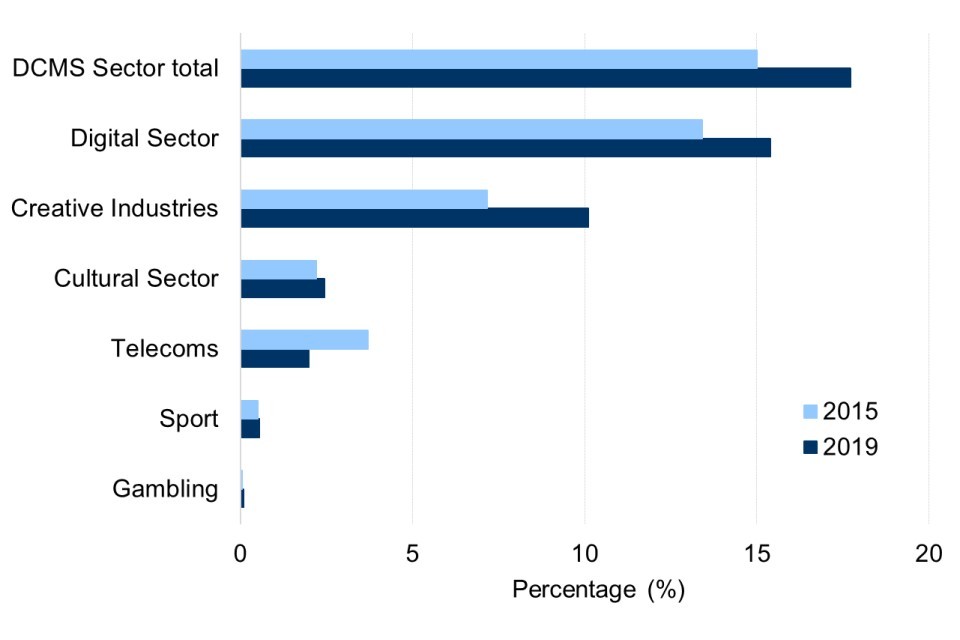
Figure 2: Imports of services by businesses in DCMS Sectors as a percentage of UK service imports, 2015 and 2019
Looking at individual sub-sectors, the largest contributor is ‘Computer programming, consultancy and related activities’, a Digital sub-sector. This imported £17.4bn, 51.9% of the Digital Sector total in 2019. This is an increase compared to 2015, when it represented 33.6% of the Digital Sector total in 2015.
Similarly, ‘IT and Computer Services’, a Creative Industries subsector, which contains two of the same industries as the above, imported £12.6bn in 2019. This was 57.3% of the Creative Industries total, a rise compared to 51.6% in 2015.
3.2 Trade with the European Union (EU) and non-European Union (non-EU) countries
Of the £38.5bn services imported by DCMS Sectors in 2019, £17.4bn worth of services (45.3%) were imported from EU countries and £21.1bn worth of services (54.7%) were imported from non-EU countries.
The proportion of services imported by DCMS Sector businesses from EU countries has remained relatively constant between 2015 and 2019, accounting for over two-fifths but less than half of all services imported from the world.
The table below shows a breakdown of the DCMS Sector service imports from EU and non-EU countries by individual sector in 2019.
| DCMS Sector | EU, £ (bn) | EU, % of Sector Total | Non-EU, £ (bn) | Non-EU, % of Sector total |
| Creative Industries | 8.1 | 36.9% | 13.9 | 63.1% |
| Cultural Sector | 2.5 | 47.2% | 2.8 | 52.8% |
| Digital Sector | 14.4 | 43.1% | 19.0 | 56.9% |
| Gambling Sector* | 0.2 | 82.5% | 0.0 | 17.5% |
| Sport Sector | 1.0 | 82.4% | 0.2 | 17.6% |
| Telecoms Sector | 2.7 | 62.1% | 1.6 | 37.9% |
| DCMS Sector total | 17.4 | 45.3% | 21.1 | 54.7% |
*All figures have been rounded to 1 decimal place. The value of services imported from non-EU countries by the Gambling Sector has been rounded to one decimal place. Sectors are not mutually exclusive and can overlap.
Across the DCMS Sectors:
- the Gambling Sector and the Sport Sector imported over 80% of their services from EU countries.
- the Creative Industries and the Digital Sector imported more than half their services from non-EU countries.
Readers should note that DCMS Sectors are not mutually exclusive. For more detail, see DCMS Sector overlaps in Annex A.
3.3 Trade with individual countries
Figure 3 shows the top 5 countries that the UK’s DCMS Sector businesses imported the most services from in 2019, alongside the largest and second largest sectors.
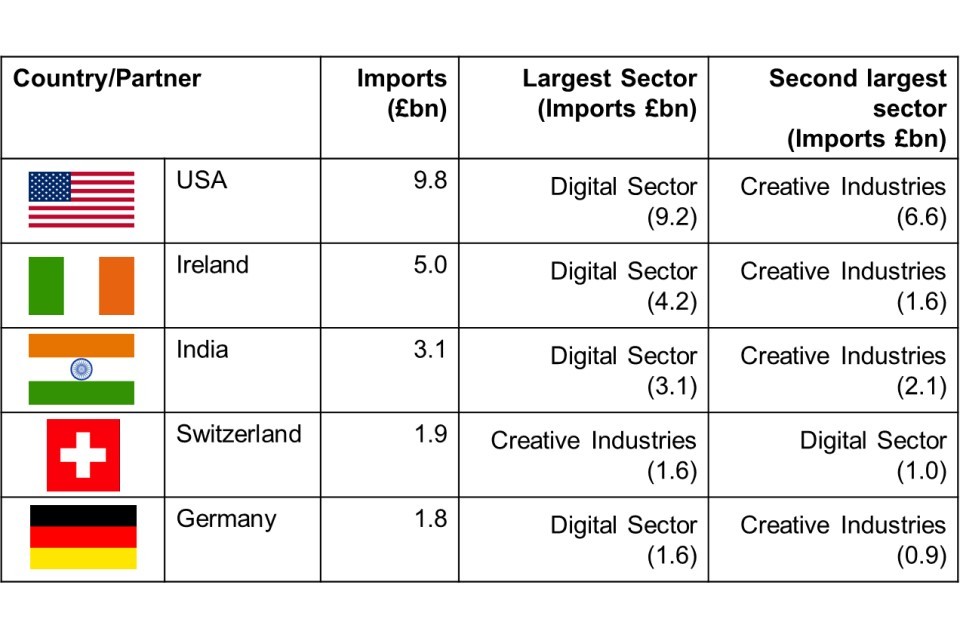
Figure 3: Five largest partner countries for the imports of services: total imports and largest sectors (2019)
In 2019:
- DCMS Sector businesses imported most services from the USA (£9.8bn), followed by Ireland (£5.0bn). This is broadly consistent with previous years.
- Across the top 5 countries, the Digital Sector was the largest source of DCMS Sector service imports.
- However, with Switzerland, the Creative Industries was the largest source of DCMS Sector service imports.
Since 2015:
- USA and Ireland have consistently featured as the top two countries that the UK’s DCMS Sector businesses have imported services from.
- Switzerland, Germany and France have consistently featured among the top five largest source countries for DCMS Sector service imports since 2015.
- India is a re-entry to the top-five in 2019, having also been in the list in 2017.
4. Exports of services
This chapter summarises the key facts and trends for the exports of services by DCMS Sectors (excluding Tourism and Civil Society).
Although the Gambling Sector is included in the DCMS Sector exports of services total here, we do not report the figure for the Gambling Sector separately. This is because the aggregated exports of services data for Gambling failed disclosure checks. These are tests that we apply to the data to make sure that respondents to the survey cannot be identified from the results.
4.1 Exports of services by DCMS Sector businesses
In 2019, of the £62.9bn services exported by DCMS Sectors:
- £51.9bn was exported by the Digital Sector (16.3% of UK service exports in 2019, an increase from 14.2% in 2015)
- £37.9bn was exported by the Creative Industries (11.9% of UK service exports in 2019, an increase from 9.4% in 2015)
- £10.3bn was exported by the Cultural Sector (3.3% of UK service exports in 2019, an increase from 2.8% in 2015)
- £5.4bn was exported by the Telecoms Sector (1.7% of UK service exports in 2019, a decrease from 2.9% in 2015)
- £3.8bn was exported by the Sport Sector (1.2% of UK service exports in 2019, an increase from 0.9% in 2015)
Readers should note that DCMS Sectors are not mutually exclusive. For more detail, see DCMS Sector overlaps in Annex A.
Figure 4 shows the breakdown of exports of services by DCMS Sectors as a percentage of UK service exports. Specifically:
- In 2015, DCMS Sector service exports accounted for 16.9% of total UK service exports. By 2019 this had increased to 19.8%.
- The Digital Sector and Creative Industries are the biggest exporters of services across the DCMS Sectors for all years between 2015 and 2019.
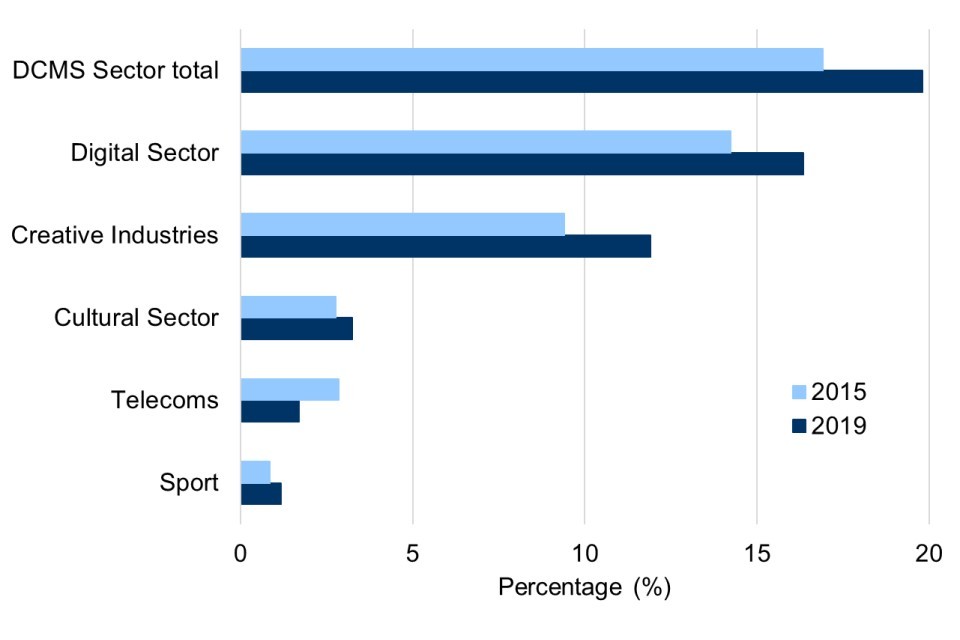
Figure 4: Exports of services by businesses in DCMS Sectors as a percentage of UK service exports, 2015 and 2019
Looking at individual subsectors, the largest contributor is the Computer programming, consultancy and related activities, a Digital subsector. This exported £24.6bn, 47.4% of the Digital Sector total in 2019. This is an increase compared to 2015, when it represented 37.7% of the Digital Sector total.
Similarly, ‘IT and Computer Services’, a Creative Industries subsector, which contains two of the same industries as the above, exported £19.2bn in 2019. This was 50.7% of the Creative Industries total, a rise compared to 46.4% in 2015.
4.2 Trade with the European Union (EU) and non-European Union (non-EU) countries
Of the £62.9bn services exported by DCMS Sectors in 2019, £24.9bn (39.5%) were exported to EU countries and £38.1bn (60.5%) were exported to non-EU countries.
The proportion of services exported by DCMS Sector businesses to EU countries was 43.3% in 2015 but has fallen year on year from 44.9% in 2016 to 39.5% in 2019.
The table below shows a breakdown of the DCMS Sector service exports from EU and non-EU countries by individual sector in 2019:
| DCMS Sector | EU, £ (bn) | EU, % of Sector Total | Non-EU, £ (bn) | Non-EU, % of Sector total |
| Creative Industries | 14.5 | 38.4% | 23.3 | 61.6% |
| Cultural Sector | 4.7 | 45.4% | 5.6 | 54.6% |
| Digital Sector | 20.6 | 39.8% | 31.3 | 60.2% |
| Sport Sector | 1.3 | 35.7% | 2.4 | 64.3% |
| Telecoms Sector | 2.0 | 37.2% | 3.4 | 62.8% |
| DCMS Sector total | 24.9 | 39.5% | 38.1 | 60.5% |
Across all DCMS Sectors, more than three fifths of services exported were exported to non-EU countries, with the exception of the Cultural Sector, which exported 54.6% of its services to non-EU countries.
Readers should note that DCMS Sectors are not mutually exclusive. For more detail, see DCMS Sector overlaps in Annex A.
4.3 Trade with individual countries
Figure 5 shows the five countries that the UK’s DCMS Sectors exported the most services to, by value, are shown in Figure 11 below.
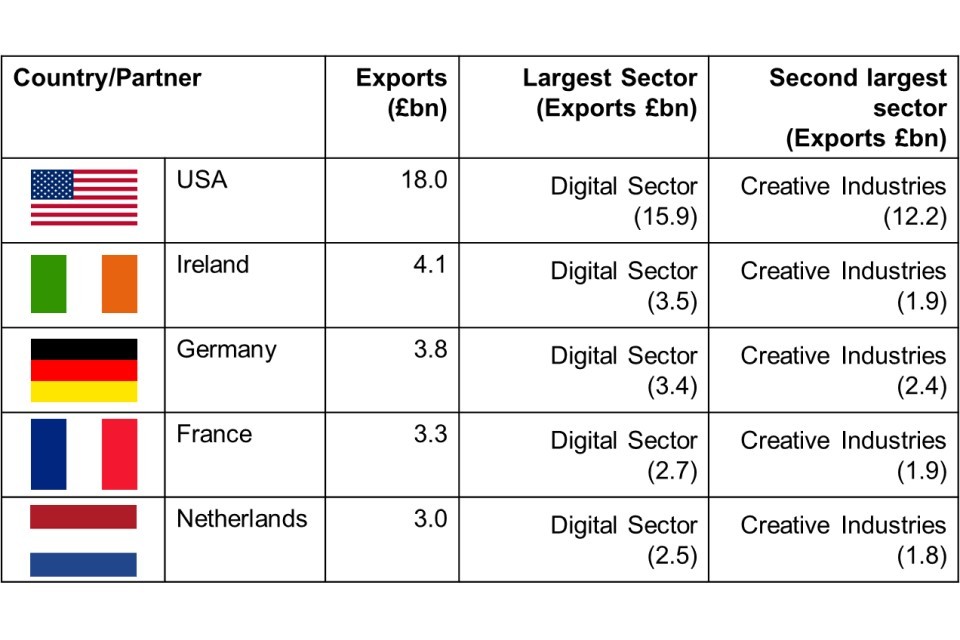
Figure 5: Five largest partner countries for DCMS Sector service exports, total exports and largest sectors (2019)
In 2019:
- DCMS Sectors exported most services to the USA (£18.0bn), followed by Ireland (£4.1bn). This is broadly consistent with previous years.
- Across the top 5 countries, the Digital Sector was the largest source of DCMS Sector service exports.
Since 2015:
- USA has consistently been the top country that the UK’s DCMS Sector businesses have exported the most services to.
- Germany and Ireland have alternated positions between 2nd and 3rd place across the years.
- France and Switzerland have also featured among the five largest export destination countries.
- Netherlands is a re-entry to the top-five in 2019, having also been in the list in 2017.
5. Annex A
5.1 Sector overlaps
The DCMS sectors are not mutually exclusive; industries may contribute to and be classified as more than one sector. This is illustrated for imports of services in DCMS Sectors in Figure 6, which shows that the total value of DCMS Sector service imports (£38.5bn) is not the sum of imports for the individual Sectors.
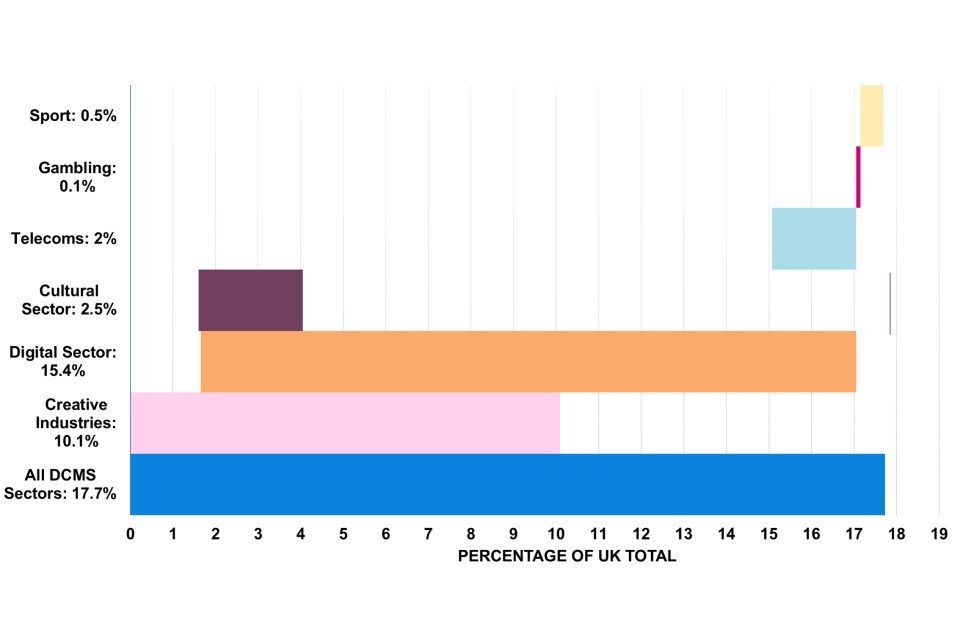
Figure 6: Imports of services by DCMS Sectors (excluding Tourism and Civil Society) as a percentage of total UK service imports (%, to 1dp): 2019
- There is substantial overlap between the Digital Sector (orange bar) and the Creative Industries (pink bar).
- In particular, the Digital sub-sector ‘computer programming, consultancy and related services’ is the biggest importer of services (£17.4bn in 2019) across the DCMS Sector sub-sectors.
- Half of the SIC codes within this sub-sector are also within the ‘IT, software and computer services’ – the largest Creative Industries sub-sector which imported £12.6bn services in 2019 and the second largest sub-sector across the DCMS Sectors.
- This suggests that industries can drive changes to the value of services imported by several DCMS sectors and to the overall DCMS Sector total.
6. Further information
- DCMS Sector Economic Estimates 2019: Trade in Services is an official statistic and has been produced to the standards set out in the Code of Practice for Statistics. In June 2019, the DCMS Sector Economic Estimates were badged as National Statistics. This affirms that the statistics have met the requirements of the Code of Practice for Statistics. The DCMS Sector Economic Estimates for Trade presented in this report remain official statistics, based on advice by the Office for Statistics Regulation.
- The responsible statistician for this release is Wilmah Deda. For enquiries on this release, please contact Wilmah on evidence@dcms.gov.uk.
- The next update to the DCMS trade statistics will be the 2020 data for goods and services. These are not expected to be published before autumn 2021. More information will be published nearer the time.
- Other economic measures, such as GVA, employment, and business demographics are available in separate publications. This series of releases enables stakeholders to evaluate the economic contribution of DCMS Sectors, and to understand how current and future policy interventions can be most effective.
-
The next set of publications of DCMS Sectors Economic Estimates are:
- DCMS Sector Economic Estimates 2019: Regional Gross Value Added (scheduled for Spring 2021)
- DCMS Sector Economic Estimates 2019: Business Demographics (scheduled for Spring 2021) The final dates will be announced via the DCMS statistical release calendar nearer the time.
- DCMS aims to continuously improve the quality of estimates and better meet user needs. Feedback on this report should be sent to DCMS via email at evidence@dcms.gov.uk.
- For general enquiries contact:
Department for Digital, Culture, Media and Sport
100 Parliament Street
London
SW1A 2BQ
Telephone: 020 7211 6000
-
2015 is the earliest year for which data is available that allows for reasonable comparison at country level with 2019 data. ↩
-
The Gambling sector is a small sector but one that comprises a higher proportion of very high-turnover (£250,000 per annum or more) businesses than other DCMS Sectors (Source: DCMS Economic Estimates: Business Demographics 2019). Due to the small number sampled, the inclusion or exclusion of such high revenue businesses in the survey sample can have a large effect on the estimates of the gambling sector. This is likely to play a role in the year-to-year variation in Gambling figures. ↩