DCMS Sectors Economic Estimates 2019: Business Demographics - Headline Release
Updated 6 May 2022

© Crown copyright 2022
This publication is licensed under the terms of the Open Government Licence v3.0 except where otherwise stated. To view this licence, visit nationalarchives.gov.uk/doc/open-government-licence/version/3 or write to the Information Policy Team, The National Archives, Kew, London TW9 4DU, or email: psi@nationalarchives.gov.uk.
Where we have identified any third party copyright information you will need to obtain permission from the copyright holders concerned.
This publication is available at https://www.gov.uk/government/statistics/dcms-sectors-economic-estimates-2019-business-demographics/dcms-sectors-economic-estimates-2019-business-demographics-headline-release
1. Details
Release date: 14 October 2021
Next release : 2022
Geographic Coverage: United Kingdom and ITL1 regions
Responsible statistician: Wilmah Deda
This release provides estimates of the number, employment, and turnover of businesses within the DCMS sectors (excluding Civil Society[footnote 1]). Data on the number of businesses is rounded to the nearest thousand. When we refer to a national total, this is for the UK non-financial business economy, i.e. we exclude businesses in the financial and insurance sector.
These estimates are not affected by the coronavirus (COVID-19) pandemic in 2020 and the EU Exit transition period as the latest year for which data is reported is 2019.
Definition of Tourism in this release
The definition of Tourism in this release differs to that used in other DCMS Sector Economic Estimates releases, and results should not be directly compared[footnote 2]. In this release we therefore refer to the tourism industries rather than the tourism sector.
2. Headline findings
2.1 Number of businesses
In 2019, there were 645 thousand UK businesses in DCMS sectors (excluding Civil Society), representing 25.6% of the UK non-financial business economy. Of these:
- 303 thousand businesses were in the Tourism Sector (12% of the UK total, an increase of 1.8% in 2018).
- 298 thousand businesses were in the Creative Industries (11.8% of the UK total, an increase of 0.9% in 2018).
- 240 thousand businesses were in the Digital Sector (9.5% of the UK total, an increase of 1.1% in 2018).
- 74 thousand businesses were in the Cultural Sector (2.9% of the UK total, an increase of 1.5% in 2018).
- 40 thousand businesses were in the Sport Sector (1.6% of the UK total, an increase of 1.8% in 2018).
- 8 thousand businesses were in the Telecoms Sector (0.3% of the UK total, an increase of 1.2% in 2018).
- 1 thousand businesses were in the Gambling Sector (0.04% of the UK total, a decrease of 3.7% in 2018).
The number of businesses in the DCMS sectors grew at a slower rate (by 1.3%) between 2018 and 2019 than the UK non-financial business economy (1.6%).
2.2 Size of businesses
Business size can be measured either as the number of employees, or turnover generated. For ease of analysis, the number of employees and turnover generated are grouped into bands. See the technical report for further information.
Size of business by number of employees
In 2019, businesses in the DCMS sectors (excluding Civil Society) followed a similar size distribution to businesses in the wider UK non-financial business economy. The vast majority (88.3%) of businesses in DCMS sectors fell into the micro (0-9) employee band, similar to 89.4% of the UK non-financial business economy (Figure 1, left).
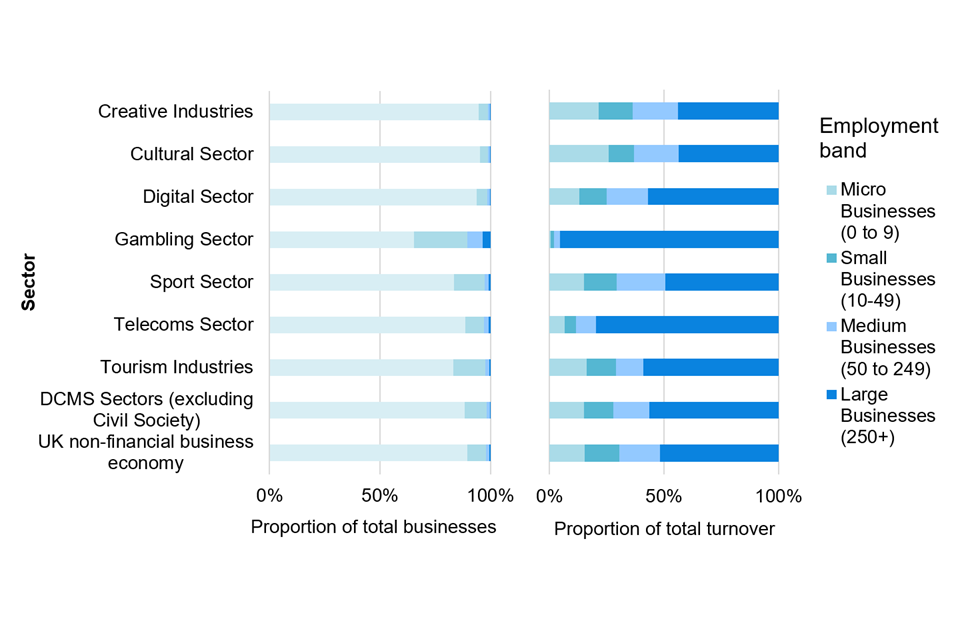
Two stacked bar charts showing the proportion of businesses on the left and the proportion of total turnover on the right by size of business for each DCMS Sector (excluding Civil Society) and the wider UK non-financial business economy for 2019
A large proportion of this turnover was concentrated in a few large firms. In 2019, 56.5% of the turnover generated by businesses in DCMS Sectors was generated by the 0.3% of businesses with 250 or more employees. By comparison, 51.8 % of total turnover in the UK non-financial business economy was generated by the 0.4% of businesses with 250 or more employees.
Size of business by annual turnover
DCMS-sector businesses were slightly more likely to be in a lower turnover band than UK businesses in general (Figure 2). 79% of businesses in DCMS sectors had an annual turnover of less than £250 thousand, compared to 75% of businesses in the UK non-financial business economy.
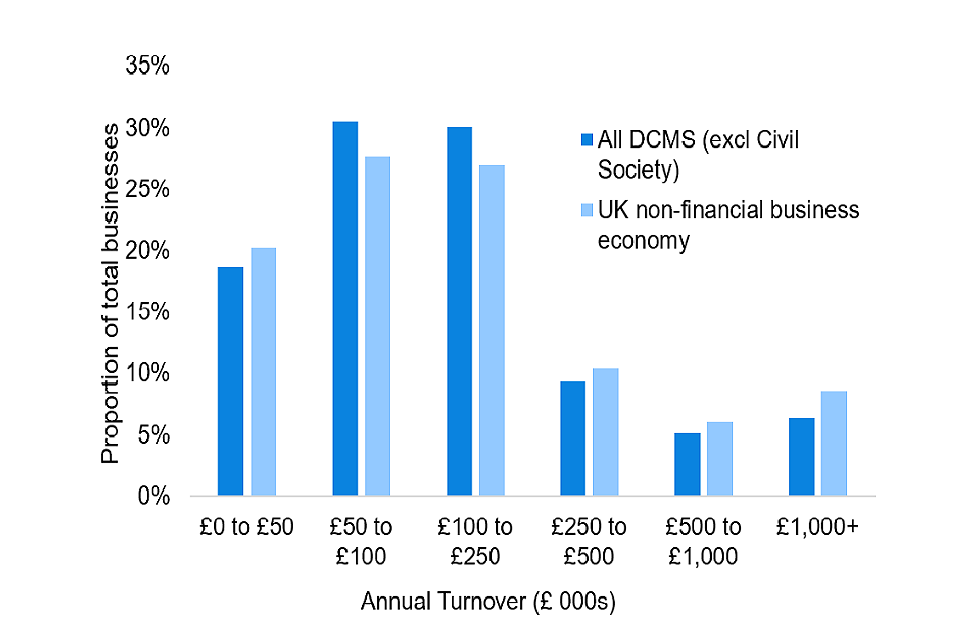
Bar chart showing the proportion of businesses in DCMS Sectors (excluding Civil Society) and the wider UK non-financial business economy by annual turnover bands for 2019
2.3 Regional distribution of business sites in DCMS Sectors
In 2019, of the 736 thousand business sites in DCMS Sectors (excluding Civil Society), almost a quarter (24.6%) were located in London compared to 19.6% of the businesses sites in the UK non-financial business economy. In line with business sites in the wider UK economy, more DCMS sector business sites were located in London than in any other UK region. The exception is for Sport, where 16.2% were located in the South East, compared to 11.5% for London.
Northern Ireland had the lowest number of business sites for both the DCMS sectors and the UK non-financial business economy as a whole, with the region accounting for 1.8% and 2.3% of the national total for DCMS sectors and the UK NFBE, respectively.
Figure 3 below shows the regional distribution of business sites in the UK non-financial business economy and DCMS Sectors (excluding Civil Society) in 2019.
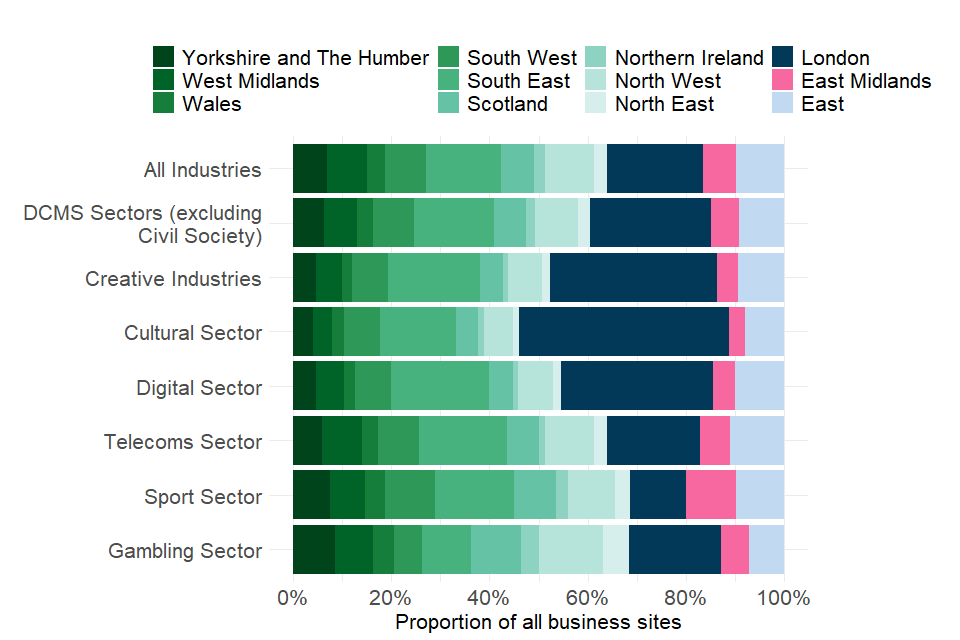
A pecentage stacked bar chart showing the regional distribution of business sites in the UK non-financial business economy and the DCMS Sectors (excluding Civil Society) for 2019
2.4 Businesses by ownership status
In 2019, the vast majority of businesses (97.3%) in DCMS sectors (excluding Civil Society) were UK-owned, with the remaining 2.7% being foreign-owned. This was slightly lower than the wider UK non-financial business economy, where 98.7% of businesses were UK-owned.
The ownership status of a business can be determined by the nationality of its parent. Where control of the business is shared, country of ownership is determined by the country of residence of the majority ultimate owner. Where businesses do not belong to an enterprise group (and are therefore not under the control of another institutional unit) they have been classified as UK-owned.
3. Data
The DCMS Economic Estimates - Business Demographics 2019 publication includes:
- estimates of the number of businesses in DCMS Sectors and sub-sectors by employment and turnover size bands, foreign ownership status and ITL1 regions of the United Kingdom.
- estimates of the number of businesses in the Audio Visual and Computer Games sectors (which do not form part of the DCMS Sector total).
Previous publications have included estimates of the number of enterprises in each DCMS Sector that engage in international trading. These are not included in this year’s release as low response rates mean that detailed industry estimates are likely to be less reliable than previous years. We are exploring options with our data suppliers that might enable us to publish this data in the next DCMS Sectors Economic Estimates 2020: Trade publication in 2022.
The DCMS sectors covered in this release are:
- Creative Industries
- Cultural Sector
- Digital Sector
- Gambling
- Sport
- Telecoms
We also include estimates for the Tourism Industries, which are constructed on a different basis to the tourism sector estimates in our other releases[footnote 2].
The DCMS sectors are not mutually exclusive; industries may contribute to and be classified as more than one sector. Due to these overlaps, summing over the number of businesses in individual sectors would give a total greater than the actual value. When calculating the DCMS sector total, these overlaps are accounted for and businesses are only counted once rather than multiple times.
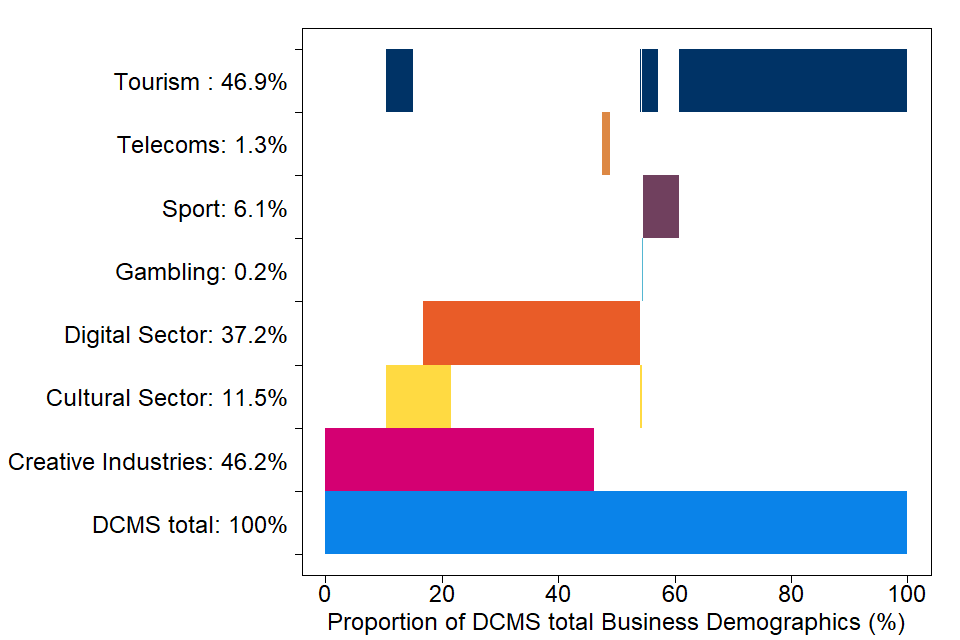
Figure 4: Proportions of DCMS Sector (excluding Civil Society) businesses that are included in multiple sectors, 2019
There is substantial overlap between sectors, and growth in certain sub-sectors can drive these sectors in the same direction. Notably:
- 63.5% of Creative Industries, 40.9% of the Cultural Sector, and all of the Telecoms sector overlap with the Digital Sector.
- 97.5% of the Cultural Sector and 78.9% of the Digital Sector overlap with Creative Industries.
4. Measuring the data
4.1 Data sources, quality and methodology
Information on data sources, sector definitions and how the data were produced is available in the technical report.
The Office for National Statistics (ONS) is the provider of the underlying data used for the analysis presented within this release.
The DCMS Sector Economic Estimates were designated as National Statistics on 26 June 2019. This followed a report by the Office for Statistics Regulation in December 2018 which stated that the series could be designated as National Statistics, subject to meeting certain requirements.
Other organisations, including some of DCMS’ arm’s length bodies, produce alternative economic measures of DCMS sectors. These alternative measures can be found in Table 2 of the technical report.
5. Glossary
5.1 UK non-financial business economy
The UK non-financial business economy accounts for approximately two thirds of the UK economy in terms of Gross Value Added. The industries covered are non-financial services, agriculture, production, communication and distribution industries. See the technical report for further information.
5.2 Turnover
Turnover refers to the value of sales, work done and services rendered by businesses, excluding VAT. This is different to profit or value added and does not take into account business costs. Businesses that generate a lower turnover can be more profitable/productive than businesses with higher turnover.
5.3 Businesses
A business is defined as any Reporting Unit held on the Inter Departmental Business Register (IDBR). A business is held on the IDBR if it is registered for Value Added Tax (VAT) with HM Revenue and Customs (HMRC), registered for a Pay As You Earn (PAYE) scheme with HMRC, or an incorporated business registered at Companies House.
6. Further information
DCMS has developed a suite of Economic Estimates to understand the economic impact its sectors have on the UK economy. Upcoming work in the DCMS Economic Estimates series include:
- Employment
- Earnings of those working in DCMS sectors
- Trade in DCMS Sector businesses
For general enquiries contact: Department for Digital, Culture, Media and Sport, 100 Parliament Street, London, SW1A 2BQ. For media enquiries contact: 020 7211 2210.
DCMS statisticians can also be followed on Twitter via @DCMSInsight.
-
Estimates of the number of businesses in the Civil Society sector are not available in this release. This is because Civil Society organisations are not identifiable in the Annual Business Survey dataset and therefore Business Demographic estimates cannot be produced on the same basis. Previous reports have included data on Charities registered with the Charity Commission of England and Wales, Community Interest Companies (CICs) and Public Service Mutuals which were defined as Civil Society organisations. An update to the Public Services Mutuals report is not available as the report has been discontinued. ↩
-
In the majority of the DCMS Economic Estimates publications the estimates of Tourism are based on results from the Tourism Satellite Account, which estimates the direct economic impact of tourism (or tourists) on the economy as a proportion of each standard industrial class. The Tourism Satellite Account produces estimates of the number of enterprises in the Tourism sector, however these estimates do not provide any further business demography information for use in this release. The figures in this release are therefore based on a “tourism industries” approach, which counts any establishment for which the principal activity is a tourism characteristic activity, i.e. it includes 100% of the businesses in a subset of the standard industrial classes. As such, the estimates for the Tourism industries in this release are larger than they might otherwise have been under a satellite account approach and therefore account for a greater proportion of the DCMS sector total than in other Economic Estimates publications. ↩ ↩2