DCMS Sectors Economic Estimates: Regional Gross Value Added 2020
Updated 3 July 2025

© Crown copyright 2025
This publication is licensed under the terms of the Open Government Licence v3.0 except where otherwise stated. To view this licence, visit nationalarchives.gov.uk/doc/open-government-licence/version/3 or write to the Information Policy Team, The National Archives, Kew, London TW9 4DU, or email: psi@nationalarchives.gov.uk.
Where we have identified any third party copyright information you will need to obtain permission from the copyright holders concerned.
This publication is available at https://www.gov.uk/government/statistics/dcms-and-the-digital-sector-economic-estimates-regional-gva/dcms-sectors-economic-estimates-regional-gross-value-added-2020
1. Introduction
Release date: 19 July 2023
Next release: 2024
Geographic coverage: United Kingdom, Regions
Time coverage: 2010 to 2020
Responsible analyst: Rachel Moyce
This release provides estimates of the contribution of included DCMS Sectors to the UK economy from 2010 to 2020, measured by gross value added (GVA), for the UK regions. The results for 2020 are affected by the coronavirus (COVID-19) pandemic.
We use current prices to report current sector estimates and chained volume measures for any comparisons over time.
The Digital Sector is no longer included in these statistics, as responsibility for this sector now lies with the Department for Science, Innovation and Technology (DSIT). Estimates of Digital Sector regional GVA are published separately alongside the DCMS estimates.
Monthly and annual estimates of GVA for the DCMS Sectors are also available.
2. Regional GVA in Included DCMS sectors (Creative Industries, Cultural, Sport and Gambling Sectors)
The majority of included DCMS Sector GVA was generated in London and the South East in 2020, and has become more concentrated in London since 2010. Included DCMS sectors also formed a larger proportion of the local economies of these regions. Included DCMS sector GVA fell in all regions between 2019 and 2020, during the pandemic, but in the longer term, since 2010, GVA grew in all regions.
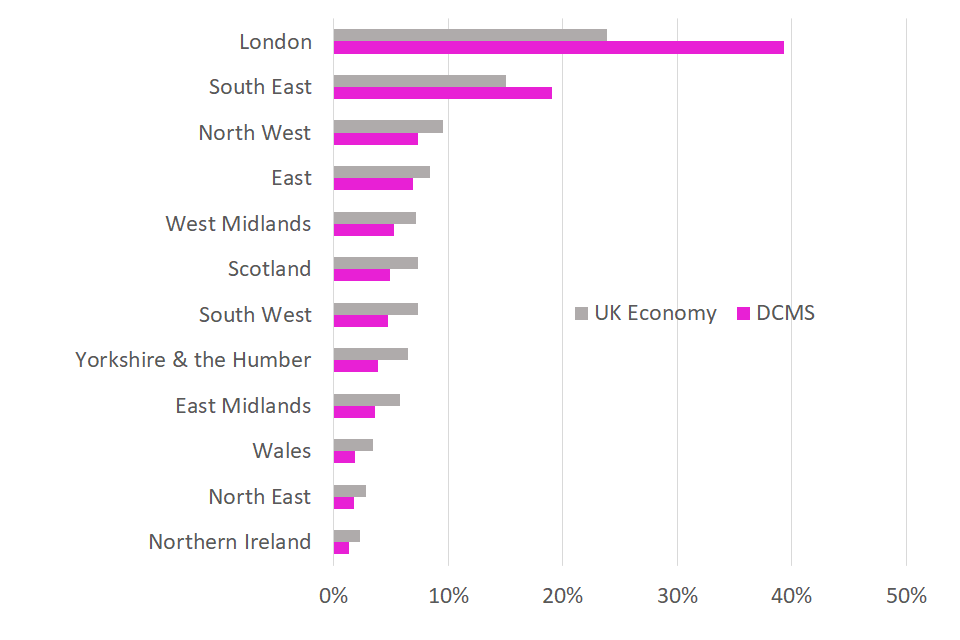
- The majority of included DCMS Sector GVA in the UK (£123.0 billion, 6.5% of UK GVA in 2020) was generated in London and the South East, which contributed 39.3% and 19.1% respectively of included DCMS Sector GVA in the UK in 2020.
- There was a similar pattern in UK GVA, where London (23.9%) and the South East (15.0%) were the greatest contributors, however London and the South East were overrepresented in included DCMS Sector GVA compared to the UK economy as a whole.
Figure 1 Included DCMS Sector and UK GVA by region, 2020 (£bn)
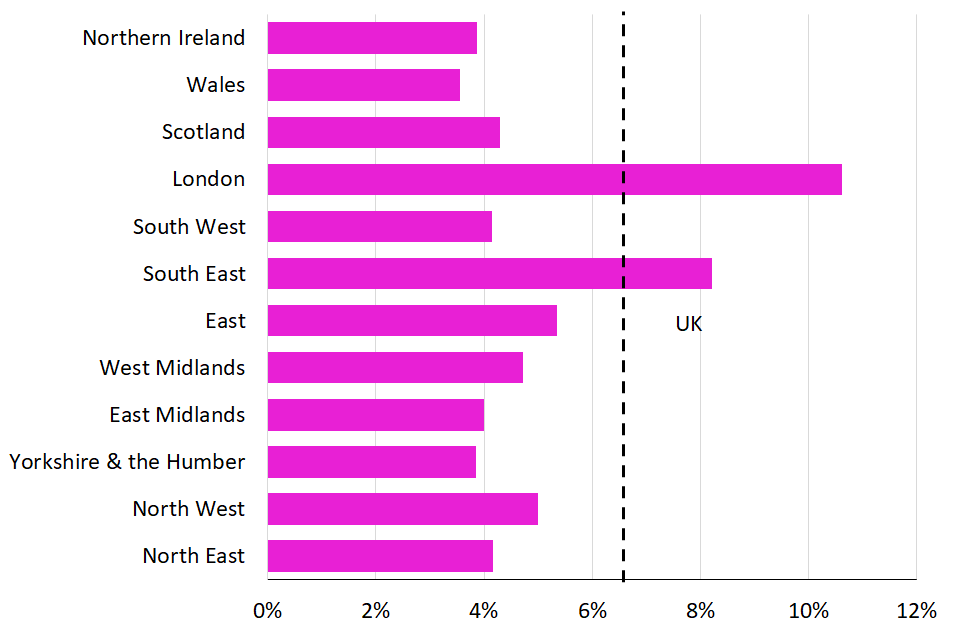
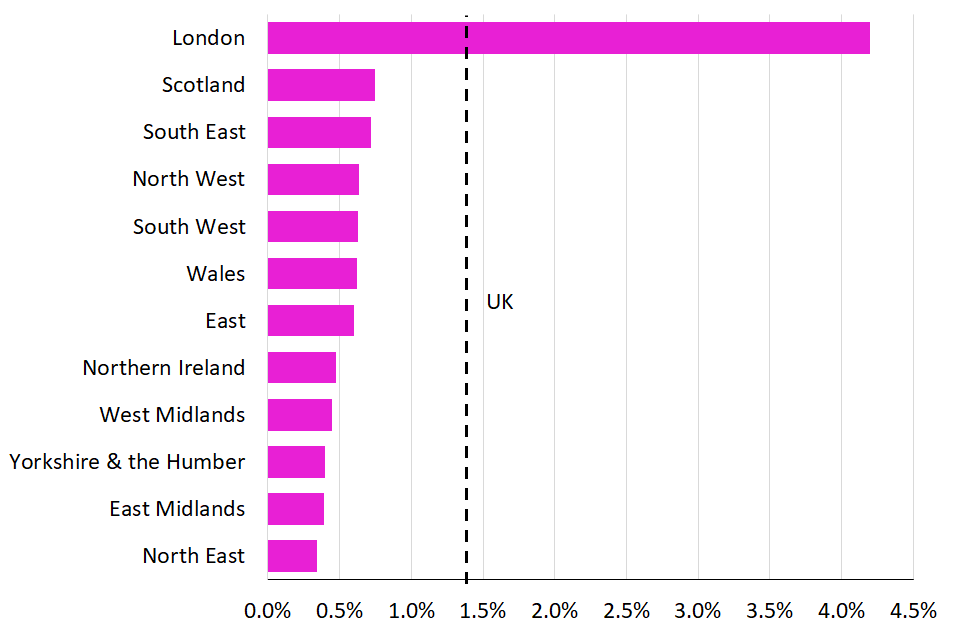
- Another way to look at regional GVA is to consider the contribution of included DCMS Sectors to regional economies. The largest regional contributions to the local economy by included DCMS sectors were also in London and the South East, where the sectors contributed 10.6% and 8.2% of regional GVA respectively. This is a similar pattern to both 2010 and 2019.
- Included DCMS Sectors contributed least to the regional economy in Wales and Yorkshire & the Humber, where it accounts for 3.6% and 3.8% of regional GVA respectively.
Figure 2. Contribution of Included DCMS sectors to regional economies as a percentage
The following findings report the real-terms growth. All GVA figures that follow are in chained volume measures and adjusted for inflation.
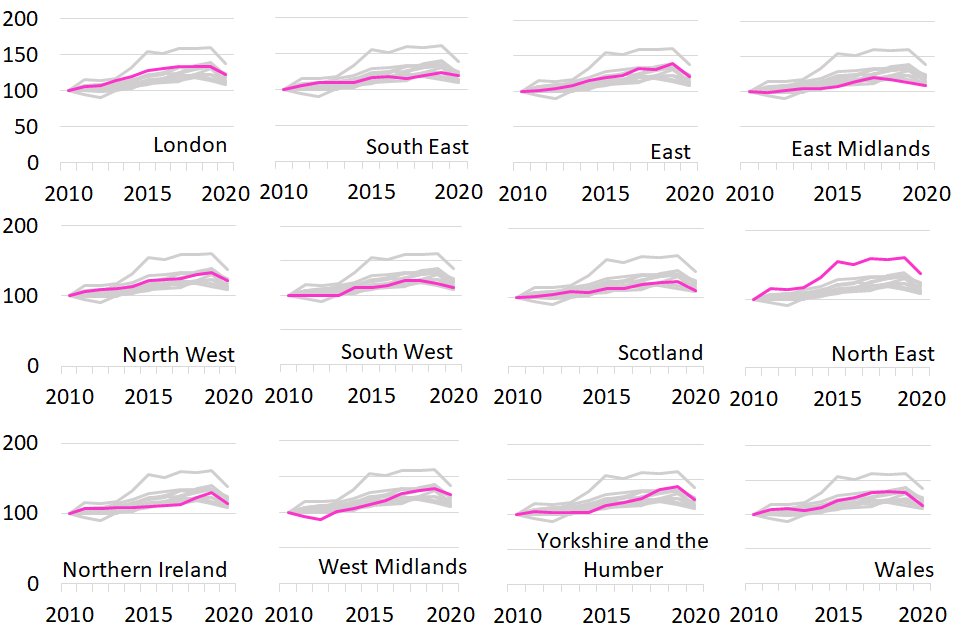
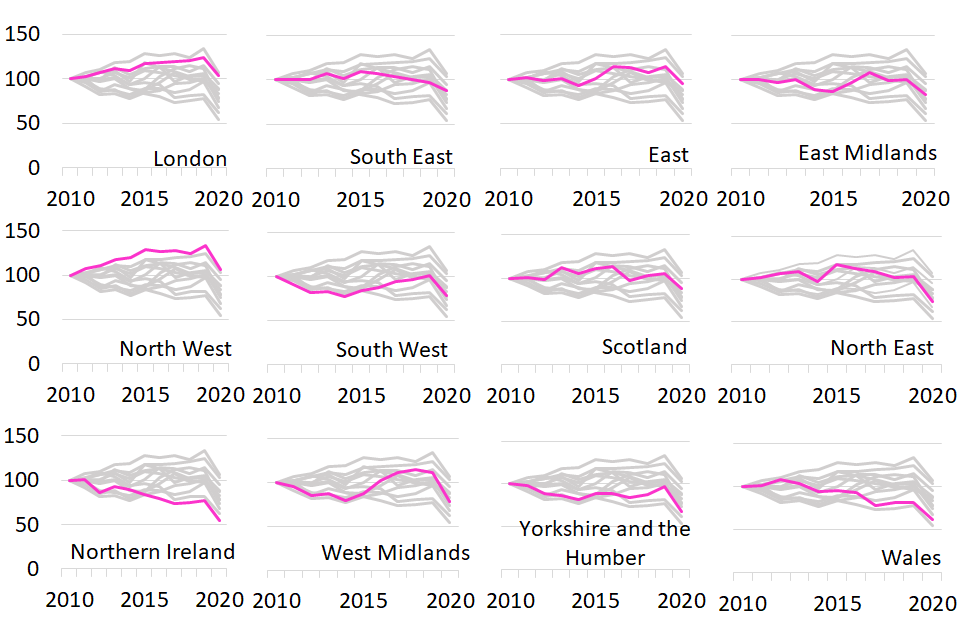
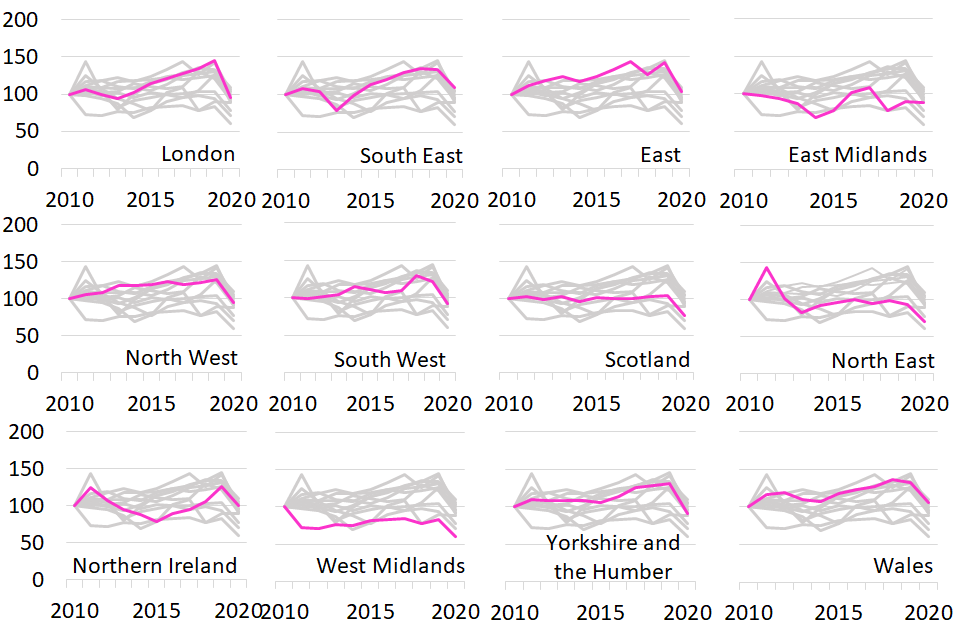
- Included DCMS Sector GVA fell in all regions from 2019 to 2020, when pandemic restrictions were in place for much of the year. The largest absolute falls were in London and the East, at £4.7bn and £1.2bn respectively. In relative terms, the largest drops in regional GVA in included DCMS sectors were in Wales (-14.1%) and the North East (-14.0%).
- From 2010 to 2019 (pre-pandemic), included DCMS Sector GVA grew in all regions, with the largest percentage growth in the North East, at 60.4%. The largest absolute growth was in London, at £13.1bn increase (34.1%) and the South East, at £4.4bn increase (22.7%), and these two regions contributed more than half of the increase in total included DCMS Sector GVA in the UK.
Figure 3. Index of regional growth in included DCMS sectors, 2010 to 2020
2010 = 100
The regional distribution and growth varies across the individual sectors, as described in the following sections.
The following information is worth noting:
- These figures do not include Tourism or Civil Society as these are defined in a different way. Sectors included in this release are Creative Industries, Cultural Sector, Gambling, and Sport.
2.1 Sector overlap
Some industries are found within multiple sectors and are likely to drive trends in the same way for both sectors.
For example, in 2020:
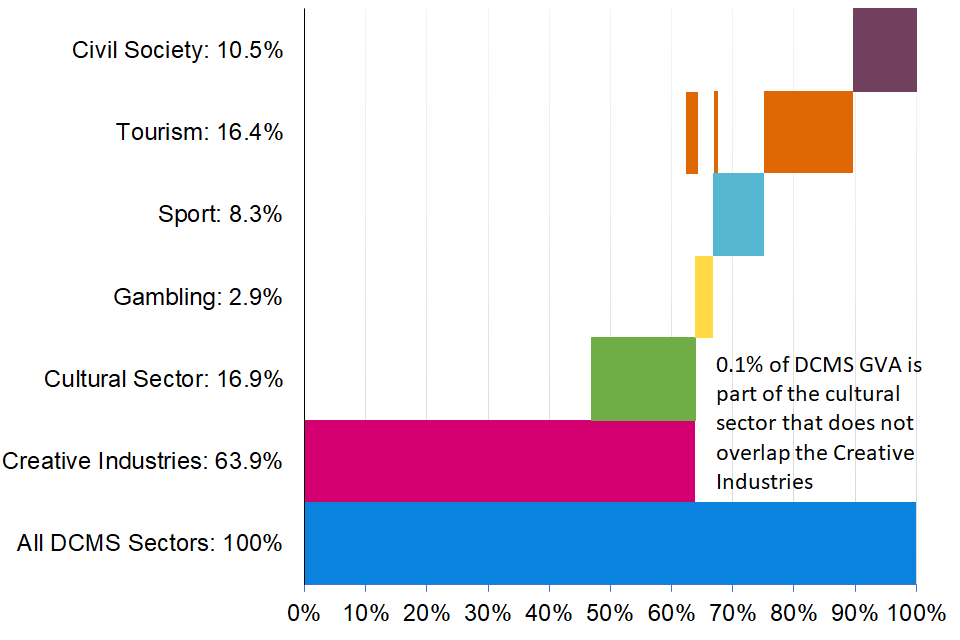
- 63.9% of the DCMS Sector GVA is within the Creative Industries
- 16.9% of DCMS Sector GVA is within the Cultural Sector
- However, 16.9% of DCMS Sector GVA is within both the Creative Industries and the Cultural Sector. This illustrates that the Cultural Sectors is almost fully contained within the Creative Industries (but not vice versa) and these overlaps include activities such as performing arts and radio and television broadcasting.
When calculating the DCMS Sector total, the GVA from industries within the overlap is counted once. Users should be aware that the estimate for ‘All DCMS Sectors’ is therefore lower than the sum of the individual sectors.
This overlap between DCMS sectors is illustrated in Figure 4.
Whilst sectors can overlap, we have defined subsectors within a sector that are mutually exclusive. Subsector information is provided for Creative Industries and the Cultural Sector.
Figure 4. GVA and overlaps in DCMS Sectors, 2020
For more information, the technical report visually outlines the overlap between SIC codes in DCMS sectors, but not the value of GVA within these overlaps.
3. Creative Industries
The majority of Creative Industries GVA was generated in London and the South East in 2020, and has become more concentrated in London since 2010. The sector also formed a larger proportion of the local economies of these regions. Drops in Creative Industries GVA from 2019 to 2020, during the pandemic, and growth prior to the pandemic, were driven by London and the South East.
- Total UK GVA by the Creative Industries in 2020 was £103.8 billion, 5.5% of UK GVA.
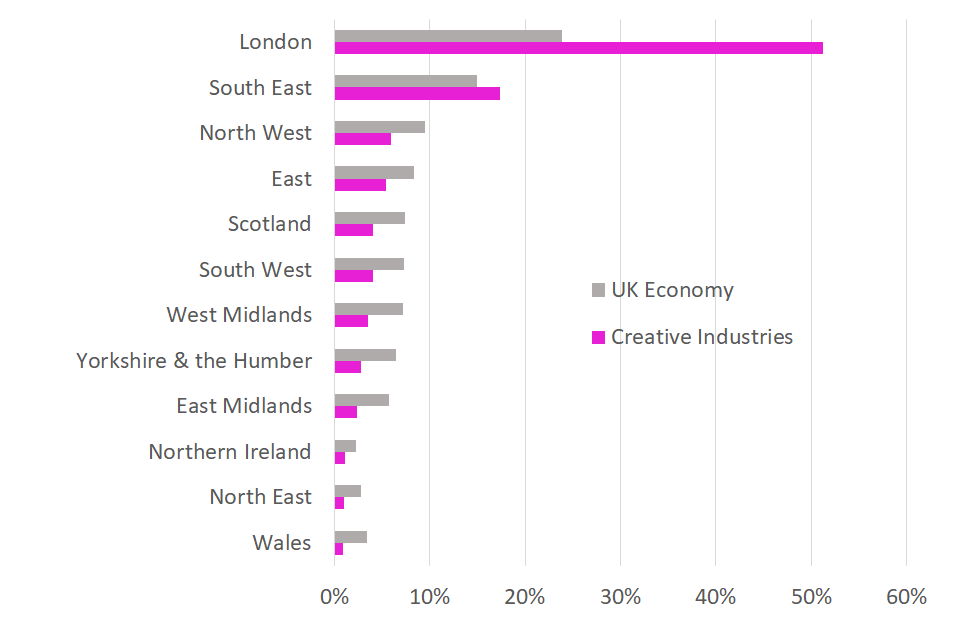
- The majority of GVA in the Creative Industries in 2020 was generated in London (51.3%) and the South East (17.4%). The proportion of Creative Industries GVA generated in London was more than twice that of UK overall GVA (23.9%).
- From 2010 to 2020, GVA became more concentrated in London, increasing from 47.2% of UK Creative Industries GVA to 51.3%.
Figure 5: Regional Distribution of GVA in the Creative Industries and the whole UK economy in 2020
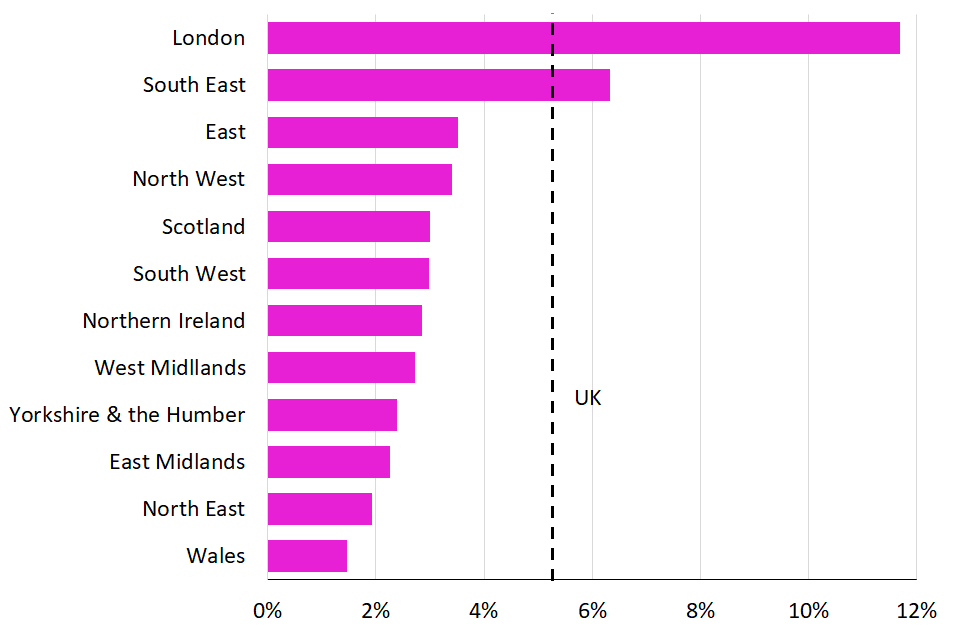
- Another way to look at regional GVA is to consider the contribution of Creative Industries to regional economies. The largest regional contributions to the local economy by Creative Industries were also in London and the South East, where the sector contributed 11.7% and 6.3% of regional GVA respectively. This is a similar pattern to both 2010 and 2019, when Creative Industries contributed 10.2% and 11.3% of the regional economy in London, and 5.9% and 5.6% in the South East.
- Creative Industries contributed least to the regional economy in Wales and the North East, where it accounts for 1.5% and 1.9% of regional GVA respectively.
Figure 6. Contribution of Creative Industries to regional economies as a percentage
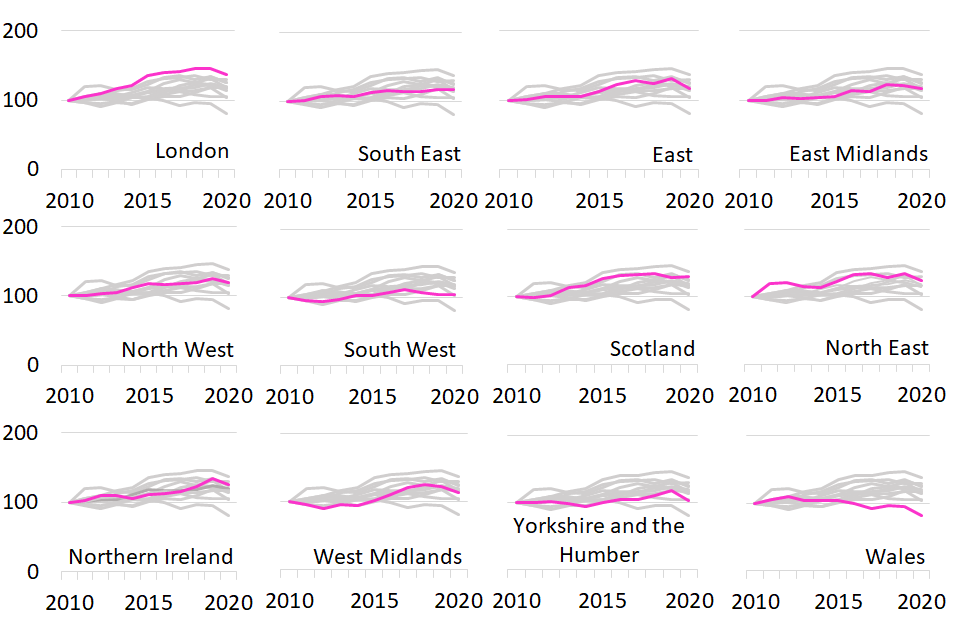
- GVA by the Creative Industries fell in most regions from 2019 to 2020 (during the pandemic).However, it remained at similar levels to 2019 in Scotland (+0.2%) and the South West (+0.1%), using GVA adjusted for inflation.
- In the longer term, Creative Industries GVA grew in all regions except Wales (-18.8%) from 2010 to 2020.
Figure 7. Index of regional growth in the Creative Industries, 2010 to 2020
2010 = 100
4. Cultural Sector
The majority of Cultural Sector GVA was generated in London, and has become more concentrated in London since 2010. The sector also formed a larger proportion of the regional economy in London. Drops in Cultural Sector GVA from 2019 to 2020, during the pandemic, and growth prior to the pandemic, were driven by London.
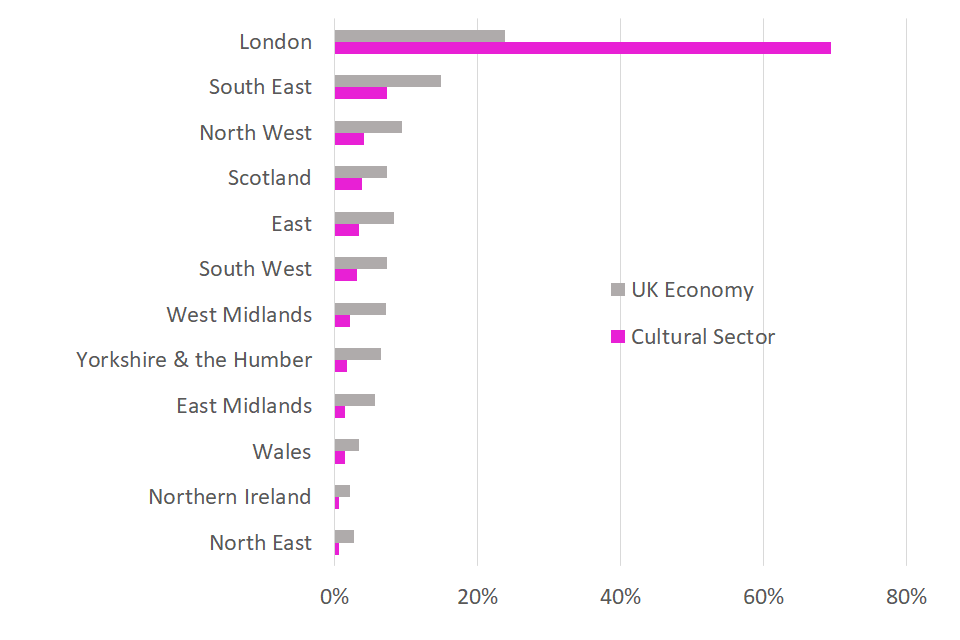
- Total UK GVA by the Cultural Sector in 2020 was £27.5 billion, 1.4% of UK GVA.
- Compared to the regional distribution of GVA for the whole UK economy, London contributed far more to the Cultural Sector GVA, at more than two thirds of the Cultural Sector total (69.5%).
- The regional distribution was similar in 2010 and 2019, with GVA becoming more concentrated in London since 2010, when the region accounted for 65.5% of Cultural Sector GVA.
Figure 8: Regional Distribution of GVA in the Cultural Sector and the whole UK economy in 2020
- Another way of looking at this is that the contribution of the Cultural Sector to the regional economy in London was much higher than the contribution to the UK economy overall. The largest regional contribution to the local economy by the Cultural Sector was in London at 4.2%, followed by the South East and Scotland, where the sector contributed 0.7% of regional GVA. This is a similar pattern to both 2010 and 2019, although in most regions the Cultural Sector contributed a smaller proportion of the regional economy in 2020 than in 2010 and 2019.
- The Cultural Sector contributed least to the regional economy in the North East, where it accounted for 0.3% of GVA.
Figure 9. Contribution of the Cultural Sector to regional economies as a percentage
The following findings report the real-terms growth. All GVA figures that follow are in chained volume measures and adjusted for inflation.
- GVA by the Cultural Sector fell in all regions from 2019 to 2020, during the pandemic. In relative terms, the largest changes from 2019 to 2020 were in Yorkshire & the Humber (-30.3%), the West Midlands (-30.1%) and Northern Ireland (-30.1%).
- In the longer term, from 2010 to 2020, Cultural Sector GVA fell in most regions, largely due to the declines from 2019 to 2020 during the pandemic. In the North West and London, Cultural Sector GVA grew over this period, by 6.8% and 3.1% respectively.
Figure 10. Index of regional growth in the Cultural Sector, 2010 to 2020
2010 = 100
5. Sport Sector
The largest regional contributions to Sport Sector GVA were from the South East and London, and contributions were more evenly spread across regions than included DCMS sector GVA in 2020. The sector contributed to all of the regional economies in similar proportions. The drop in Sport Sector GVA from 2019 to 2020, during the pandemic, and growth prior to the pandemic, were driven by London, which makes up a larger absolute contribution to the sector’s GVA.
- Total UK GVA by the Sport Sector in 2020 was £13.6 billion, 0.7% of UK GVA.
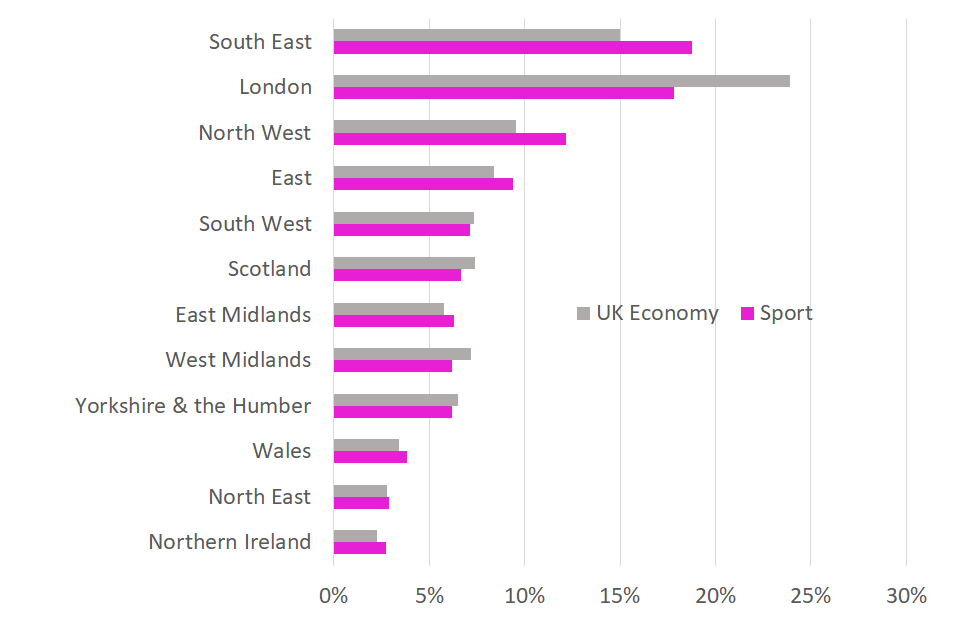
- GVA in the Sport Sector in 2020 was more spread across regions than the UK economy as a whole, though still concentrated in London (17.8%) and the South East (18.7%). Significant contributions to Sport GVA also came from the North West (12.2%) and the East (9.4%), both at higher levels than to the UK economy as a whole (9.5% and 8.4% respectively).
- The regional distribution in 2010 and 2019 was similar for most of the regions, while the largest contribution shifted from London to the South East from 2019 to 2020, during the pandemic.
Figure 11: Regional Distribution of GVA in the Sport Sector and the whole UK economy in 2020
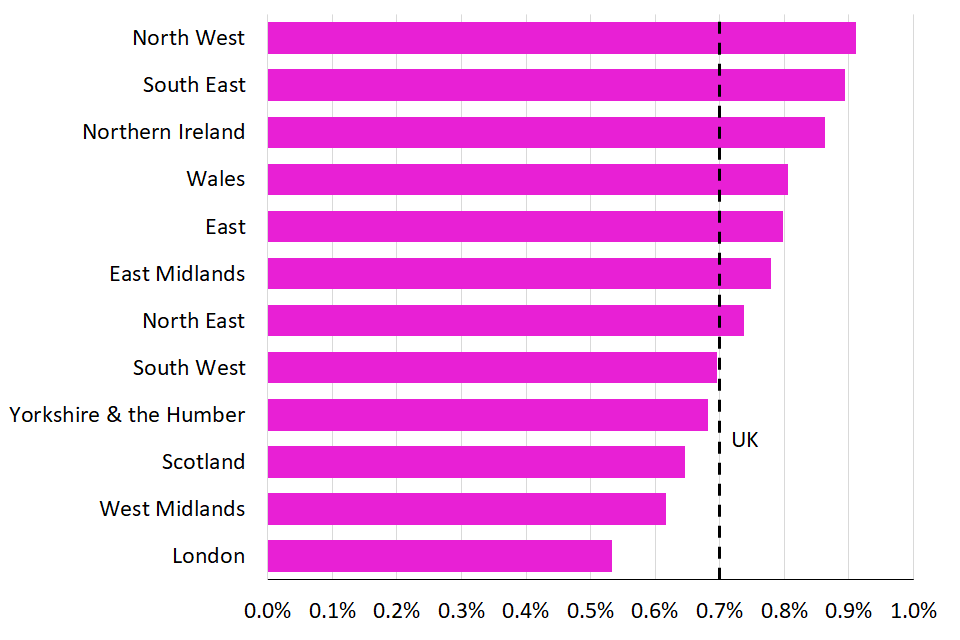
- Another way of looking at this is that the contribution of the Sport Sector to the regional economies in London and the South East was lower than the contribution to the UK economy as a whole.
- The largest regional contributions to the local economy by the Sport Sector were the South East, North West and Northern Ireland at 0.9%, while the lowest was London, where the sector contributed 0.5% of regional GVA. All regions showed similar contributions to regional GVA in 2020, and this was also true in 2010 and 2019, although the proportions in these years were in general slightly higher.
Figure 12. Contribution of the Sport Sector to regional economies as a percentage
The following findings report the real-terms growth. All GVA figures that follow are in chained volume measures and adjusted for inflation.
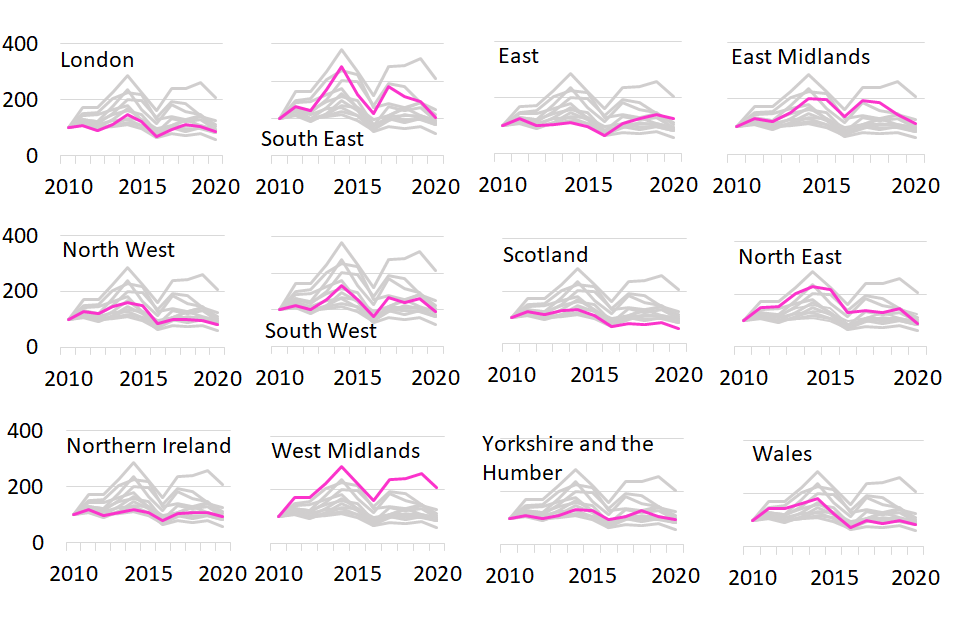
- GVA by the Sport Sector fell in all regions from 2019 to 2020, during the pandemic. In relative terms, the largest changes from 2019 to 2020 were in London (-33.9%), and Yorkshire & the Humber (-30.6%).
- In the longer term, Sport Sector GVA fell in most regions from 2010 to 2020, in most of these largely due to the declines from 2019 to 2020 during the pandemic. The South East (9.2%), Wales (5.5%) and the East (3.5%) grew over this period.
Figure 13. Index of regional growth in the Sport Sector, 2010 to 2020
2010 = 100
6. Gambling Sector
The largest regional contributions to Gambling Sector GVA were the East, London and the West Midlands, and contributions were more evenly spread across regions than included DCMS sector GVA in 2020. The sector contributed to all of the regional economies in similar proportions. The drop in Gambling Sector GVA from 2019 to 2020, during the pandemic, was across the regions, while growth prior to the pandemic was driven by the West Midlands and the East.
- Total UK GVA by the Gambling Sector in 2020 was £4.8 billion, 0.3% of UK GVA.
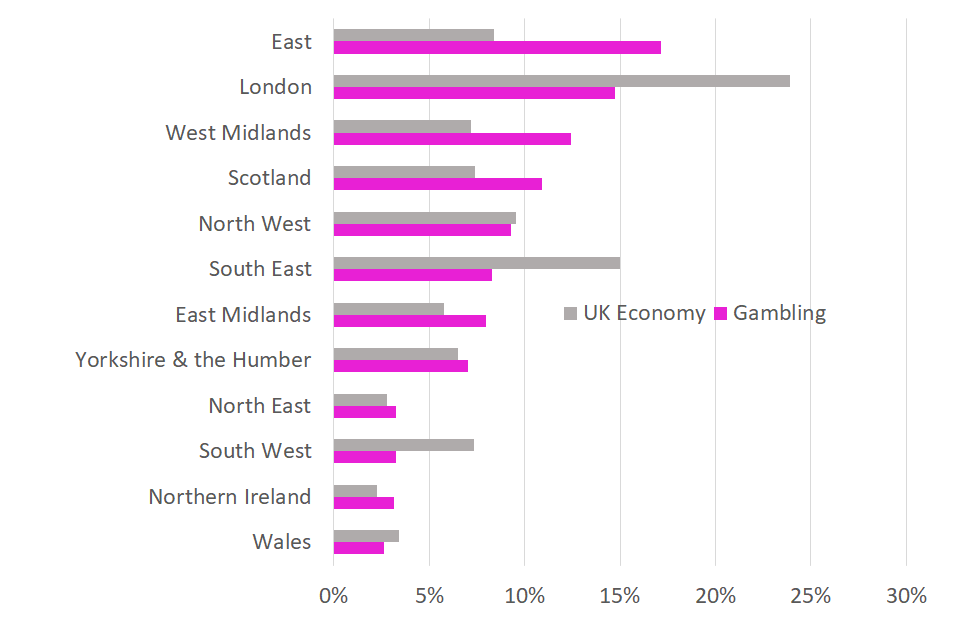
- The regions contributing most to Gambling GVA were the East (17.1%), London (14.8%) and the West Midlands (12.4%).
- Compared to the regional distribution of GVA for the whole UK economy, London and the South East contributed less to Gambling Sector GVA, while the West Midlands, East and Scotland contributed more.
- The regional distribution in 2020 was similar to 2019 and somewhat different to that in 2010, with the West Midlands in particular increasing its contribution from 5.9% in 2010 to 12.4% in 2020.
Figure 14: Regional Distribution of GVA in the Gambling Sector and the whole UK economy in 2020
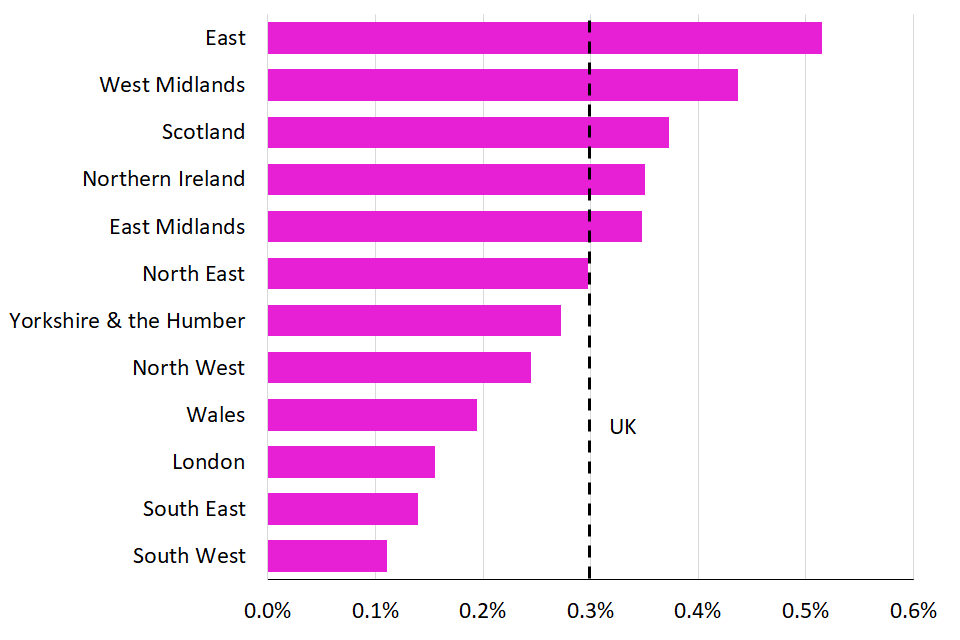
- Another way of looking at this is that the contribution of the Gambling Sector to the regional economies in London and the South East was lower than the contribution to the UK economy as a whole, and higher in other regions.
- The largest regional contributions to the local economy by the Gambling Sector were the East at 0.5%, and the West Midlands, Scotland and Northern Ireland at 0.4%. Contributions to regional economies have not changed markedly since 2010, although in some regions the contribution has increased.
Figure 15. Contribution of the Gambling Sector to regional economies as a percentage
The following findings report the real-terms growth. All GVA figures that follow are in chained volume measures and adjusted for inflation.
- GVA by the Gambling Sector fell in all regions from 2019 to 2020, during the pandemic. In relative terms, the largest changes from 2019 to 2020 were in the North East (-38.2%), and South East (-29.3%).
- From 2010 to 2020, Gambling Sector GVA fell in most regions, largely due to falls from 2019 to 2020, however in some regions Gambling GVA grew, particularly the West Midlands (+106.5%) and the East (+24.7%)
Figure 16. Index of regional growth in the Gambling Sector, 2010 to 2020
2010 = 100
7. Further information
GVA is a measure of the increase in the value of the economy due to the production of goods and services. Its relationship to GDP is as follows:
GVA = GDP + Subsidies - Taxes
GVA is measured either at:
- current basic prices (‘nominal GVA’), which give the best ‘instantaneous’ measure of the value to the economy, but are not adjusted for the effect of inflation.
- chained volume measures (‘real terms GVA’), where the effect of inflation is removed.
The accompanying data tables consist of current prices and chained volume measures for DCMS sectors and subsectors from 2010 to 2020.
We use current prices to report current sector estimates and chained volume measures for any comparisons over time.
The DCMS sectors covered in this report are:
- Creative Industries
- Cultural Sector
- Gambling
- Sport
Following changes announced in February 2023, figures for the Digital Sector and Telecoms are presented separately, as responsibility for these policy areas now sits with the Department for Science, Innovation and Technology (DSIT).
Methodological information on the sector definitions, data sources, derivation of GVA and limitations of the approach can now be found in the accompanying technical report, along with. a summary of alternative economic measures of these sectors that are published elsewhere.
The Economic Estimates: GVA (gross value added) for DCMS Sectors and the Digital Sector, 2020 are badged as National Statistics. This affirms that the statistics have met the requirements of the Code of Practice for Statistics.
DCMS has developed a suite of economic estimates to understand the economic impact its sectors have on the UK economy. In combination with other economic indicators, GVA estimates help build a comprehensive picture of the UK economy, and of the DCMS Sectors’ importance within it.
The responsible statistician for this release is Rachel Moyce. For enquiries on this release, please email evidence@dcms.gov.uk.
For general enquiries contact:
Department for Culture, Media and Sport
100 Parliament Street
London
SW1A 2BQ
For media enquiries contact: 020 7211 2210.
DCMS statisticians can also be followed on Twitter via @DCMSInsight.