Cyber security breaches survey 2023
Published 19 April 2023

© Crown copyright 2023
This publication is licensed under the terms of the Open Government Licence v3.0 except where otherwise stated. To view this licence, visit nationalarchives.gov.uk/doc/open-government-licence/version/3 or write to the Information Policy Team, The National Archives, Kew, London TW9 4DU, or email: psi@nationalarchives.gov.uk.
Where we have identified any third party copyright information you will need to obtain permission from the copyright holders concerned.
This publication is available at https://www.gov.uk/government/statistics/cyber-security-breaches-survey-2023/cyber-security-breaches-survey-2023
The Cyber Security Breaches Survey is a research study for UK cyber resilience, aligning with the National Cyber Strategy. It is primarily used to inform government policy on cyber security, making the UK cyberspace a secure place to do business. The study explores the policies, processes and approach to cyber security for businesses, charities, and educational institutions. It also considers the different cyber attacks and cyber crimes these organisations face, as well as how these organisations are impacted and respond.
For this latest release, the quantitative survey was carried out in winter 2022/23 and the qualitative element in early 2023.
Responsible analyst:
Emma Johns
Responsible statistician:
Maddy Ell
Statistical enquiries:
Summary
Identification of cyber security breaches and attacks
Cyber security breaches and attacks remain a common threat. However, smaller organisations are identifying them less than last year. This may reflect that senior managers in smaller organisations view cyber security as less of a priority in the current economic climate than in previous years, so are undertaking less monitoring and logging of breaches or attacks.
-
32% of businesses and 24% of charities overall recall any breaches or attacks from the last 12 months. This is much higher for medium businesses (59%), large businesses (69%) and high-income charities with £500,000 or more in annual income (56%).
-
This is a decrease from 39% of businesses and 30% of charities in 2022. The drop is driven by smaller organisations – the results for medium and large businesses, and high-income charities, remain at similar levels to last year.
-
Among those identifying any breaches or attacks, we estimate that the single most disruptive breach from the last 12 months cost each business, of any size, an average of approximately £1,100. For medium and large businesses, this was approximately £4,960. For charities, it was approximately £530.
-
The proportion of micro businesses saying cyber security is a high priority has decreased from 80% in 2022 to 68% this year. Qualitative evidence suggests that cyber security has dropped down the priority lists for these smaller organisations, relative to wider economic concerns like inflation and uncertainty.
Cyber hygiene
The most common cyber threats are relatively unsophisticated, so government guidance advises businesses and charities to protect themselves using a set of “cyber hygiene” measures. A majority of businesses and charities have a broad range of these measures in place. The most common are updated malware protection, cloud back-ups, passwords, restricted admin rights and network firewalls – each administered by two-thirds or more of businesses and half or more charities. However, across the last three waves of the survey, some areas of cyber hygiene have seen consistent declines among businesses. This includes:
-
use of password policies (79% in 2021, vs. 70% in 2023)
-
use of network firewalls (78% in 2021 vs. 66% in 2023)
-
restricting admin rights (75% in 2021, vs. 67% in 2023)
-
policies to apply software security updates within 14 days (43% in 2021, vs. 31% in 2023).
These trends mainly reflect shifts in the micro business population and, to a lesser extent, small and medium businesses – large business results have not changed.
Risk management and supply chains
A larger proportion of businesses take actions to identify cyber risks than charities. Larger businesses are the most advanced in this regard. For the first time, the majority of large businesses are reviewing supply chain risks, although this is still relatively rare across organisations overall.
-
Three in ten businesses have undertaken cyber security risk assessments (29%, vs. 27% of charities) in the last year – rising to 51% of medium businesses and 63% of large businesses.
-
A similar proportion of businesses deployed security monitoring tools (30%, vs. 19% of charities) – rising to 53% of medium businesses and 72% of large businesses.
-
Under four in ten businesses (37%) and a third of charities (33%) report being insured against cyber security risks – rising to 63% of medium businesses and 55% of large businesses (i.e. cyber insurance is more common in medium businesses than large ones).
-
Just over one in ten businesses say they review the risks posed by their immediate suppliers (13%, vs. 11% of charities). More medium businesses (27%) and large businesses (55%) review immediate supplier risks. The latter result is up from 44% of large businesses in 2022.
-
Qualitative data suggests that receiving messaging around supply chain risks from bodies such as the National Cyber Security Centre (NCSC), or having the topic raised in audits, helps encourage organisations to take action in this area.
Board engagement and corporate governance
Board engagement and corporate governance approaches towards cyber security tend to be more sophisticated in larger organisations, although corporate reporting of cyber risks remains relatively uncommon, even among large businesses.
-
Three in ten businesses (30%) and charities (31%) have board members or trustees explicitly responsible for cyber security as part of their job role – rising to 41% of medium businesses and 53% of large businesses.
-
21% of medium businesses and 30% of large businesses have heard of the NCSC’s Board Toolkit – rising from 11% and 22% respectively in 2020 (when it was introduced).
-
49% of medium businesses, 68% of large businesses and 36% of high-income charities have a formal cyber security strategy in place. Qualitative data suggests the impetus to develop strategies can come from management board pressure, audits and business acquisition. It can also coincide with cyber teams gaining operational independence, for example from IT departments.
-
In the last year, 16% of corporate annual reports across medium businesses covered cyber risks, rising to 33% of the reports published by large businesses. Across charities (of all income groups), 9% of these reports covered cyber risks.
-
Qualitative data shows a similar set of issues to previous years that prevent boards from engaging more in cyber security, including a lack of knowledge, training and time. It also highlights the importance of people in cyber roles being able to write persuasive business cases for cyber security spending, especially when they report directly to finance leads.
Cyber accreditations and following guidance
The proportion of organisations seeking external information or guidance on cyber security remains stable, at almost half. However, this means that a sizeable proportion of organisations, including larger organisations, continue to be unaware of government guidance such as the 10 Steps to Cyber Security, and the government-endorsed Cyber Essentials standard. Linked to this, relatively few organisations at present are adhering to recognised standards or accreditations, such as Cyber Essentials or ISO 27001.
-
49% of businesses and 44% of charities report seeking information or guidance on cyber security from outside their organisation in the past year, most commonly from external cyber security consultants, IT consultants or IT service providers.
-
14% of businesses and 19% of charities are aware of the 10 Steps guidance – rising to 32% of medium businesses and 44% of large businesses. Nevertheless, around two-fifths of businesses (37%) and three in ten charities (30%) have taken action on 5 or more of the 10 Steps. This is much more common in medium businesses (75%) and large businesses (89%). Just 2% of businesses and charities have enacted all 10 Steps, increasing to 7% of medium businesses and 20% of large businesses.
-
14% of businesses and 15% of charities are aware of the Cyber Essentials scheme – rising to 50% of medium businesses and 59% of large businesses.
-
A total of 9% of businesses and 5% of charities report adhering to ISO 27001. This is again higher among large businesses (27%).
-
Qualitative findings suggest the desire to seek external accreditation can be because clients demand it. It can also be a convenient way for organisations to generate a standardised set of documentation on their cyber security standards, or to enforce or speed up a positive change in their staff culture.
Incident response
While a large majority of organisations say that they will take several actions following a cyber incident, in reality a minority have agreed processes already in place to support this. This highlights an area for ongoing improvement for the study to continue monitoring next year.
-
The most common processes, mentioned by between a quarter and two-fifths of businesses and charities, are having specific roles and responsibilities assigned to individuals, having guidance on external reporting, and guidance on internal reporting.
-
Formal incident response plans are not widespread (21% of businesses and 16% of charities have them). This rises to 47% of medium-sized businesses, 64% of large businesses and 38% of high-income charities.
-
Qualitative findings suggest another area for potential improvement is the relative disconnect between IT or specialist cyber teams and wider staff (including management boards) when it comes to incident response. Bridging this gap was felt to require good, regular communication between IT teams and wider staff. Post-incident reviews were also seen as a way to engage wider staff in cyber security.
Cyber crime
Some cyber security breaches and attacks do not constitute cyber crimes under the Computer Misuse Act 1990 and the Home Office Counting Rules. New questions were added this year to establish the extent to which the breaches or attacks that organisations experience could be defined as cyber crimes committed against them, using the principles in the Home Office Counting Rules. Further new questions explored the extent of fraud that occurred as a result of cyber crime. More detail about definitions of cyber crime and the rationale for expanding the survey in this way can be found in Chapter 6.
As this is the first year these questions have been asked and there is no baseline for comparison, users should be relatively cautious when interpreting these statistics.
The findings show that cyber crime is more prevalent among larger organisations, although this may be a sign of underreporting among smaller organisations.
-
A total of 11% of businesses and 8% of charities have experienced cyber crime in the last 12 months, rising to 26% of medium businesses, 37% of large businesses and 25% of high-income charities. Looked at another way, among the 32% businesses and 24% of charities identifying any cyber security breaches or attacks, around a third (34% for businesses and 32% for charities) ended up being victims of cyber crime.
-
Separately, a total of 3% of businesses and 1% of charities have been victims of fraud as a result of cyber crime. This accounts for 9% of the businesses and 6% of the charities that identify any cyber security breaches or attacks.
-
We estimate that, across all UK businesses, there were approximately 2.39 million instances of cyber crime and approximately 49,000 instances of fraud as a result of cyber crime in the last 12 months. Across charities, there were approximately 785,000 cyber crimes over this period. The sample sizes do not allow us to estimate the scale of fraud resulting from cyber crime across charities. It should be noted that these estimates of scale will have a relatively wide margin of error.
-
The average (mean) annual cost of cyber crime for businesses is estimated at approximately £15,300 per victim. The sample sizes do not allow this cost calculation for charities.
Chapter 1: Introduction
1.1 Code of practice for statistics
The Cyber Security Breaches Survey is an official statistic and has been produced to the standards set out in the Code of Practice for Statistics.
1.2 Background
Publication date: April 2023
Geographic coverage: United Kingdom
The Department for Science, Technology and Innovation (DSIT), in partnership with the Home Office, commissioned the Cyber Security Breaches Survey of UK businesses, charities and education institutions as part of the National Cyber Security Programme.[footnote 1] The findings of this survey provide a comprehensive description of cyber security for a representative sample of UK organisations, which provides a snapshot of UK cyber resilience at this point in time. It tells us about the cyber threats organisations face and the actions they are taking to stay secure. It also supports the government to shape future policy in this area, in line with the National Cyber Strategy 2022.
To increase the value of these statistics, the 2023 iteration of the study includes, for the first time, estimates of cyber crime, and fraud that occurred as a result of cyber crime (see Chapter 6). As this is the first year these questions have been asked and there is no baseline for comparison, users should be relatively cautious when interpreting these statistics. They should ideally be considered alongside other, related evidence on computer misuse, such as the statistics for retail and wholesale premises collected in the 2021 Commercial Victimisation Survey (CVS), and the general public statistics from the Crime Survey for England and Wales (CSEW). The Cyber Security Breaches Survey adds to the broad picture from these other surveys by looking at these types of crimes across all economic sectors.
The research was conducted by the independent research organisation Ipsos. The project requirements and reporting are approved by DSIT and the Home Office. For the 2023 publication this includes coverage of the following areas:
-
prioritisation, information seeking (including use of government guidance) and decision making on cyber security, including among organisations’ management boards
-
cyber security approaches, covering risk management (including cyber insurance and supply chain risks), technical controls, staff training and responsibilities and governance
-
the cyber threat landscape, including identification of cyber security breaches or attacks, their outcomes and impacts, their estimated financial cost
-
incident response approaches and reporting of cyber security breaches or attacks
-
the prevalence, nature, scale and financial costs of cyber crime, as well as the prevalence, nature and scale of fraud that occurred as a result of cyber crime.
This 2023 publication follows previous surveys in this series, published annually since 2016. In each publication year, the quantitative fieldwork has taken place in the winter of the preceding year (for example, in winter 2022/23, for this latest survey).
This Statistical Release focuses on the business and charity outcomes. The results for educational institutions have been included in a separate Education Annex.
1.3 Methodology
As in previous years, there were two strands to the Cyber Security Breaches Survey:
- We undertook a random probability telephone and online survey of 2,263 UK businesses, 1,174 UK registered charities and 554 education institutions from 27 September 2022 to 18 January 2023. The data for businesses and charities have been weighted to be statistically representative of these two populations.
- We carried out 44 in-depth interviews between December 2022 and January 2023, to gain further qualitative insights from some of the organisations that answered the survey.
Sole traders and public-sector organisations were outside the scope of the survey. In addition, businesses with no IT capacity or online presence were deemed ineligible. These exclusions are consistent with previous years, and the survey is considered comparable across years.
The educational institutions, covered in the separate Education Annex, comprise 241 primary schools, 217 secondary schools, 44 further education colleges and 52 higher education institutions.
More technical details and a copy of the questionnaire are available in the separately published Technical Annex.
1.4 Changes since the 2022 study
The core approach for the 2023 study – data collected from organisations via a random-probability survey, predominantly conducted by telephone – is unchanged from the previous iterations. As such, we continue to make comparisons to previous years. Nevertheless, this year, we made more substantial changes to aspects of the methodology than in previous years. These changes were necessary to be able to deliver the larger sample sizes required this year, in order to explore the new topic of cyber crime. In total, we interviewed 3,991 respondents across all types of organisation (vs. 2,157 in 2022). We also undertook a higher number of qualitative follow-up interviews (44, vs. 35 in 2022).
The noteworthy changes to the methodology were as follows, with full details in the Technical Annex:
- We changed the sample frame for businesses from the Inter-Departmental Business Register (IDBR) to the Market Location business database. This was done to improve the overall sample quality, accuracy and telephone coverage. The sample frames for charities and education institutions were consistent with previous years.
- We adopted a multimode data collection approach, allowing organisations to take part partially or fully online as well as by phone.
- We substantially increased the use of split-sampling in the survey, where certain questions are only asked to a random half of the sample.
- The mapping of the questionnaire to the government’s 10 Steps to Cyber Security guidance has changed, following a review by Professor Steven Furnell from the University of Nottingham. This is fully explained in Section 3.9.
To note, these changes do not prevent us from making year-on-year comparisons. The Technical Annex lays out the steps taken to validate trends and check for mode effects. While we are confident in the trend findings reported throughout, we cannot definitively rule out any potential impact that a change in the sample frame may have had on the business findings. Therefore, in all the charted trend data, we have used a dotted line to mark the trend for businesses from 2022 to 2023. This is simply to suggest to readers that any shifts should be treated with appropriate caution. Further years of data will help to validate the trend.
1.5 Interpretation of findings
How to interpret the quantitative data
The survey results are subject to margins of error, which vary with the size of the sample and the percentage figure concerned. For all percentage[footnote 2] results, subgroup differences have been highlighted only where statistically significant (at the 95% level of confidence).[footnote 3] This includes comparison by size, sector, and previous years. By extension, where we do not comment on differences across years, for example in line charts, this is specifically because they are not statistically significant differences.
There is a further guide to statistical reliability at the end of this release.
Subgroup definitions and conventions
For businesses, analysis by size splits the population into micro businesses (1 to 9 employees), small businesses (10 to 49 employees), medium businesses (50 to 249 employees) and large businesses (250 employees or more).
For charities, analysis by size is primarily considered in terms of annual income band, specifically looking at the subgroups of high-income charities (with annual incomes of £500,000 or more) and very high-income charities (£5 million or more). The sample size for charities (1,174) has substantially increased this year compared to the 2022 sample size (424).
Due to the relatively small sample sizes for certain business sectors, these have been grouped with similar sectors for more robust analysis. Business sector groupings referred to across this report, and their respective SIC 2007 sectors, are:
- administration and real estate (L and N)
- agriculture, forestry, and fishing (A)
- construction (F)
- education (P)[footnote 4]
- health, social care, and social work (Q)
- entertainment, service, and membership organisations (R and S)
- finance and insurance (K)
- food and hospitality (I)
- information and communications (J)
- utilities and production (including manufacturing) (B, C, D and E)
- professional, scientific, and technical (M)
- retail and wholesale (including vehicle sales and repairs) (G)
- transport and storage (H).
Analysis of organisation cyber security split by geographical region is considered to be out of the scope of this reporting. While we may occasionally provide data specific for UK regions (at International Territorial Level 1), we recommend caution in attributing these differences to actions taken or not taken by that region – regional differences may also be attributable to the size and sector profile of the sample in that region.
Where figures in charts do not add to 100%, or to an associated net score, this is due to rounding of percentages or because the questions allow more than one response.
How to interpret the qualitative data
The qualitative findings offer more nuanced insights into the attitudes and behaviours of businesses and charities with regards to cyber security. The findings reported here represent common themes emerging across multiple interviews. Insights and verbatim quotes from individual organisations are used to illustrate findings that emerged more broadly across interviews. However, as with any qualitative findings, these examples are not intended to be statistically representative.
1.6 Acknowledgements
Ipsos UK, DSIT and the Home Office would like to thank all the organisations and individuals who participated in the survey. We would also like to thank the organisations who supported the survey development work, endorsed the fieldwork, and encouraged organisations to participate, including:
- the Association of British Insurers (ABI)
- the Charity Commission for England and Wales
- the Charity Commission for Northern Ireland
- the Institute of Chartered Accountants in England and Wales (ICAEW)
- Jisc, a not-for-profit company that provides digital infrastructure, services, and guidance for UK further and higher education institutions
- the Office for National Statistics (ONS)
- the Office of the Scottish Charity Regulator (OSCR)
- UCISA (formerly known as the Universities and Colleges Information Systems Association).
Chapter 2: Awareness and attitudes
This chapter explores:
-
prioritisation of cyber security within organisations
-
receiving and reacting to information and guidance about cyber security
-
qualitative data on how organisations make decisions on cyber security.
2.1 Perceived importance of cyber security
Around seven in ten businesses (71%) and six in 10 charities (62%) report that cyber security is a high priority for their senior management. A roughly equal proportion say this is a very high or fairly high priority (Figure 2.1).
While these are strong majorities, both results represent an apparent decrease in prioritisation from last year – this is explored in more detail in the next section (see Figure 2.2).
In interpreting this question, it is worth noting that in smaller organisations, the individuals responsible for cyber security – i.e. the ones who completed this survey – tend to be senior management, so are answering with regards to their own views. In larger organisations, these individuals may not be part of senior management, so their answers will reflect their own perceptions of their senior management team’s views.
Figure 2.1: Extent to which cyber security is seen as a high or low priority for directors, trustees, and other senior managers
| Organisation type | % very high | % fairly high | % fairly low | % very low | % don’t know | |
|---|---|---|---|---|---|---|
| Businesses overall | 36 | 35 | 19 | 8 | 2 | |
| Charities overall | 30 | 32 | 22 | 12 | 3 |
Bases: 1,152 UK businesses; 570 charities
It is more common for larger businesses to say that cyber security is a high priority (91% of medium businesses and 96% of large businesses, vs. 71% overall). The same is true for high-income charities (90% of those with income of £500,000 or more, vs. 62% overall). This continues the pattern seen in all previous years, where larger organisations tend to treat cyber security more seriously, and consequently allocate more resources to it.
Businesses in the following sectors tend to treat cyber security as a higher priority than others:
-
finance and insurance (73% say it is a “very” high priority, vs. 36% of all businesses)
-
professional, scientific and technical (46% a “very” high priority)
-
information and communications (86% a “very” or “fairly” high priority, vs. 71% overall).
In previous years, the health, social care and social work sector has consistently reported a higher prioritisation of cyber security. This year, due to low sample sizes for this subsector at this question, this difference cannot be validated statistically. However, in other areas such as governance and risk management (covered in Chapter 3), this sector remains ahead of others.
By contrast, and in line with previous years, food and hospitality businesses tend to regard cyber security as a lower priority than those in other sectors (only 58% say it is a high priority, vs. 71% of businesses overall).
Businesses in the South East tend to place a higher prioritisation on cyber security than the average UK business this year (80% say it is a high priority, vs. 71% overall). This does not, however, reflect a consistent trend from previous years. There are no other geographic regions this year that stand out ahead of others.
Trends over time
Figure 2.2 shows how the prioritisation score has changed over time. At face value, cyber security has become less of a priority among both businesses and charities, reversing a consistent rising trend for businesses in earlier years.
While there were more substantive changes to the survey methodology this year, such as a change in the business sample frame, we do not believe these to be the cause of this reversal. There is good evidence from the qualitative interviews, covered later in this section, that helps to explain the trend. Nevertheless, we cannot definitively rule out any potential impact that a change in the sample frame may have had. Therefore, on Figure 2.2 and similar charts across this report, we have used a dotted line to mark the trend for businesses from 2022 to 2023. This is simply to suggest to readers that any trends should be treated with appropriate caution. Further years of data will help to validate the trend.
Figure 2.2: Percentage of organisations over time where cyber security is seen as a high priority for directors, trustees, and other senior managers
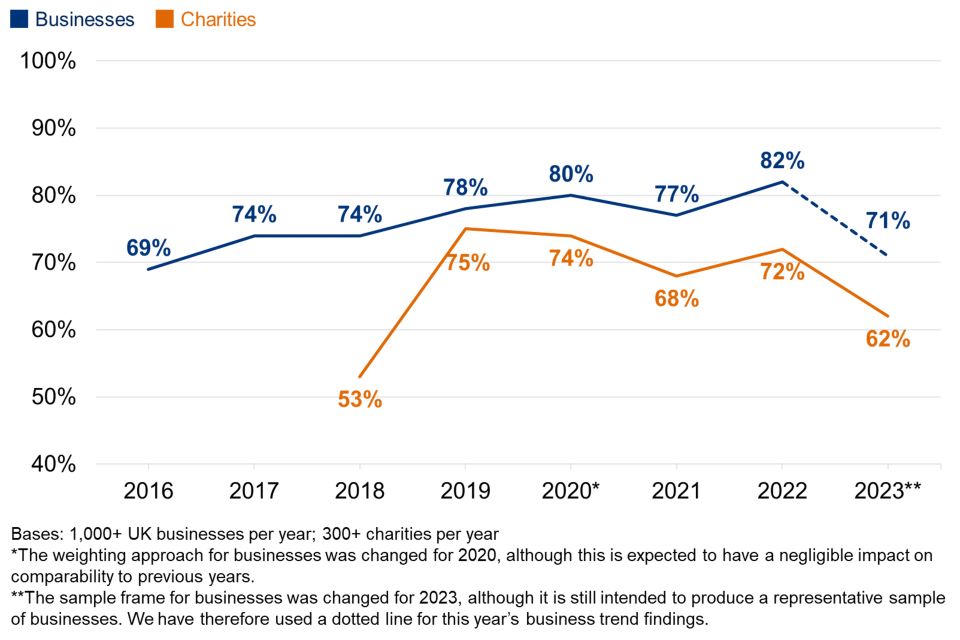
Primarily, there has been a shift in the proportion saying cyber security is a “fairly” high priority (e.g. from 44% of businesses last year, to 35% this year). The proportions of businesses and charities saying it is a very high priority is more consistent with last year. This potentially creates a clearer distinction this year between the organisations that have maintained their cyber security despite increasing challenges in the business environment, and those where it might be seen as competing against other business challenges or priorities – further evidenced in this year’s qualitative findings.
The drop in overall prioritisation in businesses is also more concentrated among micro businesses (down from 80% in 2022 to 68% this year saying cyber security is a high priority). In other words, cyber security has dropped down the agenda among the businesses where it was already seen as a more marginal priority, and among the businesses that typically have the fewest resources to deploy. By contrast, among small, medium and large businesses, there has been no statistically significant shift in findings:
-
83% of small businesses say it is a high priority (vs. 87% in 2022)
-
91% of medium businesses say this (vs. 92% in 2022)
-
96% of large businesses say this (vs. 95% in 2022).
Similarly, for high-income charities, the result is not significantly different from last year (90% in 2023, vs. 92% in 2022). By contrast, the result for low-income charities (with under £100,000 in annual income) has dropped by 14 percentage points (from 67% to 53%).
It is worth noting that, in each year of this survey, larger organisations have identified substantially more cyber security breaches and attacks than smaller ones (see Section 4.1). In this sense, it is those at greatest risk that have maintained their prioritisation of cyber security. Nevertheless, it is also important to note that most organisations are small. For example, micro businesses account for 82% of all UK businesses (if excluding those with zero employees). Therefore, this drop has significant implications for vast swathes of the business community.
The fall is broadly spread across economic sectors and across regions. The largest percentage point changes are in entertainment, service and membership organisations (down 29 points to 66%) and retailers and wholesalers (down 16 points to 66%).
Qualitative insights on cyber security prioritisation in the current economic and geopolitical environment
The qualitative interviews suggest that these survey findings – the lower proportion of organisations seeing cyber security as a priority this year – may be linked to changes in the external business environment. Various organisations highlighted that they faced rising costs and more difficulty with financial planning, due to inflation, higher energy prices and uncertainty about the economic situation.
There was a sense across interviews that the topic had dropped down the priority list among senior managers, relative to these wider concerns. This seemed to have hit smaller businesses and charities the hardest, given that the same senior individuals taking responsibility for cyber security in these organisations were also dealing with all the other general pressures facing their organisations. One interviewee, the Head of Finance in a high-income charity, highlighted that there were constant pressures to control their use of donor money and that they were nervous about their expected income in the coming year. The following quotes, respectively from a small hospitality business and a machinery retail and repair business, also highlights the focus on survival, leading to a reactive rather than proactive approach to cyber security:
We’re a small company. The biggest issue is trying to survive on a week-by-week basis. We can’t afford to allocate sums to cyber security. I’ll spend it as and when I have it, or when I need to.
– Managing director, small business
In moments of uncertainty, with costs increasing, it’s tempting to cut corners when you see how much cloud systems, antivirus, firewalls are costing. The risk is that pressure on margins leads you to cut corners, to reduce the amount you spend on cyber security.
– Director, small business
At the same time, many of the organisations we spoke to were keen to stress that they had not decreased their spending on cyber security in the face of such pressures. Moreover, larger organisations tended to have maintained their levels of board engagement over the past year (covered fully in Section 2.2), rather than reining back. However, some interviewees flagged that the current situation may make budget negotiations harder for future years, if not now.
Inflation is not affecting cyber security budgets at the moment. Maybe over the next year, as there is a sharp focus on spending, we may need to really be able to justify our case.
– Head of Cyber Security, large business
There were exceptions – organisations saying that cyber security had become a higher priority over the past year – but this was typically off the back of a cyber incident, or near-miss, within the organisation or the industry. For example, one senior manager from a high-income charity described how they had sped up a planned audit of their cyber security approach in response to other charities in their sector getting attacked. The charity had, following the audit, increased their cyber security budget, refreshed their policies around use of hardware and mobile phones, brought in mandatory training on phishing, and were planning to formally test their business recovery plan later in the year. Without this catalyst, organisations tended to take a reactive approach, where they would look at individual problems as and when they arose.
However, even in this case, this senior manager admitted that their trustees found it hard to understand the risks, and relied heavily on the cyber security experts within the charity.
[Cyber security is seen as] a scary, messy business with lots of technical challenges, best left to the experts. But there’s a growing recognition that it’s staff behaviours that drive most of the cyber security risk, so we need to share more with the SMT [Senior Management Team], so they know where the threats are coming from and what behaviours might be seen as risky.
– Business and Resources Director (overseeing Information Security Team), high-income charity
By comparison, recent geopolitical events were felt to have a more limited impact on organisations’ behaviour, and only impacted certain kinds of organisations. Where organisations had an international presence, or international clients, there was typically more awareness and concern about increasing cyber threats from countries such as Russia (linked in interviews to the war in Ukraine), Iran and China. Some organisations had blocked all traffic from these countries.
We think that we know the source of particular hacks we have had, and there’s a group operating from [area of China] … We are keeping a close eye on China because no one knows what way they are going to go. We have feet in both camps, in China and Taiwan. We are back to the balancing game.
– Information Security Manager, large business
There were some instances where larger businesses that traded internationally had taken a different response to state-sponsored attacks than to other types of cyber security beaches or attacks. The broad examples offered included changing the list of critical assets to be protected, giving more tailored training given to staff, and influencing where incidents are reported. For example, one large business specifically mentioned they would be more likely to report a state-sponsored attack to Action Fraud.
For other organisations outside these large multinationals, stories in the media about state-sponsored cyber attacks could rouse the general interest of senior managers. However, such attacks were often not viewed as a threat for their organisations, worthy of special attention.
We’re not on the radar of international actors. We’re flying under the radar.
– Finance Manager, medium business
Moreover, the impact of such news stories was often felt to be impermanent, rather than leading to a lasting change in the senior management or staff culture. In this particular case in a large tech manufacturer, it led to a short-term increase in reporting by the IT manager, moving from monthly to weekly written updates to the board, on top of existing quarterly presentations being delivered by the Chief Information Security Officer.
Last year when it all kicked off in Ukraine, we were doing weekly reports to the board for a short period where they had specific issues.
– Information Security Manager, large business
Some organisations, such as the following high-income charity, also suggested that they could not reasonably change their cyber security approach to match a shifting geopolitical threat, because they had limited information on the source of the attacks they were facing.
We don’t identify the threat sponsor. We do differentiate if it’s insider attacks, malicious or unintended. But that’s it in terms of differentiating the source. It doesn’t matter why they wanted to do it. It’s what they do that impacts us and makes a difference to the organisation.
– Information Security Strategic Lead, high-income charity
Another small business pointed out that even if their incident reports mentioned a specific country, the attack that led to the incident may not have originated there, making it challenging and potentially not useful to have a targeted response.
2.2 Involvement of senior management
How often are senior managers updated on cyber security?
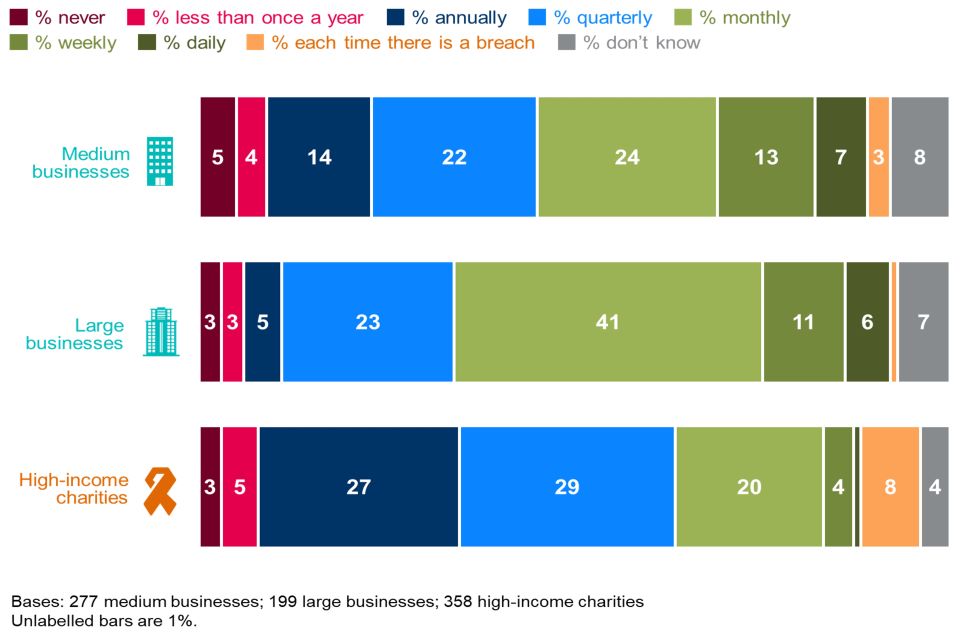
Figure 2.3 breaks down how often senior managers get updates on the state of cyber security and any actions being taken. It shows that updates tend to be more frequent in businesses than in charities, continuing a trend from previous years.
This year, this question was restricted to medium and large businesses, and to high-income charities. While the subgroup results are comparable across years, Figure 2.3 should not be directly compared to the equivalent figure from last year’s report given the changes in the groups being reported.
The new chart highlights that large businesses are also ahead of medium businesses in this respect, while high-income charities are behind both business subgroups. Two-thirds of medium businesses (65%) and eight in ten large businesses (81%) update their senior team at least quarterly, while just over half of all high-income charities (54%) also do this. Four-fifths of these businesses (79% of medium businesses and 86% of large businesses) and a similar proportion of these charities (80%) say senior managers are updated at least once a year.[footnote 5]
The results for these subgroups are similar to last year. Nevertheless, when taking a longer-term view, it is worth noting that in 2016 (the first year of this study), 71% of large businesses reported updating senior managers on cyber security on a quarterly basis, compared with 81% now. This suggests that, among large businesses, senior management discussion of cyber security is now more of a business-as-usual approach. Previous years of the study indicated that this was also the trend among smaller businesses, as well as large ones.
Figure 2.3: How often directors, trustees or other senior managers are given an update on any actions taken around cyber security
Board responsibilities
Three in ten businesses (30%) and a similar proportion of charities (31%) have board members or trustees taking explicit responsibility for cyber security as part of their job (Figure 2.4). This is across all organisations (i.e. not just those that have a formal management board) – although all registered charities have boards of trustees.
As might be expected, board-level responsibility is much more common in larger businesses, where the management board is likely to be larger. Around half of large businesses (53%) have a board member responsible for cyber security (vs. 30% of businesses overall). There is less variation in size among charities – for instance, a third (33%) of charities with incomes of £5 million or more have trustees responsible for cyber security (not significantly different from the 31% average).
Figure 2.4: Percentage of organisations with board members or trustees that have responsibility for cyber security
| Businesses overall | 30% |
| Micro businesses | 28% |
| Small businesses | 34% |
| Medium businesses | 41% |
| Large businesses | 53% |
| Within information and communications | 49% |
| Within finance and insurance | 44% |
| Within professional, scientific and technical | 41% |
| Charities overall | 31% |
Bases: 2,263 UK businesses; 1,387 micro businesses; 400 small businesses; 277 medium businesses; 199 large businesses; 161 information and communications businesses; 178 finance and insurance businesses; 285 professional, scientific and technical businesses; 1,174 charities
Information and communications businesses (49%), finance and insurance businesses (44%) and professional, scientific and technical businesses (41%) are each more likely than average to have board members taking responsibility for cyber security. These sectors, which tend to prioritise cyber security more, were also above average in the 2022 and 2021 surveys. At the other end of the scale, businesses in agriculture (17%), construction (21%) and food and hospitality (22%) are among the least likely to have board members assigned this role.
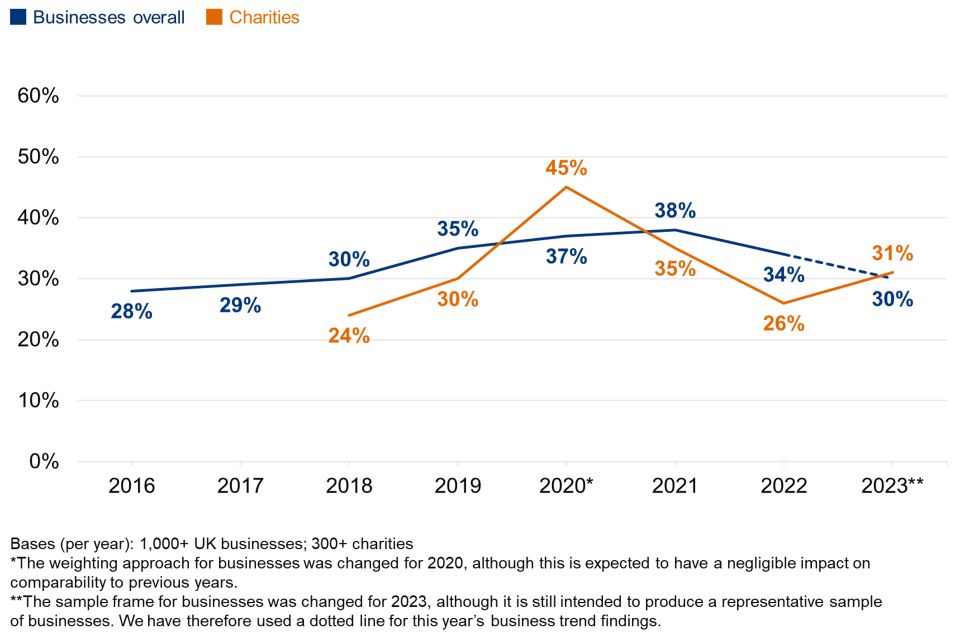
Trends over time
Figure 2.5 shows the trend over time for board members taking on cyber security responsibilities. Among businesses, it suggests a decline in board engagement since the 2021 study, which was the first where fieldwork took place under the COVID-19 pandemic.
Among charities, this year’s result represents an increase from last year (31% vs. 26%).
Figure 2.5: Percentage of organisations over time with board members or trustees with responsibility for cyber security
Qualitative insights on formal versus informal board engagement
In qualitative interviews, the individuals taking day-to-day responsibility for cyber security highly valued engagement from senior board members, as it helped them to get the buy-in of wider staff (e.g. when cyber security directives came with the backing of senior management), to challenge and improve their own approaches, and to get quicker approval for new measures.
One of the trustees is the lead for digital and cyber security. They are well informed about the area and will ask me more difficult questions should they wish to.
– Information Security Strategic Lead, high-income charity
It’s good to have somebody right at the very top who understands the risks and is quite supportive.
– IT Manager, large business
Luckily, at director level, there is the message [to staff] that this is happening, you will toe the line on this, and there is no excuse. I do have the backing to push through what we agreed. They know they need to improve security and change where staff members are positioned.
– Infrastructure and Security Lead, medium business
However, we heard several recurring reasons to explain why board members did not engage, including a lack of understanding or interest in cyber security relative to the day-to-day operations of the organisation, a lack of training, a lack of time and a perception that their kind of organisation was not facing an especially high risk from cyber attacks. The following quote discusses a senior management team who were considered good at their own roles, but tended to leave cyber security matters to the finance director, operations manager and the interviewee (in a human resources role), who dealt with their third-party IT support.
Although we have senior managers who are good at the role, they don’t have awareness in cyber security. I try to ensure they have a basic understanding, training, and knowledge in it. But they are focused on the day-to-day.
– Human Resources Administrator, medium business
The following example from a transport business highlights differing attitudes within the management board when being taken through a cyber awareness course:
The Managing Director rolled his eyes and said it’s all common sense. But the rest of board responded well.
– Finance Manager, medium business
The findings suggest board engagement becomes more structured and formal as organisations grow. Some of the larger organisations we spoke to had regular cyber security reports going to the board, had cyber security as a standing agenda item at board meetings (or at a subcommittee level just below the board), or reviewed cyber security as part of a regular look at their risk register. One high-income charity had webinar training designed specifically for their Chief Executive and Trustees that explained their specific role in supporting cyber security in the organisation, including supporting resource allocation and setting a good example.
By contrast, in small and medium-sized organisations, the approaches for keeping boards informed tended to be more informal. Several of these interviewees mentioned discussing cyber security with senior managers in an ad hoc and reactive manner, i.e. only when specific issues arose. One small social care business suggested their board would only need to hear about cyber security after a serious incident, or if a breach needed to be reported externally, in order to get board approval. Another mid-sized marketing business discussed growing very rapidly from a small boutique agency, meaning that they still had no regular board meetings in place – they would just make themselves available to the security lead as-and-when needed.
Often, in these cases, it was clear that boards were placing a great deal of trust either in their internal IT leads, or in their external IT providers – they assumed that these individuals would flag any serious issues with them. There was a sense among some of the small businesses interviewed that the problem of cyber security had been passed onto external contractors, resulting in senior managers disengaging from the topic and understanding the actions being taken, both internally and externally.
Where boards were engaging with cyber security, we often found this to be led by a single person on the board, as opposed to a more collaborative effort across board members. The nature of this individual’s engagement depended on their wider job role. In organisations where this individual was in a finance role, it often led to cyber security being seen through a financial lens, as a cost centre. Those taking day-to-day responsibility for cyber security, like an IT manager, had to report directly to finance leads for budget requests. In these instances, there was a greater emphasis on having to produce written business cases to justify new spending. This was felt to be a challenging task, as the evidence produced needed to be persuasive. One technology officer who had to write these kinds of business cases talked about the best evidence as referring to the amounts that might be saved or the potential reputational hit. They also talked about their cyber security audits being largely finance driven:
Most of [the cyber security audit] is bullet points showing the money spent and what we got out of it. It shouldn’t be, but it’s more a financial exercise than a governance exercise. You’re competing for budgetary allocation more than anything else.
– Business Technology Office, large business
In other organisations, there was sometimes someone on the board who had a specific interest or background in IT. These individuals could act as interpreters for other board members, but were sometimes entrusted to take sole charge of IT and cyber issues, with the rest of the board disengaging. Nevertheless, in these organisations, there was often a more flexible approach to cyber security spending. In the case of this manufacturing business, for example, there was a direct relationship between the Managing Director and the IT manager, which meant the business case was sometimes easier to argue:
There’s no budget. We’ve never worked on a budget basis. It’s based on merit, which feels weird but means we’re not restricted. We tend to have a lot of flexibility when decisions are justifiable, when the business value is clear.
– IT Manager, large business
2.3 Sources of information
Overall proportion seeking cyber security information or guidance
External sources of information and guidance on cyber security include government sources, third-party cyber security or IT providers, trade bodies, as well as information found through an internet search or from the media. Approximately half of businesses (49%) and just under half of charities (44%) report actively seeking information or guidance on cyber security from outside their organisation in the past year.
These results mirror the previous iterations of the study in 2022 and 2021. For businesses overall, this result is lower than its peak in in 2018 and 2019 (59%), which was seen in the lead up to, and aftermath of General Data Protection Regulation (GDPR) implementation. For charities, it has remained around this level since 2018 (when 36% of charities had sought external information or guidance).
As Figure 2.6 illustrates, external information is less often sought in micro businesses. This is the same pattern in charities – only a third of charities with incomes under £100,000 (34%, vs. 44% overall) have sought external information.
The sectors where businesses are most likely to seek out external information are finance and insurance (79%), and the professional, scientific, and technical sector (58%). Both sectors have stood out in this respect in previous years.
Figure 2.6: Proportion of organisations that have sought external information or guidance in the last 12 months on the cyber security threats faced by their organisation
| Businesses overall | 49% |
| Micro businesses | 46% |
| Small businesses | 57% |
| Medium businesses | 72% |
| Large businesses | 63% |
| Within finance and insurance | 79% |
| Within professional, scientific and technical | 58% |
| Charities overall | 44% |
Bases: 1,152 UK businesses; 686 micro businesses; 211 small businesses; 141 medium businesses; 114 large businesses; 93 finance and insurance businesses; 142 professional, scientific and technical businesses; 570 charities
Under one in ten businesses (8%) and a similar proportion of charities (12%) seek information internally within their organisations. Among both groups, this result is higher than last year (when it was just 3% of businesses and 7% of charities doing so).
As might be expected, internal information seeking is higher within large businesses (38%), which are more likely to employ cyber security specialists. This is higher than in both medium businesses (15%) and high-income charities (22%).
Where do organisations get information and guidance?
As in previous years, the most common individual sources of information and guidance are:
-
external cyber security consultants, IT consultants or IT service providers (mentioned by 21% of businesses and 15% of charities)
-
any government or public sector source, including government websites, regulators, and other public bodies (12% of both businesses and charities)
-
general online searching (8% of businesses and 6% of charities).
To note, this question is unprompted for those doing the survey by telephone (the vast majority), while those doing it online look at a prompted response list.
The wide range of individual sources mentioned, together with the relatively low proportions for each, highlights that there is still no commonly agreed information source when it comes to cyber security. For example, just 2% each of businesses and charities mention the National Cyber Security Centre (NCSC) by name, in line with the previous year. This rises to one in three large businesses (28%) and around half this proportion of high-income charities (15%).
In 2019, nine regional Cyber Resilience Centres (CRCs) were opened across England and Wales, specifically in order to help smaller organisations make their cyber operations safer. It is worth noting that these are most often mentioned as an information source by large businesses (7%) and very high-income charities (5% of those with £5 million or more in annual income). Beyond these larger organisations, specific mentions of the CRCs are negligible at present.
There are a small number of further differences by size, or between businesses and charities that should be noted, particularly around the use of external cyber security consultants, IT consultants or IT service providers:
-
Seeking information and guidance from external consultants or providers is most common among medium businesses (46%) – higher than among large businesses (31%), and replicating a pattern from previous years. It reflects that these businesses may recognise the need for more cyber security expertise, but have to procure it externally, rather than employing experts internally like many large businesses.
-
Among micro businesses, the most common sources are also external consultants or providers (18%). The next most common response is business banks (5%).
-
Among charities, fewer than one in ten (6%) mention charity-specific sources such as their relevant Charity Commission.[footnote 6]
Awareness of government guidance, initiatives, and communications
The question around information sources in the previous subsection tends to underrepresent actual awareness of government communications on cyber security, as it is asked unprompted for individuals doing the telephone survey. In these kinds of unprompted questions, individuals often do not recall specific things they have seen and heard. We therefore ask organisations, in a later set of prompted questions, whether they have heard of specific initiatives or communications campaigns before. These include:
-
the national Cyber Aware communications campaign, which offers tips and advice to protect individuals and organisations against cyber crime
-
the 10 Steps to Cyber Security guidance, which aims to summarise what organisations should do to protect themselves
-
the government-endorsed Cyber Essentials scheme, which enables organisations to be certified independently for having met a good-practice standard in cyber security.
As Figure 2.7 shows, Cyber Aware is the most commonly recognised of these. However, only a minority of businesses and charities have heard of any of these initiatives or campaigns.
Figure 2.7: Percentage of organisations aware of the following government guidance, initiatives, or communication campaigns
| Government guidance, initiative, or communication campaign | Businesses | Charities |
|---|---|---|
| Cyber Aware campaign | 27% | 30% |
| 10 Steps to Cyber Security guidance | 14% | 19% |
| Cyber Essentials scheme | 14% | 15% |
Bases: 2,263 UK businesses; 1,174 charities
Medium and large businesses are substantially more aware of these guidance packages:
-
50% of medium businesses and 59% of large businesses are aware of Cyber Essentials (vs. 14% of all businesses)
-
46% of medium businesses and 54% of large businesses have heard of Cyber Aware (vs. 27% overall)
-
32% of medium businesses and 44% of large businesses are aware of the 10 Steps guidance (vs. 14% overall).
As in previous years, there is little difference between UK nations and regions when it comes to awareness of these different schemes or campaigns.
Trends over time
Figure 2.8 illustrates that business awareness of these schemes and initiatives is close to the previous survey, although there is a pattern of declining awareness of Cyber Aware and the 10 Steps guidance over the last two years. Fewer charities also report having heard of Cyber Aware compared to the previous year (38% in 2022). More have heard of Cyber Aware than the other schemes, but still only a minority of businesses and charities are aware of each one.
Figure 2.8: Percentage of businesses over time aware of the following government guidance, initiatives, or communication campaigns
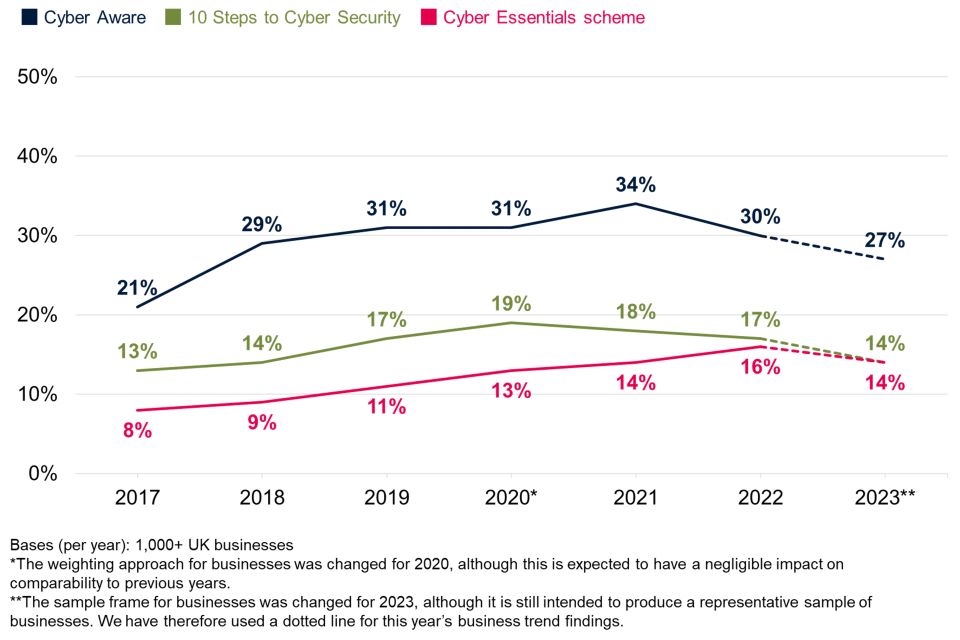
This chart suggests an ongoing, untapped potential for organisations to make better use of the information and guidance that is already available to them. For example, Cyber Aware campaign materials might be used as a reference for employees, to raise their general awareness on cyber security. Increasing awareness of Cyber Essentials may help to combat the idea, raised in previous years of this study, that some organisations do not know what good minimum standards look like when it comes to cyber security.
Guidance targeted at specific types of organisations
Since 2020, the survey has asked about NCSC guidance that is directed to specific sizes of business or towards charities. This includes:
-
the NCSC’s Small Business Guide and Small Charity Guide, which outline more basic steps that these smaller organisations can take to protect themselves
-
the NCSC’s Board Toolkit, which helps management boards to understand their obligations, and to discuss cyber security with the technical experts in their organisation.
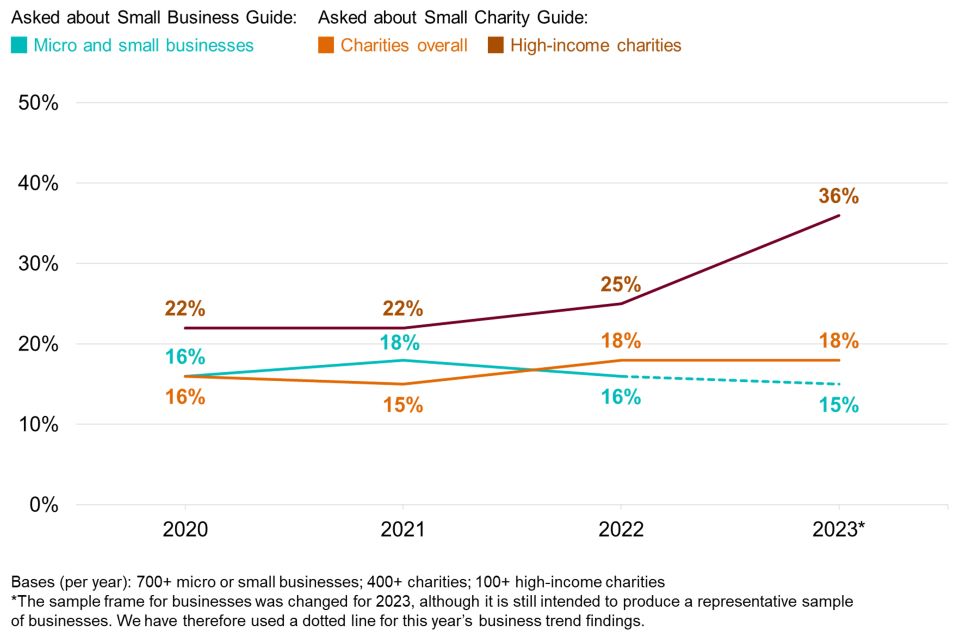
Figure 2.9 shows that just under one in five micro and small businesses (15%) have heard of the Small Business Guide, broadly unchanged from the previous three years. This is similar between micro businesses (15%) and small businesses (17%), which was also the pattern in previous years.
Around one in five charities (18%) have heard of the Small Charities Guide. This result for charities overall has been relatively consistent across years. However, as Figure 2.9 shows, the result for high-income charities specifically has gone up since 2021, now standing at over a third of these charities (36%).
Figure 2.9: Percentage of businesses and charities over time aware of the Small Business Guide and Small Charity Guide
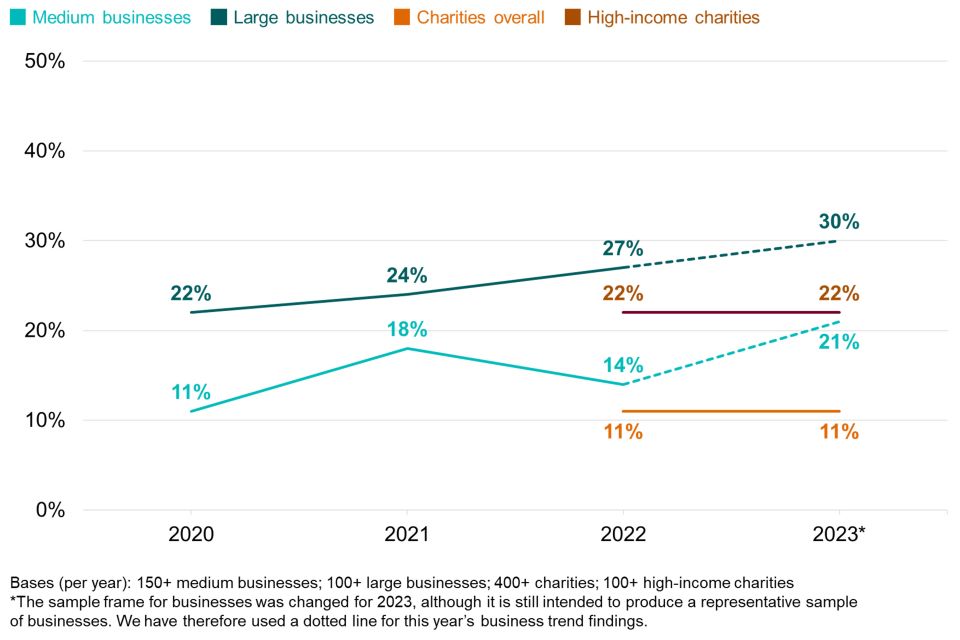
The Board Toolkit was specifically explored with medium and large businesses in the survey, as well as charities of all sizes. Among all groups of larger organisations, as Figure 2.10 shows, awareness of the toolkit has been on the rise, particularly amongst large businesses, since it was first published in 2020. However, the majority of medium and large businesses and high-income charities remain unaware of it.
To note, charities were only asked this question from the 2021 study onwards.
Figure 2.10: Percentage of medium and large businesses, and charities over time aware of the Board Toolkit
Broadly, these findings suggest that larger organisations are increasing their engagement with cyber security, and any stagnation (e.g. the decline in prioritisation discussed at the start of this chapter, or drops in awareness of the Cyber Aware campaign) is more localised among the smallest businesses.
Impact of government information and guidance
A total of 41% of businesses and 49% of charities recall seeing, when prompted, any of the government communications or guidance covered in the previous section, The survey asks a random subsample of these organisations about the changes they have made to their cyber security measures as a result of what they have seen. Over half of these businesses (54%) and around half of these charities (49%) report making any changes. To note, this question is unprompted in both the telephone and online surveys.
The figure for businesses making changes has increased since 2022 (when it was 44%), which itself was an increase from 2021 (37%). The result among charities remains higher than it was in 2021 (38%) and in line with the 2022 figure (also 49%). These changes appear to be across all size and income bands, i.e. they are not driven by larger organisations. It is worth noting that in our 2021 report, individuals in IT and cyber roles reported feeling constrained in taking action, because of the competing pressures on their time from having to adapt to the COVID-19 pandemic. Therefore, while exposure to information may not have increased overall, organisations are now potentially more willing and able to act upon the guidance they see – given that many have stabilised their operations since the pandemic.
Large businesses are significantly more likely to have acted on seeing government initiatives or campaigns (67%, vs 54% of all businesses). Seven in ten high-income charities report having done so on seeing this guidance (71%, vs. 49% of charities overall).
In terms of the specific changes made, there are a wide variety of unprompted responses given. No single response appears especially frequently.
-
25% of businesses and 22% of charities that recall seeing these government communications report making changes of a technical nature (e.g. to firewalls, malware protections, user access or monitoring).
-
21% of businesses and 20% of charities have made resourcing and governance-related changes (e.g. increased spending, or updated policies or documentation).
-
16% of businesses and 14% of charities say they have made changes to do with staffing (e.g. employing new cyber security staff), outsourcing or training.
The top unprompted individual response categories are:
-
changing or updating firewalls or system configurations (10% of businesses and 6% of charities)
-
staff training and communications (9% and 10%)
-
changing or updating antivirus or antimalware software (9% and 7%)
-
updating passwords, or adding multi-factor authentication (MFA, for 8% and 5%).
Chapter 3: Approaches to cyber security
This chapter looks at the various ways in which organisations are dealing with cyber security. This covers topics such as:
-
risk management (including supplier risks)
-
reporting cyber risks
-
cyber insurance
-
technical controls
-
training and awareness raising
-
staffing and outsourcing
-
governance approaches and policies.
We then cover the extent to which organisations are meeting the requirements set out in government-endorsed Cyber Essentials scheme and the government’s 10 Steps to Cyber Security guidance.
3.1 Identifying, managing, and minimising cyber risks
Actions taken to identify risks
Organisations can take a range of actions to identify cyber security risks, including monitoring, risk assessment, audits, and testing. They are not necessarily expected to be doing all these things – the appropriate level of action depends on their own risk profiles.
Figure 3.1 shows the six actions covered by the survey. Deploying security monitoring tools and undertaking risk assessments continue to be the most common actions undertaken by both businesses and charities – although businesses are significantly more likely to be using monitoring tools than charities (30% vs. 19%).
Figure 3.1: Percentage of organisations that have carried out the following activities to identify cyber security risks in the last 12 months
| Activities to identify cyber security risks in the last 12 months | Businesses | Charities |
|---|---|---|
| Any of the listed activities | 51% | 40% |
| Used specific tools designed for security monitoring | 30% | 19% |
| Risk assessment covering cyber security risks | 29% | 27% |
| Tested staff (e.g. with mock phishing exercises) | 19% | 16% |
| Carried out a cyber security vulnerability audit | 15% | 14% |
| Penetration testing | 11% | 9% |
| Invested in threat intelligence | 9% | 7% |
Bases: 2,263 UK businesses; 1,174 charities
Every one of these actions continues to be more common in larger organisations. Eight in ten medium businesses (80%), nine in ten large businesses (88%) and eight in ten high-income charities (79%) have carried out at least one of the listed activities. As specific examples:
-
53% of medium businesses and 72% of large businesses have used security monitoring tools
-
51% and 63% respectively have undertaken cyber security-related risk assessments.
Among these subgroups, threat intelligence remains the least common activity. This is undertaken by around half (47%) of large businesses, while each other activity is carried out by between six and seven in ten large businesses.
Those in the health, social care and social work sector are significantly more likely than the average business to have taken any of these actions (74% vs. 51%), as are finance and insurance businesses (71%), and information and communications businesses (67%).
How organisations undertake audits and implement their findings
Among the 15% of businesses that undertake cyber security vulnerability audits, a third only undertake internal audits (36%), a similar proportion only have external audits (33%) and a quarter (25%) carry out both.
How businesses undertake audits continues to be strongly linked to size:
-
micro businesses are most likely to solely use internal staff to undertake audits (44% of the micro businesses undergoing any type of audit)
-
small businesses have the greatest tendency (44%) to only use external contractors
-
large businesses, likely having greater financial and personnel capacity, are most likely to state that audits have been undertaken both internally and externally (56%).
A similar proportion of charities have carried out cyber security vulnerability audits (14%, similar to 15% of businesses). Among these charities, there is a broadly equal split between those conducted internally (29%), externally (32%) or both (29%).
Reviewing supplier risks
Suppliers can pose various risks to an organisation’s cyber security, for example in terms of:
-
third-party access to an organisation’s systems
-
suppliers storing the personal data or intellectual property of a client organisation
-
phishing attacks, viruses or other malware originating from suppliers.
Despite this, relatively few businesses or charities are taking steps to formally review the risks posed by their immediate suppliers and wider supply chain. Just over one in ten businesses say they review the risks posed by their immediate suppliers (13%) and fewer are looking at their wider supply chain (8%). Among charities, the respective figures are broadly similar (11% look at their immediate suppliers and 6% at their wider supply chain).
As Figure 3.2 shows, the overall figures mask a wide variation by size. Possibly reflecting a more complex supply chain, a quarter of medium businesses (27%) and more than half of large businesses (55%) review the cyber security risks posed by their immediate suppliers. It is still relatively rare for these businesses to review their wider supply chain (15% and 34% respectively do so). However, as the next section discusses, this has been improving.
Among charities, two-fifths (41%, vs. 11% overall) of those with incomes of £5 million or more, and a quarter (26%) of those with incomes of £500,000 or more, have reviewed immediate supplier risks. Among both subgroups, only 15% have reviewed their wider supply chains.
Reflecting a generally more sophisticated approach to cyber security overall, businesses in the finance and insurance (26%), and information and communications (21%) sectors are more likely than average (13%) to monitor the risks posed by their immediate suppliers. However, there are no significant sectoral differences when it comes to reviewing wider supply chains.
Figure 3.2: Percentage of organisations that have carried out work to formally review the potential cyber security risks presented by the following groups of suppliers
| Organisation type | Their immediate suppliers | Their wider supply chain |
|---|---|---|
| Businesses overall | 13% | 8% |
| Micro businesses | 12% | 7% |
| Small businesses | 18% | 10% |
| Medium businesses | 27% | 15% |
| Large businesses | 55% | 34% |
| Within finance and insurance | 26% | 15% |
| Within information and communications | 21% | 9% |
| Charities overall | 11% | 6% |
Bases: 2,263 UK businesses; 1,387 micro businesses; 400 small businesses; 277 medium businesses; 199 large businesses; 178 finance or insurance businesses; 161 information and communications businesses; 1,174 charities
Trends over time
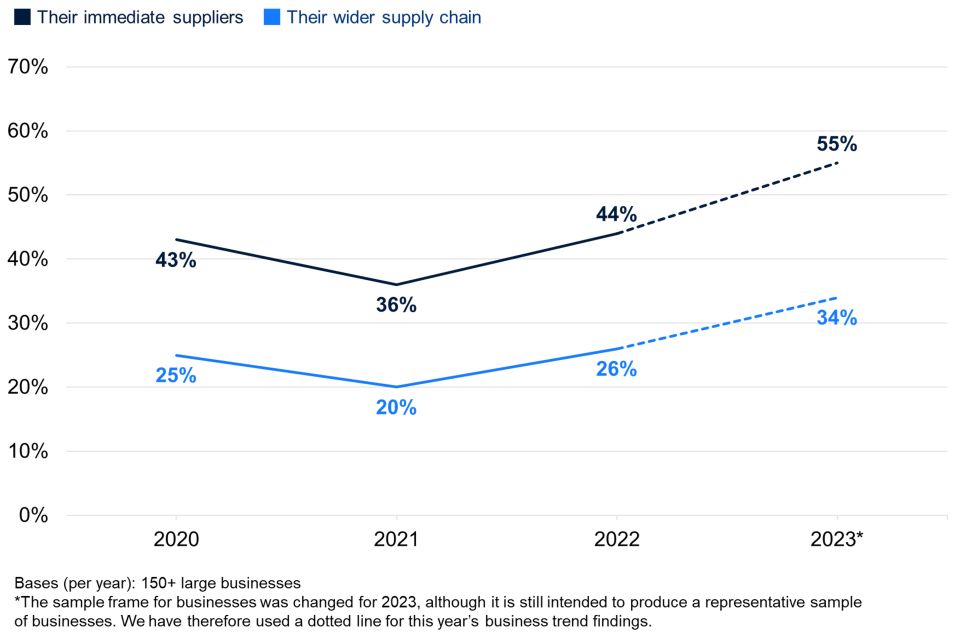
This question has been asked since the 2020 study (the last pre-pandemic study). As Figure 3.3 shows, among large businesses specifically, the proportions saying they review both their immediate supplier and their wider supply chain risks are at their highest ever this year, having recovered from a drop-off during the pandemic.
Figure 3.3: Percentage of large businesses over time that have carried out work to formally review the potential cyber security risks presented by the following groups of suppliers
Barriers to addressing supplier risks
The organisations that review supplier risks (immediate or otherwise) still face challenges when attempting to do this. The predominant challenges identified, among those carrying out any review, have remained relatively consistent over time. They continue to experience a lack of time and money and not being able to elicit information from suppliers. Lack of time and money is a more substantial issue among charities than businesses (46% vs. 32%).
Figure 3.4 shows that a wider range of barriers are also impacting organisations, including barriers around knowledge, skills and prioritisation. The ordering of these issues is in line with the two previous years this question has been asked.
Overall, around three in ten businesses (29%) say none of the six factors in the chart have prevented them from understanding potential cyber security risks within their supply chain. This compares to 32% in 2022 and 36% in 2021. In other words, organisations are more frequently raising one or more of barriers in Figure 3.4 as an issue for them now than before. This suggests that businesses are on-the-whole starting to find supply chain cyber risk management more challenging than before (among those attempting to do it in any form).
Figure 3.4: Barriers to businesses undertaking formal review of supplier or supply chain risks
| Barriers to undertaking formal review of supplier or supply chain risks | Businesses | Charities |
|---|---|---|
| Lack of time of money for this | 32% | 46% |
| Can’t get information from suppliers to carry out checks | 31% | 20% |
| Not knowing what checks to carry out | 25% | 21% |
| Not a priority when working with suppliers | 25% | 18% |
| Lack of skills to be able to check suppliers in this way | 18% | 25% |
| Not knowing which suppliers to check | 13% | 14% |
Bases: 472 UK businesses that have formally reviewed supply chain risks; 233 charities
Qualitative insights on broad supply chain risks
The qualitative interviews suggest that cyber security in supply chains is still an issue where organisations lack awareness. Consideration of these kinds of risks was rare – some interviewees flagged that the interview was the first time they had thought about it. Nonetheless, several of the larger organisations we spoke to felt that there had been a general increase in awareness of the issue compared to previous years – matching the increasing action taken by larger organisations over the years (as charted in Figure 3.3).
Supply chain risk is one of the risks that requires more attention this year as it is most likely to be the cause of an incident … The risk is more likely to come from the third-party that supplies IT support or a cloud-hosting provider without proper security.
– Human Resources Administrator, high-income charity
With that said, there seemed to be a more specific focus on supply chain risks from IT and technology providers, with other physical suppliers sometimes overlooked. For instance, one large organisation mentioned that they did risk assessments for all IT suppliers, but would not necessarily do this for other suppliers. In the view of the Assistant IT Director, this potentially put them at risk if, for example, a department bought a smart device (i.e. connected to the internet) from a foreign equipment supplier that was not treated as IT procurement. Another Information Security Manager in a large business reported that the business had very formal processes in place for IT and software suppliers, including regular lines of communication, but felt that they were more “hit and miss” with non-IT suppliers.
The interviews did highlight various triggers that led organisations to consider the issue:
-
contractual requirements or procurement rules that referred to suppliers
-
information and guidance from sources such as the NCSC
-
organisations hearing about attacks on their supply chains through their customers
-
internal or external cyber security audits raising the issue.
How we manage risks from our wider supply chain is something that was picked up on in our audit. Currently, we have been procuring services with the assumption that their cyber credentials are within a particular procurement framework. We do cloud assessments, but we were not getting physical certificates. We are now undertaking and formalising our suppliers into high, medium and low risk.
– Head of Technical Services, large charity
As customers do their audits, one of the questions they are asking is ‘how do you audit your suppliers?
– Information Security Manager, large business
At the more sophisticated end, organisations dealt with supplier risks in a variety of ways. We came across examples of contractual arrangements, supplier questionnaires, requirements that suppliers agree to external accreditations (e.g. ISO 27001), regular meetings with key suppliers, adding supplier risks to risk registers, and logging of data flows with suppliers on data protection registers. At the other end of the scale, there were a small number of examples of much more informal supply chain cyber risk management, including emailing suppliers ad hoc to ask what they have in place. One Managing Director of a micro digital marketing business said they would discuss things like passwords with suppliers verbally and would manage each supplier’s access to their systems on a project-by-project basis.
The ongoing monitoring of suppliers, post-procurement, was felt to be much more challenging to manage. This was often put down to time pressure and being crowded out by other business priorities. Many organisations felt they simply had to trust suppliers to follow contracts, and that it was difficult to extract further information if suppliers or partners were not forthcoming. There was a suspicion that suppliers or partners would want to keep cyber incidents to themselves. These discussions strongly reflected the top two challenges around supply chain cyber risk management mentioned in the survey (covered in Figure 3.4).
If our partners are compromised, we want to know how and what happened, but they are not always willing to tell us.
– Information Security Manager, large business
Qualitative insights on Digital Service Providers (DSPs)
This year’s qualitative strand also looked at perceptions of the risks posed by Digital Service Providers (DSPs). Relatively few interviewees were able to discuss this topic at all, with several suggesting it did not apply to them (which may indicate a lack of awareness around the topic). This was despite a definition for DSPs being provided, i.e. a supplier that manages a suite of IT services like an organisation’s network, cloud computing and applications.
Among the interviewees that did discuss the topic, this covered a wide range of DSPs, including general IT service providers (including hardware and software maintenance), cloud storage providers, network monitoring, threat identification, and training providers. Smaller organisations seemed especially reliant on DSPs, due to their lack of in-house expertise and capacity.
Among those that did talk about DSPs, cyber security was not commonly raised as a consideration when choosing a DSP. Instead, the focus was on things like track record and cost. One micro business said they had simply used the DSP that came as part of a free deal with the hardware they had purchased.
One large manufacturer mentioned that they had included a question in their tendering process for one DSP about their vetting of staff, but they also had a sense that suppliers might opt not to be truthful and reveal any issues around this for fear of losing contracts. Another interviewee agreed that, while they could enquire about any risks with DSPs, they would ultimately still proceed with procurement if they could not influence these risks.
There was an assumption that the DSP would be responsible for cyber security and would, at a minimum, be keeping back-ups in case of any data loss or disruption. As such, there was a great deal of trust placed in the DSPs that organisations had chosen, especially if they were household name companies like Microsoft or Google. There was an acknowledgement that DSPs took on a high level of responsibility.
You’re effectively giving DSPs the keys to the back door.
– IT Manager, large business
In two of our interviews with large organisations, there were concerns that they might be at greater risk of state-sponsored attacks if their DSPs also serviced at-risk organisations, such as government departments and defence organisations. However, neither organisation was currently taking formal steps to address these concerns.
Corporate reporting of cyber security risks
Very few organisations at present tend to cover their cyber security risks in annual reports. Around a quarter of medium or large businesses (27%) – this question was only asked of larger businesses – published an annual report in the past 12 months.
Among these medium and large businesses, around a fifth (21%) covered their cyber security risks within it, which is broadly in line with last year (19%), when this question was first asked. Large businesses more commonly do so in 2023 (33% include cyber security risks, vs. 16% of medium businesses), which is also similar to last year.
This question is asked of all charities (not just high-income ones). Two-thirds of charities (64%) say they have published annual reports within the last 12 months, reflecting that it is a statutory obligation for them to do so. To note, where charities say they have not done so, it may simply be a lack of awareness on the part of the interviewee (e.g. if they are in a more technical roles). Among the charities that are aware of putting out an annual report, around one in eleven (9%) have covered cyber security risks in this report, i.e. a lower proportion versus businesses. This compares to 4% last year (a statistically significant change).
While the year-on-year change are based on relatively small groups, they indicate that public reporting of cyber risks, while still relatively rare, is potentially on the rise.
Corporate reporting was briefly discussed in the qualitative interviews as well. This highlighted that one of the main drivers of reporting was to reassure stakeholders and investors that the organisation took cyber security seriously. However, there was a sense across interviews that this kind of reporting should be intentionally vague and light on detail, so as not to give away any vulnerabilities to potential attackers, or provide intelligence to competitors. This meant that coverage of cyber security breaches was not typically included.
From a cyber security perspective all it says is that we’re focused on cyber security. We treat it as a top five risk. We go no further than that as we don’t want to give away what we’re doing. We take it seriously but we’re not going to tell you how.
– Information Security Manager, large business
3.2 Cyber security strategies
As Figure 3.5 shows, around half (52%) of medium and large businesses and just over a third of high-income charities (36%) have a formal cyber security strategy in place – that is, a document underpinning all policies and processes relating to cyber security.
This year, the question was only asked of these larger organisations, whereas last year it was asked of all businesses and charities, including smaller ones. Therefore, Figure 3.5 should not be directly compared to the equivalent figure from last year’s report. With that said, the large business result specifically is higher than last year (rising from 57% in 2022 to 68% this year). The result for medium businesses is on a par with last year (when it was 48%).
Figure 3.5: Organisations that have a formal cyber security strategy
| Medium/large businesses (combined) | 52% |
| Medium businesses | 49% |
| Large businesses | 68% |
| High-income charities | 36% |
Bases: 277 medium businesses; 199 large businesses; 358 high-income charities
Among the larger organisations that do have a cyber security strategy in place, around eight in ten of these business (80%) and charities (76%) report that this has been reviewed by senior executives or trustees within the last 12 months.
Qualitative insights on why and how organisations implement cyber security strategies
The qualitative research revealed the kinds of factors that led organisations to set up formal cyber security strategies, including:
-
pressure from management boards
-
recommendations from auditors following an audit
-
perceived reputational risk
-
business acquisition – in one large manufacturing business, a company merger had led them to substantially reconsider their cyber security approach in the past year, since there was a need to reconcile the different set-ups in the previous companies
-
responses to GDPR.
On the final point above, it is worth noting that cyber security continued to be intertwined with GDPR compliance, in terms of policies, rules around storing data and staff training. In one case, this meant that both the IT and human resources team were involved in developing cyber security policies. One charity mentioned data breaches on their risk register, but in the context of GDPR rather than cyber risk. In another charity, the mandatory cyber security training for staff was heavily focused on GDPR.
We take this approach because our reputation depends on it … and, legally, GDPR and other regulations oblige us to.
– Technical Services Director. medium business
One of the common behaviours among organisations that developed a formal strategy was to have cyber security break away from another department like IT or, in one case, facilities. This signalled a greater strategic prioritisation of cyber security and, in some instances, meant that it secured its own budget, separate from the broader IT budget. This was important to ensure continued spending on cyber security, given that this spending was not necessarily protected when it was simply part of the overall IT budget.
Spending is usually reactive. If there is a problem, then it is fixed. We don’t have budget set to go towards cyber security. It’s hard to gauge, as you do not know the extent of data attacks and its cost.
– Purchasing and IT Manager, small business
Interviewees also discussed various barriers to adopting and implementing formal cyber security strategies, including:
-
a lack of expertise in-house or within their business network to support them in developing a robust strategy – such as where to start, what to include, and how to monitor progress
-
a lack of buy-in from the workforce – one charity noted that, with its high turnover of staff and volunteers, it was difficult to ensure staff knew what to do and who to contact in case of a cyber incident
-
a perception that cyber incidents were too varied, or alternatively that some types of incidents were too unlikely, to warrant a uniform strategy.
3.3 Insurance against cyber security breaches
Which organisations are insured?
Just under four in ten businesses (37%) and a third of charities (33%) report being insured against cyber security risks in some way. In most cases, as Figure 3.6 shows, cyber security insurance is an addition to a wider insurance policy – only 7% of businesses and 8% of charities have a specific cyber security insurance policy. Larger businesses are more likely to have a specific policy (26%), as are high-income charities (22%).
As has been the case in previous years, medium businesses are the most likely size band to have any form of cyber insurance (63%, vs. 55% of large businesses and 36% of micro or small businesses). This may reflect the idea that medium businesses tend to have more resources than smaller businesses to be able to afford insurance, while possibly not having the skills or tools to be able to address all cyber security risks internally like larger businesses.
It is worth noting the high level of uncertainty that remains at this question. One-fifth of business (20%) and charities (18%) do not know if their employer has any form of cyber security insurance, despite the survey being carried out with the individual identified by the organisation as having most responsibility for cyber security.
Figure 3.6: Percentage of organisations that have the following types of insurance against cyber security risks
| Organisation type | Cyber security cover as part of a wider insurance policy | A specific cyber security insurance policy |
|---|---|---|
| Businesses overall | 30% | 7% |
| Micro businesses | 29% | 6% |
| Small businesses | 33% | 11% |
| Medium businesses | 40% | 22% |
| Large businesses | 29% | 26% |
| Charities overall | 25% | 8% |
Bases: 1,111 UK businesses; 701 micro businesses; 189 small businesses; 136 medium businesses; 85 large businesses; 604 charities
As might be expected, insurance cover is more prevalent in the finance and insurance sector itself. Half of finance and insurance businesses have some sort of coverage against cyber security breaches (48%, vs. 37% overall). A similar proportion of professional, scientific and technical businesses (52%) also report having cyber insurance.
Trends over time
Compared to the 2022 survey, the proportions with some form of insurance have moved in opposite directions for businesses (dropping from 43% to 37%) and charities (increasing from 27% to 33%) this year. For businesses, the drop is driven by fewer micro businesses (down from 38% to 29%) and small businesses (down from 40% to 33%) including cyber security cover as part of a wider insurance policy. It may reflect that these smaller businesses are attempting to cut their costs in light of the more challenging business environment this year, reflected in our qualitative findings (see Section 2.1).
3.4 Technical cyber security controls
Each year, we ask whether organisations have a range of technical rules and controls in place to help minimise the risk of cyber security breaches. The full list is shown in Figure 3.7. Many of these are basic good practice controls taken from government guidance such as the 10 Steps to Cyber Security or the requirements of Cyber Essentials. Towards the end of this chapter, we map survey responses to these schemes to estimate how many organisations are operating in line with the guidance.
A clear majority of businesses and charities have a broad range of basic rules and controls in place. The most frequently deployed rules or controls involve cloud back-ups, updated malware protection, passwords, network firewalls and restricted admin rights – each administered by two-thirds or more of businesses. The least common rules and controls are around two-factor authentication (2FA), user monitoring, separated Wi-Fi networks, applying software updates and use of Virtual Private Networks (VPNs).
The following are more common in businesses than in charities – these are statistically significant differences (with exact percentages included in Figure 3.7):
-
data back-ups, both cloud-based and non-cloud
-
updated malware protection
-
password policies
-
network firewalls
-
security controls on the organisation’s devices, or only allowing access via these devices (as opposed to personal devices) – this likely reflects the greater tendency for charity staff and volunteers to be using personal devices due to lower spending on equipment
-
agreed processes for phishing emails
-
policies to apply security updates within 14 days (i.e. patch management).
Figure 3.7: Percentage of organisations that have the following rules or controls in place
| Rule or control in place | Businesses | Charities |
|---|---|---|
| Up-to-date malware protection | 76% | 63% |
| A password policy that ensures that users set strong passwords | 70% | 55% |
| Backing up data securely via a cloud service | 70% | 50% |
| Restricting IT admin and access rights to specific users | 67% | 64% |
| Firewalls that cover the entire IT network, as well as individual devices | 66% | 50% |
| Security controls on organisation-owned devices (e.g. laptops) | 59% | 42% |
| Only allowing access via organisation-owned devices | 55% | 33% |
| An agreed process for staff to follow with fraudulent emails or websites | 48% | 37% |
| Rules for storing and moving personal data securely | 45% | 43% |
| Backing up data securely via other means | 45% | 39% |
| Any Two-Factor Authentication (2FA) for networks/applications | 37% | 27% |
| Separate Wi-Fi networks for staff and visitors | 34% | 26% |
| Monitoring of user activity | 32% | 27% |
| A virtual private network, or VPN, for staff connecting remotely | 31% | 22% |
| A policy to apply software security updates within 14 days | 31% | 22% |
Bases: 2,263 UK businesses, 1,174 charities
Medium and large businesses are more likely than average to have each of these technical rules and controls in place. Specifically across large businesses, around nine in ten have adopted each of the following:
-
data backups, either via the cloud or other means (96%)
-
restricting admin rights (95%)
-
password policies (93%)
-
security controls on their devices (92%)
-
up-to-date malware protection (91%)
-
network firewalls (91%)
-
VPNs (90%)
-
separate Wi-Fi for staff and visitors (89%).
The two areas where a more substantial number of large businesses do not have technical rules and controls are in patch management (66%) and restricting access to organisation-owned devices (69%).
As in previous years, businesses in three sectors are less likely than others to have a range of these rules or controls in place. We have used software security update policies (i.e. patch management) as an example here, but businesses in these sectors fall short on several of the areas mentioned in Figure 3.7:
-
food and hospitality (23% have patch management, vs. 31% of all businesses)
-
entertainment, services, and membership organisations (also 23%)
-
construction (26%).
Trends over time
Compared to 2022, the deployment of the various controls and procedures has fallen among businesses:
-
using up-to-date malware protection (down from 83% to 76% among businesses)
-
password policies (down from 75% to 70%)
-
restricting admin rights (down from 72% to 67%)
-
network firewalls (down from 74% to 66%)
-
agreed processes for phishing emails (down from 57% to 48%)
-
patch management policies (down from 39% to 31%).
Moreover, across the last three waves of the study (which have all taken place after the start of the COVID-19 pandemic), some of these areas have seen consistent declines among businesses. This includes:
-
password policies (79% in 2021, vs. 70% in 2023)
-
network firewalls (78% in 2021 vs. 66% in 2023)
-
restricted admin rights (75% in 2021, vs. 67% in 2023)
-
patch management policies (43% in 2021, vs. 31% in 2023)
It is important to note that these trends mainly reflect shifts in micro businesses and, to a lesser extent, small and medium businesses over time. On each of the technical controls in Figure 3.7, large businesses remain in line with where they were in 2022.
-
Given that micro businesses account for 82%[footnote 7] of the total business population, all the above changes over time are statistically significant for the micro business subgroup. As an example, among micro businesses, the use of up-to-date malware protection has fallen from 81% in 2021 to 74% in 2023.
-
For small businesses specifically, restricted admin rights are less common than in 2022 (down from 87%, to 79% this year).
-
For medium businesses, there have been drops since 2022 in the proportion saying they have security controls on their devices (from 91% to 79%) and agreed processes for phishing emails (from 86% to 78%).
Taken together, these findings highlight an increasing cyber hygiene challenge among small to medium enterprises (SMEs) in the post-pandemic era.
The long-term trend also reflects shifts in ways of working since the pandemic. The proportion of businesses restricting access to business-owned devices has fallen successively over the last four years (from 69% in the 2020, pre-pandemic, study, to 55% this year).
There are relatively few consistent trends from 2022 to 2023 by sector. However, it is worth noting that some of the largest shifts over the past year are among retail and wholesale businesses. For example, the proportion of these businesses saying they have patch management policies has dropped from 41% in 2022 to 29% in this year.
Finally, the following areas have also seen a decline among charities since 2022, mirroring the changes in the business population:
-
using up-to-date malware protection (down from 68% to 63% among charities)
-
network firewalls (down from 56% to 50%).
3.5 Staff training and awareness raising
This survey does not explore cyber security skills and training in detail, given that there is another annual government study dealing with this topic – the cyber security skills series. Nevertheless, staff training is an important aspect of the 10 Steps to Cyber Security guidance, so we continue to estimate the proportion of organisations that have undertaken training or awareness raising activities around cyber security in the past year.
Our results (Figure 3.8) show that in the 12 months prior to the survey, just under two-fifths of businesses (18%) and charities (17%) overall have provided some form of staff training. Historically, this has been much higher in larger organisations. Half of all medium businesses (52%), three-quarters of large businesses (77%) and half (49%) of high-income charities provided this training. Among businesses, the finance and insurance sector stands out, being the sector where such training is most common.
Figure 3.8: Percentage of organisations that have had training or awareness raising sessions on cyber security in the last 12 months
| Businesses overall | 18% |
| Micro businesses | 15% |
| Small businesses | 28% |
| Medium businesses | 52% |
| Large businesses | 77% |
| Within finance and insurance | 48% |
| Within health, social care and social work | 35% |
| Charities overall | 17% |
Bases: 2,263 UK businesses; 1,387 micro businesses; 400 small businesses; 277 medium businesses; 199 large businesses; 178 finance and insurance businesses; 88 health, social care and social work businesses; 1,174 charities
Trends over time
This question was first asked in the 2021 study, giving two years of trend data since the start of the COVID-19 pandemic (with the 2020 study fieldwork taking place before the pandemic). In that time, the proportion of medium and large businesses running training has consistently increased. For example, it was 47% for large businesses in 2021, compared to 61% in 2022 and 77% now. The result for high-income charities has also risen (from 35% in 2021, to 45% in 2022 and 49% now).
The aforementioned cyber security skills study from 2021 (also the first post-pandemic survey in that series) highlighted the pressure that COVID-19 restrictions placed on cyber security training, providing a rationale for the uplift we have seen since then, as restrictions have been lifted. Looking at the results for medium and large businesses in that study across the same years, there has also been a similar trend (although the sample sizes in the Cyber Security Breaches Survey are larger, and allow for more analysis of medium and large businesses).
Qualitative insights on successful staff training approaches and barriers to training
A key theme that emerged from the qualitative interviews was the importance of good communication channels between staff and IT, and two-way feedback loops. For example, one finance business encouraged staff to report suspicious emails to IT, who then reviewed them and shared the outcomes. If the email was not genuine, the IT team would email all staff to highlight the kinds of tell-tale signs to look out for in future emails and would also alert the wider staff. In this way, this business had built a trusting relationship between IT and wider staff.
IT sends around a screenshot of suspicious emails with arrows indicating what to look out for.
– Director, medium business
Developing these close working relationships, raising the profile of IT staff and building a shared understanding of the need for cyber security, as well as the burdens associated with it, were all considered important. For instance, we spoke to organisations running mock phishing exercises and penetration testing. This was not only done to keep staff vigilant, but also to keep the frontline IT team visible, so that staff knew who to contact in case of an issue.
We train people as part of induction. We provide training, it’s mandatory and repeated on a regular basis. We raise issues with staff at all monthly staff meetings. I’ve been harping on about cyber security and giving examples. We keep our profile high with staff – we remind people and do phishing tests, and share the results with staff and other stakeholders
– Business and Resources Director (overseeing Information Security Team), high-income charity
A second theme was around staff being able to imagine the real-world impact of a cyber incident. One business described a successful, attention-grabbing approach by an external training provider – they produced a mock-up of a newspaper article saying that the business had been breached. This helped to reinforce the potential reputational risk.
However, organisations continued to face challenges in promoting a cyber resilient culture among staff. Many of the challenges that emerged during the pandemic, when it became less easy to monitor and control staff behaviour (discussed in previous years of this study) had persisted now that hybrid working was often the norm. Those responsible for cyber security raised, for example, the risks around staff using external drives on work devices outside the office, where the behaviour might remain undetected.
Staff don’t appreciate what the risks are. They do something because it’s convenient.
– Business Technology Officer, large business
Organisations sometimes wanted to deliver more frequent or interactive training, but were held back by a lack of capacity. For example, one large manufacturing business provided mandatory training to new joiners to teach them about phishing, cyber hygiene and data protection, but the IT team lacked the time to provide refresher training.
Another common issue was organisations being unsure how to evaluate training. This made it difficult to demonstrate value for money and, as a result, to get senior management to approve further training. One business described providing staff with introductory and refresher training online that could be accessed whenever staff wanted, but they were unsure how to measure its effectiveness and the impact on staff, beyond crudely counting how many had accessed the different courses.
3.6 Responsibility for cyber security
The job titles of those completing the survey, who are identified by their organisation as being the individual most responsible for cyber security, provide an insight as to the likely seniority and influence of these individuals.
These results do not necessarily show the definitive proportion of organisations that have, for example, a Chief Information Officer (CIO) or Chief Information Security Officer (CISO). In organisations with these functions, we may have been directed to another senior individual with more day-to-day responsibility for cyber security, such as a senior IT colleague.
Generally, the larger the organisation, the more specific the job title of the individual covering cyber security matters. The findings outlined here are all in line with the previous study, when this was first asked:
-
In micro businesses, it is most likely to be a Chief Executive (35%), business owner (11%), or another senior management role (13%). Fewer than one in ten micro businesses have someone specifically in an IT-role looking after cyber security matters (4%).
-
In small businesses, the most common job roles were Chief Executives (18%), general office managers (17%) or those with another (unspecified) senior management role (14%).
-
In a third of large businesses, it is either the IT director (12%) or an IT manager, technician or administrator (20%), looking after cyber security. The respective figures for medium sized businesses are 9 and 12%.
-
In three in ten charities (30%), a trustee performs this function. Within the very largest charities (with an income of £5 million or more), 15% of interviews were completed by an IT Director, similar to the proportion among large businesses.
3.7 Outsourcing of cyber security functions
Just under four in ten businesses (36%) and a quarter of charities (26%) have an external cyber security provider. These overall figures are broadly consistent with those recorded in the previous three surveys, although the specific finding for large businesses has changed (from 60% in 2022 to 37% this year).
As Figure 3.9 shows, outsourcing of cyber security is substantially higher among small and medium businesses, as opposed to micro and large businesses. This pattern has been evidenced in previous years as well (although in 2022 and 2021 it was equally high in medium and large businesses). It is possible that large businesses are relying more this year on internal cyber security expertise than on outsourcing, while small and medium businesses perhaps cannot afford to recruit specialists to the same extent.
High-income charities, on the other hand, tend to be more aligned with medium businesses. Six in ten of these charities (63%, vs. 26% overall) say they outsource aspects of cyber security.
Figure 3.9: Percentage of organisations that have an external cyber security provider
| Businesses overall | 36% |
| Micro businesses | 32% |
| Small businesses | 50% |
| Medium businesses | 58% |
| Large businesses | 37% |
| Within finance and insurance | 62% |
| Within utilities or production | 46% |
| Within professional, scientific and technical | 43% |
| Charities overall | 26% |
Bases: 2,263 UK businesses; 1,387 micro businesses; 400 small businesses; 277 medium businesses; 199 large businesses; 178 finance and insurance businesses; 206 utilities or production businesses; 285 professional, scientific and technical businesses; 1,174 charities
Possibly because they are more likely to have cyber specialists internally, fewer than a quarter (22%) of information and communications businesses use external cyber security providers. By contrast, among finance and insurance businesses, the figure is six in ten (62%, vs. 36% on average).
3.8 Cyber security policies and other documentation
Do organisations formally document their approaches?
Around three in ten businesses (29%) and a third of charities (35%) report having formal cyber security policies in place. To note, these may be part of a wider policy within the organisation, such as the IT policy. Smaller proportions (27% of businesses and 22% of charities) have a business continuity plan that covers cyber security.
Figure 3.10 shows strong differences by size, with the majority of medium and large businesses having each form of documentation.
While the charity results are similar to previous years, the business results suggest a reduction in cyber security documentation since 2022 (when 36% had policies and 34% had cyber security included in business continuity plans). As with the drop in prioritisation covered in Chapter 2, this is primarily focused among micro businesses.
Figure 3.10: Percentage of organisations that have the following kinds of documentation
| Organisation type | A formal policy or policies covering cyber security risks | A business continuity plan that covers cyber security |
|---|---|---|
| Businesses overall | 29% | 27% |
| Micro businesses | 24% | 23% |
| Small businesses | 46% | 41% |
| Medium businesses | 63% | 61% |
| Large businesses | 79% | 79% |
| Charities overall | 35% | 22% |
Bases: 2,263 UK businesses; 1,387 micro businesses; 400 small businesses; 277 medium businesses; 199 large businesses; 1,174 charities
Documentation continues to be more prevalent in three sectors:
-
finance and insurance (63% have cyber risks in business continuity plans, vs. 27% overall, and 55% have cyber policies, vs. 29% overall)
-
health, social care and social work (46% with appropriate continuity plans and 57% with appropriate policies)
-
information and communications (39% with appropriate continuity plans and the same proportion with appropriate policies).
When were policies last reviewed?
Of the 29% of businesses and 35% of charities that have cyber security policies in place, over four in ten (45%) of those businesses and a third (34%) of those charities reviewed these policies within the last six months (Figure 3.11). For businesses, the figure is similar to the last two years, but still below the 2020 survey (the last pre-pandemic survey), when 52% said they had reviewed policies or documentation in the past six months.
Businesses are more likely than charities to have reviewed their policies within the last 12 months (82% of businesses, vs. 64% of charities).
Figure 3.11: When organisations last created, updated, or reviewed their cyber security policies or documentation
| Organisation type | % in the last 3 months | % 3 to under 6 months ago | % 6 to under 12 months ago | % 12 to under 24 months ago | % 24 months ago or earlier | % don’t know | |
|---|---|---|---|---|---|---|---|
| Businesses overall | 25 | 20 | 36 | 9 | 3 | 6 | |
| Charities overall | 19 | 15 | 30 | 15 | 10 | 12 |
Bases: 891 businesses with cyber security policies; 551 charities
What is covered in cyber security policies?
As Figure 3.12 indicates, cyber security policies tend to cover off a range of topics. The aspects most often covered are around data storage and the appropriate use of the organisation’s IT devices. The use of personal devices and of Software as a Service (SaaS) is far less commonly mentioned. This is despite the increasing trend to drop rules insisting on employees only using organisation-owned devices (as noted in Section 3.4).
Businesses are significantly more likely than charities to cover the use of cloud computing in their cyber security policies (63% vs. 54%).
Figure 3.12: Percentage of organisations with cyber security policies that have the following features in their cyber security policies
| Features in cyber security policies | Businesses | Charities |
|---|---|---|
| How data is supposed to be stored | 77% | 72% |
| What staff are permitted to do on organisation’s IT devices | 74% | 64% |
| Remote or mobile working | 64% | 59% |
| Use of cloud computing | 63% | 54% |
| Use of network-connected devices | 58% | 54% |
| What can be stored on removed devices (e.g. USB sticks) | 58% | 53% |
| Use of personally-owned devices for business activities | 50% | 53% |
| Use of Software as a Service | 38% | 37% |
Bases: 891 businesses with cyber security policies; 551 charities
In 2022, the proportion of businesses that covered cloud computing in their cyber security policies fell to 56% after a multi-year upwards trend (52% in 2016, 60% in 2020, and 64% in 2021). The figure for 2023 is once more in line with the upwards trend (at 63%).
It is also worth noting that the proportion of both businesses and charities saying that their cyber policies cover remote or mobile working has not increased since the COVID-19 pandemic (which led to the normalisation of working from home or hybrid working across many organisations). In the 2020 survey (the last one conducted before the start of the pandemic), this was at 66% (vs. 64% now) for businesses and 68% (vs. 59% now) for charities. The charities result has varied across years, without a consistent upwards or downwards trend.
3.9 Cyber accreditations and government initiatives
This section looks at both government and external cyber accreditations and initiatives. It looks at which organisations adhere to specific accreditations. It then combines some of the individual results covered earlier in this chapter, to provide estimates showing how many businesses and charities are fulfilling the range of requirements laid out in two government initiatives – Cyber Essentials and the 10 Steps to Cyber Security.
Cyber Essentials
The government-endorsed Cyber Essentials scheme enables organisations to be independently certified for having met a good-practice standard in cyber security. Specifically, it requires them to enact basic technical controls across five areas:
-
boundary firewalls and internet gateways
-
secure configurations
-
user access controls
-
malware protection
-
patch management (i.e. applying software updates).
Chapter 2 highlighted that there is an overall low awareness of Cyber Essentials among both the business (14%) and charity (15%) populations. Despite this lack of awareness, a slightly higher proportion of businesses do actually have technical controls in these five areas.
Our survey maps the five areas to individual questions. In total, 20% of businesses and 14% of charities report having technical controls in all five areas.[footnote 8] As might be expected, this is considerably higher for medium businesses (42%) and large businesses (61%).
These results have declined in the past two years. In 2021, it was 29% of businesses and 20% of charities that had technical controls in place in the five Cyber Essentials areas. This is a reflection of the analysis presented in Section 3.4, which discussed how many areas of cyber hygiene have dropped back since the start of the COVID-19 pandemic. It is worth noting that these trends are predominantly driven by SMEs, and primarily micro businesses – the scores for large businesses have not fallen.
In a separate question, we also ask organisations if they recognise adhering to either the Cyber Essentials or Cyber Essentials Plus standards. Both ask organisations to implement cyber security measures in the same five areas, but the latter includes an external technical assessment. This year’s results show that 5% of businesses and 4% of charities report adhering to Cyber Essentials (vs. 6% of businesses and charities respectively in 2022). Just 2% of businesses and 1% of charities say they adhere to the Cyber Essentials Plus standard. Among large businesses, this rises to 33% for Cyber Essentials and 14% for Cyber Essentials Plus.
This continues to indicate that some organisations – especially medium and large businesses – are potentially already fulfilling the Cyber Essentials standard, but not getting certified. This may either be as a conscious choice or because they lack awareness. However, as covered in Section 2.3, half of medium businesses (50%) and six in ten large businesses (59%) purport to be aware of Cyber Essentials. When looking across these questions, we find that:
-
8% of medium businesses are aware of the Cyber Essentials scheme, have technical controls in all five areas covered by the scheme, but do not report adhering to the standard
-
12% of large businesses are in the same situation.
Other accreditations
We also ask organisations if they adhere to any of the following standards or accreditations:
-
ISO 27001 – an international standard for an Information Security Management System
-
the Payment Card Industry Data Security Standard (PCI DSS)
-
any National Institute of Standards and Technology (NIST) standards.
Of these, the PCI DSS standard is the most widespread, with around a quarter of businesses (27%) and one in ten charities (10%) adhering to this. The others are far less prevalent, as Figure 3.13 highlights.
While these overall results are lower than in 2022, they are much more in line with when this question was first asked in 2021 (suggesting the findings from last year may have been unusually high).
Figure 3.13: Percentage of organisations adhering to various cyber security standards or accreditations
| Cyber security standard or accreditation | Businesses | Charities |
|---|---|---|
| The Payment Card Industry Data Security Standard (PCI DSS) | 27% | 10% |
| ISO 27001 | 9% | 5% |
| National Institute of Standards and Technology (NIST) standards | 3% | 3% |
Bases: 1,152 UK businesses; 570 charities
The latter two standards in the chart are more common in the large business population:
-
27% of large businesses adhere to ISO 27001
-
15% adhere to NIST standards.
Reflecting the higher propensity to take online payments in certain sectors, there are some notable differences in the use of PCI DSS. A majority of food and hospitality businesses (62%) and relatively large proportions of retail and wholesale businesses (44%), and entertainment, service, or membership organisations (32%) adhere to PCI DSS.
Overall adherence to cyber security standards appears to be similar to that reported for 2021.
Qualitative insights on the motivations behind seeking accreditation
The qualitative interviews touched on the rationale for organisations seeking accreditation, among organisations that had done so. Across interviews, organisations spoke about Cyber Essentials and ISO 27001 in the main. We also attempted to explore the NCSC’s Cyber Assessment Framework, but none of the organisations we spoke to were aware of this.
Both Cyber Essentials and ISO 27001 were viewed positively. The latter was considered as more internationally recognised than the former, but other than this distinction, the choice of accreditation was largely driven by what organisations and their clients were aware of. We did, however, encounter one high-income charity that suggested Cyber Essentials was too prescriptive for charities, because of the requirements around endpoint devices:
All end point user devices are included. You have to manage anything that has access to your information and, with a lot of volunteers and low budgets, we are not buying phones for everyone, so that didn’t work well. Instead, I based our framework on the 10 Steps from NCSC, and broke it down to what was actionable and what was recommended.
– Information Security Strategic Lead, high-income charity
The overall reasons for seeking accreditation reflected themes that have been raised in previous years of this study:
- Demand from clients – one mid-sized marketing agency required Cyber Essentials to be able to win public sector contracts, since public sector clients demanded this accreditation. They felt that this would signal the cyber security standards they already achieved rather than serving to raise their standards. This stipulation from clients was also raised among other interviewees, such as the following engine manufacturing business:
We’re about to apply for Cyber Essentials. Our customers are beginning to require it.
– IT Area Manager, large business
-
Providing readily available documentation and evidence – one creative agency had opted for ISO 27001, because they knew that achieving this accreditation would generate a standardised set of documentation on their cyber security standards. In this case, the accreditation itself was not demanded by their clients, but they found that supplier questionnaires often asked for evidence of cyber security. They felt that having the ISO 27001 standard would make it easier to complete these supplier questionnaires, therefore speeding up the process of bringing on board new clients.
-
Enforcing a change in the staff culture – one large organisation suggested their adoption of Cyber Essentials Plus had caused a great deal of disruption among staff, who previously adhered to relatively few rules and controls on their devices, and had now been forced to work within minimum cyber security standards. The organisation had used news stories about cyber security breaches to explain the need for these new rules to staff.
-
For peace of mind for stakeholders – one food charity suggested that holding Cyber Essentials accreditation was a marker that they were doing the right thing. This helped them to provide peace of mind to their members.
10 Steps to Cyber Security
The 10 Steps to Cyber Security is government guidance that breaks down the task of protecting an organisation into 10 key components. It is intended to provide an acceptable level of cyber hygiene to mitigate against most attacks. It is not, however, an expectation that organisations fully apply all the 10 Steps – this will depend on each organisation’s ways of working.
These steps have been mapped to several specific questions in the survey (in Table 3.1), bringing together findings that have been individually covered across the rest of this chapter. This is not a perfect mapping – some of the Steps are overlapping and require organisations to undertake action in the same areas – but it gives an indication of whether organisations have taken relevant actions on each Step. This is regardless of whether they are actually aware of the 10 Steps guidance (covered earlier in Section 2.3).
This year, Ipsos engaged Professor Steven Furnell from the University of Nottingham to review how the questionnaire was mapped to the 10 Steps guidance, and suggest a more accurate and robust mapping. The rationale included:
-
ensuring that the Steps are kept mutually exclusive (so an organisation cannot automatically fulfil one step by fulfilling another)
-
setting an appropriately high bar for fulfilling each Step
-
streamlining the mapping.
The 10 Steps are actions that all organisations can take, but the guidance is specifically aimed at medium to large organisations. As such, we have also pulled out the results for medium and large businesses in Table 3.1.
As a result of this changed mapping, the figures in Table 3.1 are not directly comparable to the equivalent table from previous years. Nevertheless, we have retrospectively applied this new mapping to last year’s results, to allow for a year-on-year comparison. To be clear, the figures in Table 3.1 should not be compared against the equivalent table from last year’s report. Where differences against 2022 are shown in the table, these are statistically significant changes using the new mapping.
Table 3.1: Percentage of organisations undertaking key actions in each of the 10 Steps areas
| Step description – and how derived from the survey | Businesses | Medium businesses | Large businesses | Charities |
|---|---|---|---|---|
| 1 Risk management – organisations have undertaken a cyber security risk assessment | 29% (vs. 33% in 2022) | 51% | 63% | 27% |
| 2 Engagement and training – organisations have carried out staff training or awareness raising activities | 18% | 52% (vs. 39% in 2022) | 77% (vs. 61% in 2022) | 17% |
| 3 Asset management – organisations have a list of critical assets | 26% | 52% | 66% | 28% |
| 4 Architecture and configuration – organisations have at least three of the following technical rules or controls: up-to-date malware protection, network firewalls, restricted IT admin and access rights, security controls on organisation-owned devices, only allowing access via organisation-owned devices, separate Wi-Fi networks for staff and visitors, specific rules for personal data storage and transfer, or a VPN[footnote 9] | 75% | 94% | 96% | 59% |
| 5 Vulnerability management – organisations have policy to apply software security updates within 14 days | 31% (vs. 39% in 2022) | 49% | 66% | 22% |
| 6 Identity and access management – organisations have any requirement for two-factor authentication when people access the organisation’s network, or for applications they use | 37% | 67% | 80% | 27% |
| 7 Data security – organisations have cloud backups or other kinds of backups | 83% (vs. 87% in 2022) | 95% | 97% | 67% (vs. 74% in 2022) |
| 8 Logging and monitoring – organisations fulfil at least one of the following criteria: using specific tools designed for security monitoring, such as Intrusion Detection Systems, or doing any monitoring of user activity | 48% | 75% | 91% | 36% (vs. 43% in 2022) |
| 9 Incident management – organisations have a formal incident response plan, or at least three of the following: written guidance on who to notify of breaches, roles or responsibilities assigned to specific individuals during or after an incident, external communications and public engagement plans, guidance around when to report incidents externally | 25% | 52% | 71% | 22% (vs. 29% in 2022) |
| 10 Supply chain security – organisations monitor risks from suppliers or their wider supply chain | 14% | 29% | 56% | 12% |
The vast majority of businesses (91%) and charities (79%) have undertaken key action against at least one of the 10 Steps. Around two-fifths of businesses (37%) and three in ten charities (30%) have taken action on 5 or more of the 10 Steps, as Figure 3.14 shows. This is also much higher in large businesses, nine in ten (89%) of which have progressed at least 5 of these steps and a fifth (20%) of which have taken action in all 10 areas.
There is evidently a substantial gap between the proportion of large businesses taking action in at least 5 of the 10 Steps, and the proportion taking action in all 10. Around two-thirds (64%) have taken action in 8 or more Steps, while just over two-fifths (44%) have taken action in at least 9 of these 10. Looking at Table 3.1, supply chain security is the main area for improvement for large organisations.
Figure 3.14: Percentage of organisations that have undertaken action in half or all the 10 Steps guidance areas
| Organisation type | Undertaken 5 or more of the 10 steps | Undertaken all the 10 steps |
|---|---|---|
| Businesses overall | 37% | 2% |
| Micro businesses | 32% | 2% |
| Small businesses | 52% | 3% |
| Medium businesses | 75% | 7% |
| Large businesses | 89% | 20% |
| Charities overall | 30% | 2% |
Bases: 2,263 UK businesses; 1,387 micro businesses; 400 small businesses; 277 medium businesses; 199 large businesses; 1,174 charities
Chapter 4: Prevalence and impact of breaches or attacks
This chapter explores the nature, extent and impact of cyber attacks and other cyber security breaches on organisations over the past year. We also provide broad estimates of the financial cost of these breaches and attacks.
The chapter only covers quantitative findings. This year’s qualitative interviews did not explore the impact of breaches or attacks on organisations in detail. This reflected the fact that a separate DCMS (now DSIT) study focusing on this topic was published in 2022.
Across these findings, the survey aims to account for all the types of breaches or attacks that organisations might face. This includes accidental breaches, as well as ones perpetrated intentionally. It also includes recorded cyber attacks that did not necessarily get past an organisation’s defences (but attempted to do so). We do, nevertheless, isolate and discuss the cases that had a material outcome, such as a loss of money, assets, or other data.
It is important to remember that the survey can only measure the breaches or attacks that organisations have themselves identified. There are likely to be hidden attacks, and others that go unidentified, so the findings reported here may underestimate the full extent of the problem.
To note, there is a separate chapter (Chapter 6), new for this year, that covers similar statistics on prevalence and financial impact specifically for cyber crime, as well as the prevalence of fraud that occurred as a result of cyber crime. These are a subset of all cyber security breaches and attacks.
Note on comparability to previous years
The findings across this chapter are not comparable with those from the 2016 survey, where the initial question on breaches was asked as a yes or no question. This meant there have been significant changes in the types of breaches or attacks being recorded from 2017 onwards.
In 2021, we substantially changed the way we capture the cost of cyber security breaches within the survey, in order to get more accurate estimates. Therefore, we do not make direct comparisons to data from before 2021, but do comment on the broad pattern of the data in relation to previous years.
4.1 Identified breaches or attacks
Around a third of businesses (32%) and a quarter of charities (24%) report having experienced any kind of cyber security breach or attack in the last 12 months (Figure 4.1). This accounts for approximately 462,000 businesses and 48,000 registered charities – although these estimates, like all survey results, will be subject to a margin of error (see Appendix A).[footnote 10]
The survey does not directly ask whether organisations have experienced a breach or attack – an approach which would be subject to considerable recall errors. Instead, these percentages are based on calculating the proportions of businesses and charities that identified any of 10 specific types of breaches or attacks (listed in Figure 4.2), as well as an option allowing organisations to state any other type of breach or attack besides these 10.
Larger businesses are more likely to identify breaches or attacks than smaller ones – this has been a consistent pattern in each year of the survey. High-income charities (56% of those incomes of £500,000 or more) and those with very high incomes (76% of those with £5 million or more) are also significantly more likely to record any breaches or attacks, in line with previous years.
Figure 4.1: Percentage of organisations that have identified breaches or attacks in the last 12 months
| Businesses overall | 32% |
| Micro businesses | 31% |
| Small businesses | 32% |
| Medium businesses | 59% |
| Large businesses | 69% |
| Within professional, scientific and technical | 49% |
| Within information and communications | 43% |
| Charities overall | 24% |
Bases: 2,263 UK businesses; 1,387 micro businesses; 400 small businesses; 277 medium businesses; 199 large businesses; 285 professional, scientific and technical businesses; 161 information and communications businesses; 1,174 charities
As Figure 4.1 shows, information and communications businesses, and professional, scientific and technical businesses are more likely than average to have identified breaches or attacks this year. The only regional difference of note is a higher proportion of breaches or attacks identified by businesses in the South West (40%, vs. 32% overall).
Types of breaches or attacks identified
Figure 4.2 shows the types of breaches and attacks that organisations report having, among those that have identified any in the last 12 months. The most common by far is phishing – defined in the context of this survey as staff receiving fraudulent emails or being directed to fraudulent websites. This is followed, to a much lesser extent, by others impersonating organisations in emails or online and then viruses or other malware.
One of the consistent lessons across this series of surveys has been the importance of organisations ensuring that their staff are aware of the risks, through training and other awareness raising activities. This reflects that most cyber actors use social engineering techniques, as evidenced in the high prevalence of phishing attacks, to gain access to the target organisation’s networks.
Figure 4.2: Percentage that have identified the following types of breaches or attacks in the last 12 months, among the organisations that have identified any breaches or attacks
| Type of breach or attack in the last 12 months | Businesses | Charities |
|---|---|---|
| Phishing attacks | 79% | 83% |
| Others impersonating organisation in emails or online | 31% | 29% |
| Viruses, spyware or malware (excluding ransomware) | 11% | 9% |
| Hacking or attempted hacking of online bank accounts | 11% | 6% |
| Takeovers of organisation’s or users’ accounts | 9% | 5% |
| Denial of service attacks | 7% | 7% |
| Ransomware | 4% | 4% |
| Unauthorised accessing of files or networks by staff | 2% | 4% |
| Unauthorised accessing of files or networks by outsiders | 2% | 2% |
| Unauthorised listening into video conferences or instant messages* | 0.5% | 1% |
| Any other breaches or attacks | 4% | 4% |
Bases: 887 businesses that identified a breach or attack in the last 12 months; 435 charities
*Values greater than 0% but too small to be rounded up to 1% are shown as 0.5%.
Among the organisations identifying any breaches or attacks, approximately half (48% of these businesses and 54% of these charities) say they have only experienced phishing attacks and no other kinds of breaches or attacks. This falls to a third among the large businesses (33%) and a similar proportion among the medium businesses (36%) that have identified any incidents – highlighting that larger organisations also experience a greater variety of cyber incidents.
Specifically, medium and large organisations are more likely to report:
-
phishing attacks (93% of large businesses and 84% of medium businesses, vs. 79% overall)
-
impersonation (60% and 59% respectively, vs. 31% overall)
-
malware (23% of large businesses, vs. 11% overall)
-
unauthorised access by people within the organisation (20% of large businesses, vs. 2% overall)
-
unauthorised access by people outside the organisation (10% of large businesses, vs. 2% overall).
Trends over time
Compared to the 2022 study, there has been a decline in the proportion of businesses and charities reporting any breaches or attacks, as Figure 4.3 illustrates. For businesses, this may be part of a longer-term decline in the proportion identifying breaches or attacks since 2017, with the 2019 result being considered an outlier. This is also the first year that identification of breaches or attacks has decreased for charities.
For wider context, another major government survey looking at cyber crimes among individuals – a more specific subset of all cyber security breaches and attacks – has evidenced a similar trend. The latest published Crime Survey for England and Wales (CSEW) for the Office for National Statistics, in the 12 months up to the end of September 2022, finds that computer misuse offences (i.e. cyber crimes) decreased among individuals by 21% since March 2020, mainly driven by a decline in computer virus incidents. To note, the Cyber Security Breaches Survey also covers estimates of cyber crimes among organisations in Chapter 6. However, we do not have trend data, as this is the first year these estimates have been produced.
Figure 4.3: Percentage of organisations over time identifying any breaches or attacks
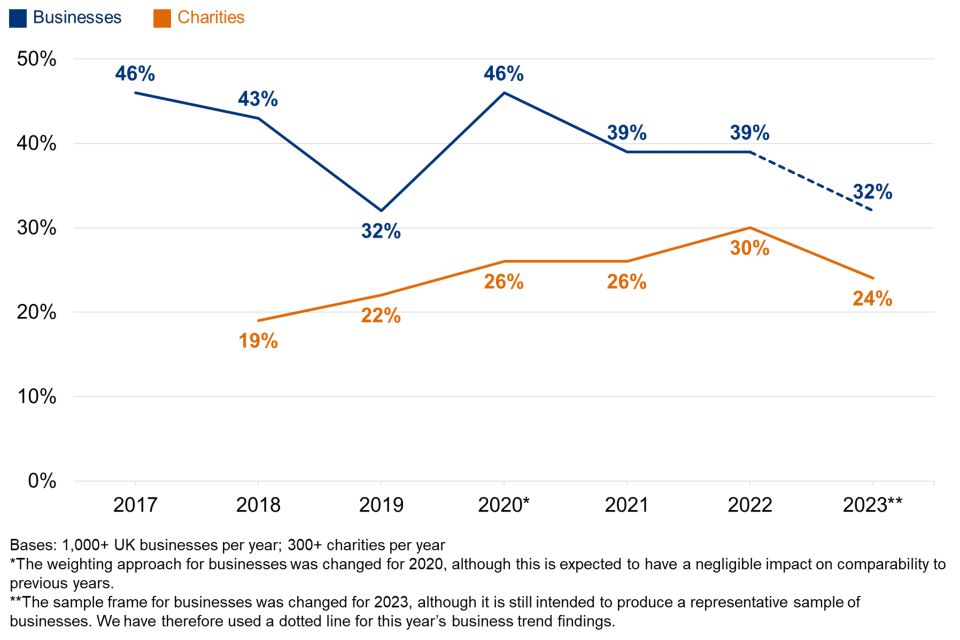
It is worth noting that the decline in breaches or attacks identified in the Cyber Security Breaches Survey is driven by micro and small businesses (down respectively from 36% and 48% in 2022, to 31% and 32% this year) – the results for medium and large businesses are not significantly different from last year (when it was 59% for medium businesses and 72% for large businesses, vs. 59% and 69% respectively this year).
The trend appears to be consistent across sectors, including the sectors that have typically had more sophisticated cyber security approaches (so may be considered to have better monitoring). For example, 36% of finance and insurance businesses have identified breaches or attacks this year, compared with 54% in 2022.
As discussed in detail in previous iterations of the survey, there are a range of possible reasons for the long-term decline in identified cyber incidents. It could simply be due to a reduction in cyber attacks, although this runs counter to the way many organisations – particularly large organisations – in the qualitative interviews discussed the cyber threat as either persistent or rising. It could also be a change in attacker behaviour, with the focus moving away from smaller organisations to larger ones.
Alternatively, it may be that smaller organisations are now less capable of identifying breaches or attacks than they were three years ago. This could be due to internal factors, such as the fall in logging and monitoring activity among charities this year (as shown in Table 3.1) and the lower prioritisation placed on cyber security by senior managers in smaller organisations (covered in Section 2.1). Therefore, the issue of organisations underreporting breaches or attacks in the survey, due to not identifying them, could be greater now than before.
The top three types of cyber security breach or attack have remained consistent since 2017 (i.e. since the question was first asked in this form). However, the pattern of responses is now very different from the 2017 survey. Changes from 2017 to 2023 include:
-
a rise in phishing attacks (from 72% to 79%) – although this is lower than in 2022 (when it was 83%)
-
a fall in viruses or other malware (from 33% to 11%)
-
a fall in ransomware (from 17% to 4%).
The relative proportions of each breach or attack type have been broadly consistent since the 2020 survey, which gives us a good level of confidence in these results, while also highlighting the prevalence of social engineering.
4.2 The breaches or attacks considered most disruptive
Among the organisations that report having had breaches or attacks in the past 12 months, phishing attacks are commonly considered the most disruptive types of attack that organisations face (by 56% of the businesses and 62% of the charities that identify any breaches or attacks).
It is therefore worth looking specifically at the organisations that report any other breaches in addition to phishing attacks, and what this subgroup of organisations consider to be the most disruptive types of breaches or attacks they have faced. Figure 4.4 shows that, even among this group, phishing attacks are still considered as being the most disruptive to organisations, but impersonation attacks can also be highly disruptive, although they are less prevalent.
Figure 4.4: Percentage that report the following types of breaches or attacks as the most disruptive, excluding the organisations that have only identified phishing attacks in the last 12 months
| Most disruptive type of breach or attack in the last 12 months | Businesses | Charities |
|---|---|---|
| Phishing attacks | 59% | 64% |
| Others impersonating organisation in emails or online | 35% | 41% |
| Hacking or attempted hacking of online bank accounts | 15% | 9% |
| Takeovers of organisation’s or users’ accounts | 15% | 13% |
| Viruses, spyware or malware (excluding ransomware) | 14% | 11% |
| Denial of service attacks | 8% | 11% |
| Unauthorised accessing of files or networks by outsiders | 3% | 1% |
| Ransomware | 2% | 5% |
| Unauthorised accessing of files or networks by staff | 1% | 3% |
| Unauthorised listening into video conferences or instant messages | 0% | 0% |
| Any other breaches or attacks | 4% | 6% |
Bases: 359 businesses that identified a breach or attack aside from a phishing attack in the last 12 months; 162 charities
Time taken to recover from their most disruptive breach or attack
When considering their most disruptive breach or attack, the vast majority of businesses (88%) and charities (84%) report being able to restore their operations within 24 hours. Furthermore, seven in ten businesses (71%) and charities (68%) say it took no time at all to recover, shown in Figure 4.5. This is similar to the 2022 results, highlighting that many of these cyber attacks are ultimately unsuccessful, i.e. they do not overcome an organisation’s defences.
Figure 4.5: How long it took organisations to restore operations back to normal after their most disruptive breach or attack was identified
| Organisation type | % no time at all | % less than a day | % less than a week | % less than a month | % one month or more (or still not back to normal) | % don’t know | |
|---|---|---|---|---|---|---|---|
| Businesses overall | 71 | 17 | 6 | 2 | 2 | 2 | |
| Charities overall | 68 | 16 | 10 | 1 | 2 | 3 |
Bases: 837 businesses that recalled their most disruptive breach or attack in the last 12 months; 418 charities
4.3 Frequency of breaches or attacks
Among those identifying any breaches or attacks in the previous 12 months, four in ten businesses (40%) and a similar proportion of charities (38%) say this happens once a month or more often and a fifth of businesses (21%) charities (19%) say they experience breaches or attacks at least once a week. The full results are shown in Figure 4.6.
Figure 4.6: How often organisations have reported breaches or attacks in the last 12 months
| Organisation type | % only once | % less than once a month | % once a month | % once a week | % once a day | % several times a day | % don’t know | |
|---|---|---|---|---|---|---|---|---|
| Businesses overall | 28 | 29 | 19 | 11 | 5 | 6 | 3 | |
| Charities overall | 29 | 28 | 19 | 11 | 4 | 4 | 5 |
Bases: 887 businesses that identified a breach or attack in the last 12 months; 435 charities
Compared to 2022, more businesses (28%, vs. 21% in 2022) and charities (29%, vs. 21% in 2022) now say they have only identified one breach or attack in the last 12 months. However, the longer-term trends still indicate that cyber incidents have become more frequent events across the past few years – in 2017, 37% of the businesses identifying any breaches or attacks could only recall one in the previous 12 months.
4.4 How are businesses affected
Outcomes of breaches or attacks
Among the 32% of businesses that identify breaches or attacks, a quarter (24%) experience at least one of the negative outcomes listed on Figure 4.7, such as a loss of money or data. Among the 24% of charities identifying breaches or attacks, two in ten (18%) have negative outcomes. These results are broadly in line with the 2022 and 2021 studies.
Disruption to websites, and the temporary loss of access to files or networks are the most commonly reported outcomes. However, as Figure 4.7 indicates, cyber incidents that overcome defences can have a wide range of outcomes.
Figure 4.7: Percentage that had any of the following outcomes, among the organisations that have identified breaches or attacks in the last 12 months
| Outcomes of breaches or attacks in the last 12 months | Businesses | Charities |
|---|---|---|
| Any listed outcome | 24% | 18% |
| Website, or online services taken down or made slower | 8% | 7% |
| Temporary loss of access to files or networks | 8% | 6% |
| Money stolen | 7% | 2% |
| Software or systems corrupted or damaged | 5% | 3% |
| Lost access to relied-on third-party services | 4% | 3% |
| Personal data altered, destroyed or taken | 4% | 1% |
| Compromised accounts or systems used for illicit purposes | 3% | 3% |
| Damage to physical devices or equipment | 3% | 2% |
| Permanent loss of files (not personal data) | 2% | 2% |
| Lost or stolen assets, trade secrets or intellectual property* | 1% | 0.5% |
| Money was paid as a ransom* | 0.5% | 0% |
Bases: 887 businesses that identified a breach or attack in the last 12 months; 435 charities
*Values greater than 0% but too small to be rounded up to 1% are shown as 0.5%.
These outcomes are all slightly more prevalent among large businesses. Among those that have identified any breaches or attacks, 33% of large businesses have had some sort of negative outcome from these (vs. 24% of businesses overall). Among these large businesses, 8% report user accounts being compromised (vs. 3% overall) and 4% say assets, trade secrets or intellectual property was stolen (vs. 1% overall).
Nature of the impact
Even breaches that do not result in negative financial consequences or data loss can still have an impact on organisations. Almost two-fifths of businesses (37%) and charities (38%) that have had any breaches or attacks report being impacted in at least one of the ways noted in Figure 4.8.
Most commonly, breaches or attacks lead to organisations having to redirect staff resources to deal with the breach, or having to take up new measures to prevent or protect against future cases.
Figure 4.8: Percentage that were impacted in any of the following ways, among the organisations that have identified breaches or attacks in the last 12 months
| Impact of breaches or attacks in the last 12 months | Businesses | Charities |
|---|---|---|
| Any listed impact | 37% | 38% |
| Added staff time to deal with breach or inform others | 23% | 26% |
| New measures needed for future attacks | 21% | 23% |
| Stopped staff carrying out daily work | 11% | 11% |
| Other repair or recovery costs | 6% | 6% |
| Prevented provision of goods and services | 4% | 2% |
| Loss of revenue or share value | 3% | 2% |
| Complaints from customers | 3% | 2% |
| Discouraged from carrying out intended future business activity | 3% | 1% |
| Reputational damage | 2% | 2% |
| Goodwill compensation to customers* | 1% | 0.5% |
| Fines or legal costs* | 1% | 0.5% |
Bases: 887 businesses that identified a breach or attack in the last 12 months; 435 charities
*Values greater than 0% but too small to be rounded up to 1% are shown as 0.5%.
As in previous years, the impact is most substantial for large businesses. For example:
-
37% needed extra staff time to deal with breaches (vs. 23% of all the businesses identifying breaches or attacks)
-
32% of large businesses say they have had to take up new measures to prevent or protect against future attacks (vs. 21% overall)
-
24% have had staff stopped from carrying out their day-to-day work (vs. 11% overall).
Trends over time (in impact and recovery times)
This section brings together trends over time for the perceived impact of all cyber security breaches or attacks that organisations have identified in the last 12 months (from Figure 4.8), and for the recovery time from their most single disruptive breach in that period (from the earlier Figure 4.5).
For a time, as Figure 4.9 shows, there was a trend in this survey series of businesses apparently becoming more resilient to cyber incidents. From 2017 to 2020 (the last pre-pandemic survey), the proportion of businesses saying it took no time at all for them to recover rose, and the proportion saying the incident had an impact on them fell. Since this point, post-pandemic, this trend has flattened. The trend possibly suggests that organisations are not making the same strides forward in cyber security that they once were – for example, with the increase in governance measures and rules following GDPR implementation in the 2019 study.
Figure 4.9: Percentage of businesses over time that have been affected by breaches or attacks in the following ways, among those that have identified any breaches or attacks in the last 12 months
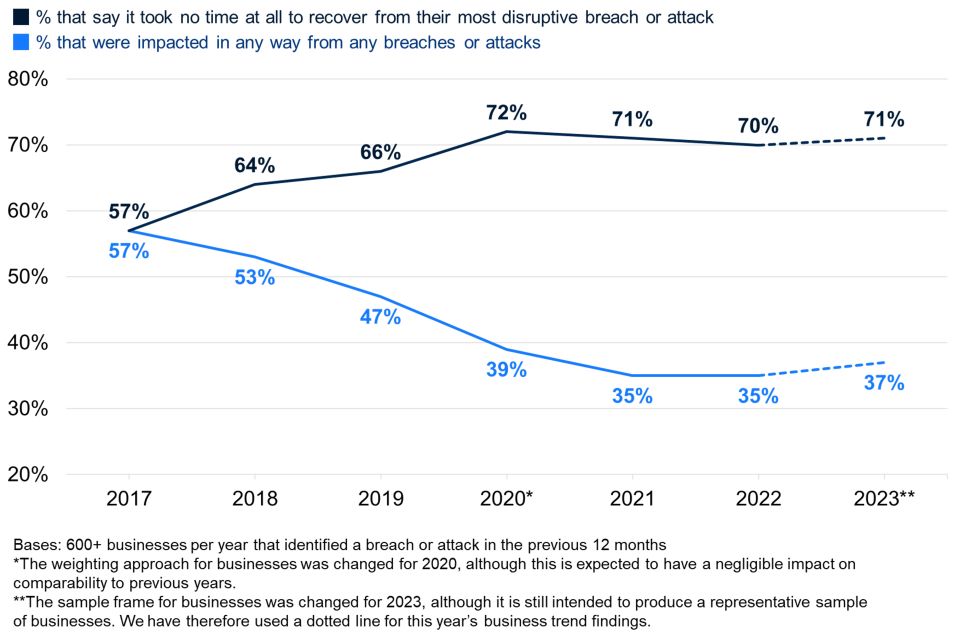
4.5 Financial cost of breaches or attacks
Each year, this survey series has attempted to capture the cost of cyber security breaches or attacks on organisations. This previously included an overarching question covering the cost of all breaches or attacks faced in the last 12 months, which has been removed this year. This was, in part, to make space for the new cyber crime questions covered in Chapter 6, which also include estimates for the financial cost of cyber crime.
We continue to ask the more granular questions breaking down different aspects of the cost of the single most disruptive breach or attack that organisations recall facing in this period. Tables 4.1 to 4.4 show these cost estimates. Table 4.5 brings together these granular breakdowns for an overall cost estimate for the most disruptive breach. These are presented for all organisations experiencing breaches or attacks, as well as those with an actual outcome, such as a loss of assets or data. The latter subgroup of organisations tend to face higher costs, as these tables show.
In these tables, in order to allow for a bigger sample size for more robust estimates, we combine micro and small businesses, as well as medium and large businesses.
To note, the way these cost estimates are compiled was substantially changed in the 2021 survey, so they cannot be compared to results from earlier years (i.e. before 2021).
Firstly, we cover the short-term direct costs of the most disruptive breach or attack. In the survey, we defined these as being any external payments that were made when the breach was being dealt with. This includes, as examples offered to respondents:
-
any payments to external IT consultants or contractors to investigate or fix the problem
-
any payments to the attackers, or money they stole.
Table 4.1: Average short-term direct cost of most disruptive breach or attack from the last 12 months[footnote 11]
| Across organisations identifying any breaches or attacks | All businesses | Micro/small businesses | Medium/large businesses | All charities |
| Mean cost | £410 | £370 | £1,190 | £220 |
| Median cost | £0 | £0 | £0 | £0 |
| Base | 795 | 532 | 263 | 396 |
| Only across organisations identifying breaches with an outcome | All businesses | Micro/small businesses | Medium/large businesses | All charities |
| Mean cost | £1,630 | £1,450 | £4,250 | £1,130 |
| Median cost | £0 | £0 | £0 | £0 |
| Base | 193 | 119 | 74 | 76 |
We defined long-term direct costs as external payments in the aftermath of the breach incident.
The examples included in the survey were:
-
any payments to external IT consultants or contractors to run cyber security audits, risk assessments or training
-
the cost of new or upgraded software or systems
-
recruitment costs if you had to hire someone new
-
any legal fees, insurance excess, fines, compensation, or PR costs related to the incident.
Table 4.2: Average long-term direct cost of most disruptive breach or attack from the last 12 months
| Across organisations identifying any breaches or attacks | All businesses | Micro/small businesses | Medium/large businesses | All charities |
| Mean cost | £150 | £80 | £1,260 | £80 |
| Median cost | £0 | £0 | £0 | £0 |
| Base | 792 | 534 | 258 | 395 |
| Only across organisations identifying breaches with an outcome | All businesses | Micro/small businesses | Medium/large businesses | All charities |
| Mean cost | £410 | £230 | £3,040 | £310 |
| Median cost | £0 | £0 | £0 | £0 |
| Base | 189 | 118 | 71 | 74 |
We also asked about the costs of any staff time (i.e. indirect costs of the breach). This includes, for instance, how much staff would have got paid for the time they spent investigating or fixing any problems caused by the breach. We explicitly asked respondents to include the cost of this time regardless of whether this duty was part of the staff member’s job function or not.
Table 4.3: Average staff time cost of the most disruptive breach or attack from the last 12 months
| Across organisations identifying any breaches or attacks | All businesses | Micro/small businesses | Medium/large businesses | All charities |
| Mean cost | £220 | £190 | £900 | £220 |
| Median cost | £0 | £0 | £0 | £0 |
| Base | 767 | 522 | 245 | 384 |
| Only across organisations identifying breaches with an outcome | All businesses | Micro/small businesses | Medium/large businesses | All charities |
| Mean cost | £630 | £490 | £2,670 | £890 |
| Median cost | £148 | £100 | £474 | £30 |
| Base | 190 | 116 | 74 | 74 |
Finally, we asked about other indirect costs related to breaches, including the following areas (offered as examples to respondents):
-
the cost of any time when staff could not do their jobs
-
the value of lost files or intellectual property
-
the cost of any devices or equipment that needed replacing.
Table 4.4: Average indirect cost of the most disruptive breach or attack from the last 12 months
| Across organisations identifying any breaches or attacks | All businesses | Micro/small businesses | Medium/large businesses | All charities |
| Mean cost | £340 | £260 | £1,880 | £30 |
| Median cost | £0 | £0 | £0 | £0 |
| Base | 794 | 537 | 257 | 399 |
| Only across organisations identifying breaches with an outcome | All businesses | Micro/small businesses | Medium/large businesses | All charities |
| Mean cost | £1,240 | £890 | £6,590 | £70 |
| Median cost | £0 | £0 | £0 | £0 |
| Base | 193 | 120 | 73 | 76 |
Table 4.5 combines the estimates across all the areas of costs covered in the survey (direct costs, staff time and other indirect costs). The figures here can be considered the average total cost that organisations have faced from their single most disruptive breach.
Table 4.5: Average total cost of the most disruptive breach or attack from the last 12 months
| Across organisations identifying any breaches or attacks | All businesses | Micro/small businesses | Medium/large businesses | All charities |
| Mean cost | £1,110 | £870 | £4,960 | £530 |
| Median cost | £0 | £0 | £0 | £0 |
| Base | 816 | 544 | 272 | 404 |
| Only across organisations identifying breaches with an outcome | All businesses | Micro/small businesses | Medium/large businesses | All charities |
| Mean cost | £3,770 | £2,950 | £15,800 | £2,310 |
| Median cost | £360 | £330 | £1,200 | £260 |
| Base | 201 | 123 | 78 | 78 |
Commentary on the financial costs
The following key findings should be noted from these cost tables (Tables 4.1 to 4.5):
-
Statistical significance testing across years shows that these estimates are not notably different from those in 2022. However, when comparing this year and last year to the 2021 results, the average staff time costs (from Table 4.3) have fallen for smaller businesses.[footnote 12] In 2021, the average staff time cost of the most disruptive breach for micro and small businesses (at 2021 prices) was approximately £760 (rounded to the nearest £10). Among micro and small businesses that had breaches with outcomes, it was approximately £2,770 in 2021. These estimates have now dropped to approximately £190 and £490 respectively. The staff time costs may have been higher in 2021 (the first survey following the start of the COVID-19 pandemic), as organisations may have been facing more significant disruption with breaches during the pandemic.
-
The immediate direct costs of a cyber security incident (Table 4.1) are viewed by micro and small businesses as being much higher than the costs in the aftermath of an incident (Table 4.2). This was also the case in 2022. This could be because immediate costs (e.g. the payment of a ransom) are easier to calculate and more tangible than the more long-term costs in the aftermath.
-
As in previous years, businesses tend to identify higher costs than charities. This does not necessarily mean that charities face a lower risk – it could be that they tend to have a less comprehensive understanding of the cost implications, so report lower costs.
-
The median cost is typically £0 across businesses and charities – also a similar pattern to previous years. This reflects the fact that, for most breaches or attacks, organisations do not identify any material outcome (a loss of assets or data), so do not always recognise the need for a response. An area of exception, where the median cost is not £0, is the staff time cost among businesses and charities that experienced an outcome from their most disruptive breach.
Chapter 5: Dealing with breaches or attacks
This chapter explores how well businesses and charities deal with breaches or attacks, including identification, response, reporting and adaptation to prevent future cases.
In the survey, questions on this topic were generally framed in terms of the most disruptive breach or attack an organisation had faced in the last 12 months. Most of this chapter is therefore only based on the 32% of business and 24% of charities that have identified breaches or attacks (unweighted sample sizes of 887 and 435 respectively), rather than the full sample. Consequently, the size and sector subgroups tend to have very small sample sizes, and subgroup analysis is featured much less in this chapter.
The questions on incident response and ransomware in the first sections are, however, asked of the full sample.
5.1 Incident response
Figure 5.1 shows the actions organisations say they take, or would take, in response to a cyber incident – this is a prompted list. By far the top response is to inform senior management. It is far less common for organisations to say they would inform regulators – perhaps expected, given that not all sectors are regulated to the same extent. Around six in ten say they take, or would take, each of the other listed actions (except for informing insurance providers).
To note, the result for informing insurance providers is specifically taken from the 43% of businesses and 27% of charities that have any form of cyber insurance. In total, 69% of these businesses and 66% of these charities say they would inform their provider. This is one of the aspects of incident response that organisations say is most likely to depend on the perceived severity of the breach (12% of businesses and 13% of charities say this) – for the other actions shown in Figure 5.1, it is typically around 3% to 5% of organisations saying these would depend on the severity of the breach.
Figure 5.1: Percentage of organisations that say they take, or would take, the following actions following a cyber security incident
| Actions that organisations take, or would take, following a cyber security incident | Businesses | Charities |
|---|---|---|
| Inform your directors or trustees of the incident | 80% | 76% |
| Inform your cyber insurance provider (among those with insurance)* | 69% | 66% |
| Keep an internal record of incidents | 62% | 69% |
| Assess the scale and impact of the incident | 62% | 68% |
| Formal debriefs or discussions to log any lessons learnt | 59% | 61% |
| Inform a regulator of the incident when required | 57% | 60% |
| Attempting to identify the source of the incident | 57% | 52% |
Bases: 2,263 UK businesses; 1,174 charities
*This code is based on the 475 businesses and 281 charities that have some form of cyber insurance.
Figure 5.2 shows the documentation, guidance and processes that organisations have in place for such incidents – again, this is a prompted list in the survey. While a large majority of organisations say in Figure 5.1 that they will take several actions following a cyber incident, in reality a minority have agreed processes already in place to support this. The most common processes, mentioned by between a quarter and a third of businesses and charities, are having specific roles and responsibilities assigned to individuals, having guidance on external reporting, and guidance on internal reporting. Formal incident response plans are relatively rare, when looking across all organisations (21% of businesses and 16% of charities have one in place).
The results in both Figure 5.1 and 5.2 are in line with last year, when this question was first asked.
Figure 5.2: Percentage of organisations that have the following measures in place for dealing with cyber security incidents
| Measures for dealing with cyber security incidents | Businesses | Charities |
|---|---|---|
| Roles or responsibilities assigned to individuals during or after incident | 36% | 34% |
| Guidance for when to report externally (e.g. to regulators or insurers) | 26% | 27% |
| Written guidance on who to notify | 26% | 25% |
| Formal incident response plan | 21% | 16% |
| External communications and public engagement plans | 13% | 13% |
Bases: 2,263 UK businesses; 1,174 charities
Larger organisations are more likely than average to say they would do or have in place each of the measures in Figures 5.1 and 5.2. For example, 47% of medium-sized businesses, 64% of large businesses and 38% of high-income charities have a formal incident response plan. Nevertheless, even among large businesses, under half (44%) have a communications plan in place.
Two sectors tend to have a more formalised cyber incident response approach:
-
finance and insurance businesses are more likely to have an incident response plan (39%, vs. 21% overall) among several of the other listed measures
-
health, social care and social work businesses are also more likely to have this (43%), among other measures.
Qualitative insights on the challenges around incident response
The qualitative interviews highlighted several challenges organisations might face when dealing with cyber incidents. In smaller organisations, there was a heavy reliance on DSPs, such as IT providers and cloud storage providers when it came to cyber security in general. Several organisations said they would simply turn to these providers for advice and guidance following an incident. There was a sense that they had delegated all responsibility for cyber security to these providers, so did not feel the need to come up with any internal processes.
Smaller organisations also found it harder to develop incident response plans, because of a lack of in-house expertise or capacity, as well as a lack of external support.
I don’t think we are prepared at all. I haven’t thought about a cyber attack, and I don’t have a plan in place. I would just react and deal with it.
– Chief Officer, small business
Another broad challenge raised in smaller organisations was the inherent unpredictability of cyber incidents, and not knowing how to prepare.
The most difficult thing is knowing what is going to happen, because there are so many ways that you can be attacked.
– Managing Director, micro business
In larger organisations, the challenges were often more related to a disconnect between IT or cyber teams and wider staff, including senior managers.
There would be pushback if incident planning was company-wide, because everyone is so busy, but it would be led by the IT team anyway.
– Director, medium business
We spoke to several medium and large organisations where interviewees reported that their IT teams were relatively well prepared for a cyber incident – in some cases, they had even received incident response training or gathered relevant guidance from the NCSC – but they expected their management boards and wider staff to be much less knowledgeable. Many were concerned about the unpredictable behaviour of wider staff, and cited this as the weak link when it came to incident response. The following quote is from a large utilities business that had a formal incident response plan, ran monthly vulnerability checks and undertook regular scenario testing:
The biggest issue is people. People get things wrong, and it’s really difficult to plan how they’ll get it wrong.
– Systems and Infrastructure Manager, large business
Hybrid working had exacerbated this challenge, with one business admitting they had not yet addressed how to handle cyber incidents among staff working remotely. Their standard approach was to have staff treat cyber incidents as IT problems, and to log an IT ticket. However, they knew this would not necessarily work if communications went down as a result of an incident, or would be much slower if people were working remotely.
This again highlighted the importance of good, regular communication between IT teams and wider staff (previously covered in Section 3.5). One high-income charity identified the main challenge as making sure all staff members knew their role and who to inform internally, particularly where staff turnover was high. Another charity interviewee also stressed the importance of multiple teams being involved in incident response planning:
We will be testing incident response procedure next month with the intention to run awareness session for executives and senior managers. They need to recognise, as much as it is IT, it is also comms, it is legal etc. Team members need to know they are in the team and what to do if an incident happens.
– Information Security Strategic Lead, high-income charity
Some organisations highlighted the importance of post-incident reviews as part of their incident response plans. They offered an opportunity to reflect on the effectiveness of their processes, and to make improvements. It was also a chance for IT teams to engage with wider staff. This was even felt to be the case if the cause of the original incident could not be established. However, running these post-incident reviews again depended on organisations having appropriate in-house expertise and capacity – a challenge for smaller organisations.
The IT team sat down with the senior management team and told them what they have put in place and what was required, so they know what to do should something like this happen again. There were levels of provisions put in place to prevent it happening again.
– HR Administrator, medium business
Ransomware payments
Just over half of businesses (57%) and four in ten charities (43%) have a rule or policy to not pay ransomware payments – this is in line with last year, when this question was introduced. However, there is still a high level of uncertainty among organisations on this topic, with two in ten of the responsible individuals in businesses (21%) and three in ten in charities (28%) saying they do not know what their organisation’s policy is.
The proportion of businesses stating they did have such a rule or policy is relatively consistent across size bands. Likewise, findings are similar across sectors – although professional, scientific and technical businesses are more likely than others to say they have a rule not to pay out (66%, vs. 57% overall).
5.2 External reporting breaches or attacks
External reporting of breaches remains uncommon amongst organisations. This year, among those identifying breaches or attacks, two-fifths of businesses (38%) and charities (38%) reported their most disruptive breach outside their organisation. The proportion for businesses is similar to 2022, while the proportion for charities is considerably higher this time (it was 25% in 2022).
Many of these cases – as in previous years – simply involve organisations reporting breaches to their external cyber security or IT providers and no one else. When excluding these, we find that almost three in ten of the businesses (27%) and charities (29%) identifying breaches or attacks reported these externally. Figure 5.3 shows the top places, beyond cyber security or IT providers, that businesses and charities tend to report breaches to externally. It also excludes a small number of subsidiary businesses that solely reported to their parent company, as this is not external reporting, in this context. To note, this question is unprompted in both the telephone and online surveys.
Figure 5.3 serves to highlight the important role played by banks among both businesses and charities when it comes to cyber security. They are also a common information source for micro businesses on the topic (covered in Section 2.3).
Figure 5.3: Percentage of organisations reporting their most disruptive breach or attack in the last 12 months to the following groups, among those that reported externally (beyond cyber security or IT providers, or their parent company)
| Groups (beyond cyber security or IT providers, or their parent company) to whom organisation reported their most disruptive breach or attack in the last 12 months | Businesses | Charities |
|---|---|---|
| Bank, building society or credit card company | 28% | 9% |
| Internet or network service provider | 10% | 7% |
| Suppliers | 11% | 4% |
| Customers | 8% | 3% |
| Police | 8% | 3% |
| Action Fraud | 5% | 13% |
| Organisation that was source of breach or attack | 5% | 5% |
| Website administrators | 5% | 0% |
| Specific tech companies (e.g. Amazon) | 3% | 14% |
| Another government agency | 2% | 10% |
| Information Commissioner’s Office (ICO) | 2% | 7% |
Bases: 210 businesses that reported their most disruptive breach externally (to someone other than an outsourced cyber security or IT provider, or a parent company); 98 charities
Among the businesses and charities that do not report their most disruptive breach or attack, the most common reason given for this is that it was not considered significant enough to warrant reporting (for 62% of businesses and 76% of charities). Beyond this, the next most common reasons are:
-
they do not know who to report to (for 9% of businesses and 8% of charities)
-
the breach or attack was dealt with internally (for 8% and 9%)
-
they do not think reporting will make any difference (for 6% and 1%).
Other reasons tend to be mentioned by relatively small proportions. This question is also unprompted in both the telephone and online surveys.
Qualitative insights as to why organisations may not report breaches
The qualitative findings on breach reporting were similar to previous years – it was common for organisations to say that they would not report breaches externally unless a large amount of client or personal data was involved. The reasons behind this included a lack of knowledge on where to report certain incidents, as well as the perceived threat to reputations from reporting.
Navigating the risk to reputation was especially challenging for organisations. Some noted that externally reporting every incident might give clients the impression that the organisation was vulnerable to cyber attacks. At the same time, it might reassure clients that the organisation was taking its cyber responsibilities seriously. This made it difficult to pull together a uniform reporting or communications approach for cyber incidents – each incident would instead have to be considered individually in terms of its potential impact and reputational damage.
5.3 Actions taken to prevent future breaches or attacks
Among those that have identified any breaches or attacks, two-thirds of businesses (66%) and a similar proportion of charities (68%) report taking any action to prevent further breaches. In both cases, this is higher than the equivalent results from last year (62% and 57% respectively). The charity result is closer to that from 2021 (when it was 69%).
As Figure 5.4 shows, the most common specific action taken are a mixture of additional staff training or communications, and implementing new technical controls. Once again, this question is unprompted in both the telephone and online surveys.
Figure 5.4: Percentage of organisations that have done any of the following since their most disruptive breach or attack of the last 12 months
| Actions taken since their most disruptive breach or attack of the last 12 months | Businesses | Charities |
|---|---|---|
| Additional staff training or communications | 19% | 28% |
| Installed, changed or updated antivirus or anti-malware software | 9% | 6% |
| Changed or updated firewall or system configurations | 8% | 6% |
| Updated passwords | 6% | 4% |
| No action taken | 29% | 26% |
Bases: 837 businesses that recalled their most disruptive breach or attack in the last 12 months; 418 charities
We can further categorise the answers into changes of a technical nature (e.g. to firewalls, admin access or antivirus software), people-related changes (e.g. to training or staffing) and governance changes (e.g. updates to policies or other documentation). When viewed in this way, a slightly larger proportion of businesses have made technical changes (30%), compared to people-related changes (24%). The reverse was true for charities, where 33% made people related changes and 24% made technical changes – and this has been a consistent pattern in previous years. For both groups, fewer decided to make changes to their governance processes (13% of businesses and 9% of charities).
Medium businesses (74%, vs. 66% overall) and large businesses (83%) are the most likely to have taken any actions to prevent further breaches or attacks.
As may be expected, the picture in Figure 5.4 changes slightly when looking only at the organisations whose most disruptive breach resulted in a material outcome (e.g. the loss of files, money, or other assets). Around four in five businesses (81%) and almost nine in ten charities (87%) took any form of action here. These tend to be even more focused around changes of a technical nature (for 39% of businesses and 41% of charities).
Figure 5.5: Percentage of organisations that have done any of the following since their most disruptive breach or attack of the last 12 months, in cases where breaches had material outcomes
| Actions taken since their most disruptive breach or attack of the last 12 months, in cases where breaches had material outcomes | Businesses | Charities |
|---|---|---|
| Changed or updated firewall or system configurations | 14% | 13% |
| Updated passwords | 11% | 7% |
| Additional staff training or communications | 10% | 27% |
| Installed, changed or updated antivirus or anti-malware software | 10% | 16% |
| Outsourced cyber security | 10% | 8% |
| New or updated cyber security policies | 6% | 3% |
| Additional security on email accounts | 5% | 5% |
| Increased monitoring | 5% | 2% |
| Changed online banking or payment policies | 5% | 0% |
| New software or tools (other than antivirus or anti-malware) | 3% | 6% |
| Additional website security | 3% | 5% |
| Extra staff vetting | 0% | 5% |
| No action taken | 13% | 11% |
Bases: 222 businesses that recalled their most disruptive breach or attack with an outcome in the last 12 months; 85 charities
Chapter 6: Cyber crime
This chapter, new for the 2023 study, covers cyber crime, and the frauds that occur as a result of cyber crime. It furthers explores the threat landscape for UK organisations, by establishing the number of cyber incidents that could be defined as crimes committed against them, in terms of the Computer Misuse Act 1990 and the Home Office Counting Rules.
Cyber crime involves gaining unauthorised access, or causing damage, to computers, networks, data or other digital devices, or the information held on those devices. Examples of cyber crime include hacking or unauthorised access into online accounts (e.g. banking, email or social media accounts), denial of service attacks, or devices being infected by a virus or other malicious software (including ransomware).
The chapter covers:
-
the prevalence of cyber crimes, i.e. how many organisations are affected by them
-
the nature of these cyber crimes
-
the scale of cyber crimes, i.e. the number of times each organisation is impacted, and estimates for the total number of cyber crimes against UK organisations
-
estimates of the financial cost of cyber crime
-
a similar set of statistics with regards to frauds that occur as a result of cyber crime (cyber-facilitated fraud), but excluding financial cost estimates for these frauds, which could not be reported this year.
Some of the cyber security breaches and attacks reported in Chapter 4 would not constitute cyber crimes under the above definition. For example, some attempted attacks will not have penetrated an organisation’s cyber defences and some, such as online impersonation, would be beyond the scope of the Computer Misuse Act. Therefore, the statistics here on prevalence and financial cost differ from the equivalent estimates for all cyber security breaches or attacks (in Chapter 4). They should be considered as a distinct set of figures, specifically for crimes committed against organisations – a subset of all breaches and attacks.
The new questions have been introduced to this survey series to allow us to monitor the prevalence of, and harm caused by, cyber crimes against organisations, using a similar approach to existing official estimates of crime against individuals. This includes police-recorded crime as well as the estimates from the general public Crime Survey for England and Wales (CSEW), both of which follow the Home Office Counting Rules.
These crime-related questions were developed in close coordination with DSIT and the Home Office, as well as with external support from the Office for National Statistics.
As this is the first year these questions have been asked and there is no baseline for comparison, users should be relatively cautious when interpreting these statistics. They should ideally be considered alongside other, related evidence on computer misuse, such as the statistics for retail and wholesale premises collected in the 2021 Commercial Victimisation Survey (CVS) and the general public statistics collected in the CSEW. The CVS and CSEW are not directly comparable with the Cyber Security Breaches Survey, but help to contextualise some of the findings in this chapter on the prevalence and scale of cyber crime. The questions in the Cyber Security Breaches Survey will be subject to further refinement in later years.
It is important to remember that, as with all cyber security breaches and attacks, the survey can only measure cyber crimes or fraud that organisations can identify and recall. There are likely to be hidden crimes, and others that organisations cannot recall in detail, so the findings reported here may have a tendency to underestimate prevalence and scale.
6.1 What constitutes crime
This survey covers multiple forms of cyber crime:
-
ransomware that breached an organisation’s defences (i.e. it was not stopped by software)
-
other computer viruses or malware that breached an organisation’s defences
-
denial of service attacks that breached an organisation’s defences and were carried out intentionally, including attacks that led to extortion
-
hacking – unauthorised access of files or data, as well as online takeovers (e.g. of websites, social media accounts or email accounts) – that was carried out intentionally, including attacks that led to extortion
-
phishing attacks that individuals responded to (e.g. by opening an attachment) or that contained personal data about the recipient, and did not lead to any further crimes being committed.
In order to adhere to the Home Office Counting Rules, and avoid double-counting of crimes, we establish if organisations experienced these kinds of cyber incidents as isolated events, or part of a wider chain of events. If they were part of a chain, we have taken the approach of only counting the final event (i.e. type of offence) in the chain.
Cyber crime also facilitates other offences. In recognition of this, we have included questions that capture where cyber crime has led to fraud (i.e. cyber-facilitated fraud). Cyber-facilitated fraud is deception to make a gain, or cause a loss, in relation to money, services, property or goods, which uses data or access obtained through cyber crimes. In these cases, to avoid double-counting, the incident is recorded here as a fraud rather than a cyber crime. We have included these fraud estimates to complement the cyber crime estimates. However, these cyber-facilitated fraud statistics are not intended to capture all frauds committed against businesses – they only represent the frauds preceded by cyber crimes.
More details on the approach to this new chapter can be found in the separately published Technical Annex.
6.2 The prevalence of cyber crime
Looking across all the different types of cyber crime, we estimate that 11% of businesses and 8% of charities have been the victim of at least one cyber crime in the last 12 months. This accounts for approximately 159,000 businesses and 15,000 registered charities – although these estimates, like all survey results, will be subject to a margin of error (see Appendix A).[footnote 13] This excludes cyber-facilitated fraud, which is discussed separately in Section 6.6.
Looked at another way, among the 32% businesses and 24% of charities identifying any cyber security breaches or attacks, around a third (34% for businesses and 32% for charities) ended up being victims of cyber crime.
As Figure 6.1 shows, across all organisations (i.e. not just those identifying breaches or attacks), medium and large businesses are more likely to experience a cyber crime than smaller ones. Similarly, high-income charities (25% of those with an income of £500,000 or more, vs. 8% of all charities) are also significantly more likely to have experienced a cyber crime. This reflects the pattern for all cyber security breaches and attacks more generally, as described in Chapter 4. As this series of reports has previously noted with regards to all breaches and attacks, this difference may to some extent indicate underreporting in smaller organisations, which tend to have less sophisticated cyber security monitoring in place.
In terms of sector, professional, scientific and technical businesses are more likely than others to have identified cyber crimes, as the chart shows.
Figure 6.1: Percentage of organisations that have experienced any cyber crime in the last 12 months
| Businesses overall | 11% |
| Micro businesses | 10% |
| Small businesses | 12% |
| Medium businesses | 26% |
| Large businesses | 37% |
| Within professional, scientific and technical | 20% |
| Charities overall | 8% |
Bases: 2,263 UK businesses; 1,387 micro businesses; 400 small businesses; 277 medium businesses; 199 large businesses; 285 professional, scientific and technical businesses; 1,174 charities
The next section (Section 6.3) covers the types of cyber security breaches or attacks that resulted in cyber crime. It is worth noting that most of the 11% of businesses and 8% of charities that identify any cyber crime are referring to phishing-related cyber crimes – where individuals responded to a phishing email (e.g. by opening an attachment) or where the phishing email contained personal data about the recipient. When removing these phishing-related cyber crimes from the calculation, we estimate that a total of 2% of businesses and 1% of charities have experienced at least one non-phishing cyber crime in the last 12 months. This amounts to 33,000 businesses and 3,000 registered charities.
For context, it is worth noting that the CVS estimates that 7% of retail and wholesale premises were victims of computer misuse in 2021, and that the vast majority of these events were also phishing-related.
The remaining set of cyber crimes (i.e. excluding phishing-related crimes) are again more prevalent than average among large businesses (8%, vs. 2% of businesses overall) and high-income charities (6%, vs. 1% of charities overall).
6.3 The nature of cyber crimes experienced
This section breaks down the types of cyber crimes that organisations have faced, among the 11% of businesses and 8% of charities that have been victim to at least one cyber crime.
Figure 6.2 shows that phishing is by far the most common type of cyber crime in terms of prevalence. The least commonly identified types of cyber crime are ransomware and denial of service attacks.
Figure 6.2: Percentage of organisations that have identified the following types of cyber crime in the last 12 months, among the organisations that have identified any cyber crime
| Type of cyber crime | Businesses | Charities |
|---|---|---|
| Phishing attacks | 89% | 85% |
| Viruses, spyware or malware | 12% | 7% |
| Hacking (unauthorised access or online takeovers) | 7% | 8% |
| Ransomware | 4% | 4% |
| Denial of service attacks | 2% | 1% |
Bases: 346 businesses that identified a cyber crime in the last 12 months; 172 charities
6.4 The scale of cyber crime
Some organisations may be the victims of cyber crime multiple times. Our survey also estimates the scale of cyber crime – that is, the number of times cyber crime has occurred, among the 11% of businesses and 8% of charities that identified any cyber crimes in the last 12 months.
-
Among these businesses, a third (35%) identified 1 cyber crime over this period, a fifth (20%) identified 2 cyber crimes, and over two-fifths (45%) experienced 3 or more.
-
Among these charities, two-fifths (39%) identified 1 cyber crime in the last 12 months, just over one in ten (14%) identified 2 cyber crimes, and, as with businesses, over two-fifths (45%) experienced 3 or more.
On average (taking the mean estimates), these businesses experienced 15 cyber crimes of any kind in the last 12 months, and these charities experienced 51 cyber crimes in the last 12 months. Both mean score estimates, particularly the charities estimate, are driven up by a handful of sampled organisations that recorded a very high number of phishing-related crimes (in the thousands). The median result, which may be more reflective of the typical organisation, was 2 cyber crimes, for both businesses and charities.
Once again, it is important to note how much these figures are dominated by phishing. A small number of organisations experience a very high volume of phishing cyber crimes. When removing these – looking only at the 2% of businesses identifying non-phishing cyber crimes – the mean results are very different. Here, it is only possible to look at businesses, due to the very low sample sizes for this subgroup of charities. The average business identifying any non-phishing cyber crimes in the last 12 months experienced 2 such events (the mean estimate). The typical business experienced 1 such event (the median estimate).
As the results are representative of the overall business and charity populations, it is possible to extrapolate from the mean results and present estimates for the scale of cyber crime across the overall business and charity populations. However, it should be noted that these population estimates will have an associated wide margin of error, especially for the non-phishing cyber crimes for businesses (a sample size of 68).
Using the results from this Cyber Security Breaches Survey, we estimate that:
-
UK businesses have experienced approximately 2.39 million cyber crimes of all types and approximately 70,000 non-phishing cyber crimes in the last 12 months.
-
UK charities have experienced approximately 785,000 cyber crimes of all types in the last 12 months. It is not possible to estimate the number of non-phishing cyber crimes for this group, due to low sample sizes.
For context, the CSEW estimated approximately 690,000 computer misuse offences experienced by the general public (in England and Wales) in the 12 months up to the end of September 2022. Whilst the findings in the CSEW are not directly comparable with the Cyber Security Breaches Survey, they provide a broader context from which to consider the scale of cyber crime in organisations.
6.5 Financial cost of cyber crimes
Table 6.1 shows the estimated costs organisations incurred from all the identified cyber crimes over the past 12 months. This excludes crimes where the only activity was phishing, i.e. where there was no follow-on crime from the phishing email, such as a successful ransomware attack or hacking. For crimes of that nature, where nothing happens beyond the phishing email, the cost is expected to be negligible for organisations. Where the phishing did lead to a follow-on crime, the cost of this would be captured in the other questions.
The figures can only be reported for businesses – the sample sizes for charities experiencing cyber crimes other than phishing is too low. Similarly, due to small sample sizes, it is not possible to break down these figures by the size of business (as is done with the cost estimates for cyber security breaches and attacks in Chapter 4), or by crime type.
A small number of businesses say that the cyber crimes they experienced incurred no cost. We therefore report the estimates both including and excluding these businesses. The estimates excluding them are effectively showing the cost of cyber crimes that have a material impact on the business.
The wide gap between mean and median costs highlights that – just as with all cyber security breaches or attacks – the typical business faces relatively low costs, but a small minority of businesses face potentially crippling costs from cyber crime.
Table 6.1: Average cost per business of all cyber crimes (excluding phishing) experienced in the last 12 months[footnote 14]
| Businesses experiencing any cyber crime other than phishing (including those giving a cost of £0) | Businesses experiencing any cyber crime other than phishing (excluding those giving a cost of £0) | |
|---|---|---|
| Mean cost | £15,300 | £20,900 |
| Median cost | £250 | £1,000 |
| Base | 64 | 47 |
6.6 Cyber-facilitated fraud
Prevalance of cyber-facilitated fraud
A total of 3% of all businesses and 1% of all charities have been a victim of fraud that resulted from a cyber crime in the last 12 months. Put another way, among the 32% businesses and 24% of charities experiencing any breaches or attacks (covered in Section 4.1), around one in eleven of these businesses (9%) and one in twenty of these charities (6%) ended up being defrauded.
When extrapolating this to the respective overall populations, this equates to approximately 40,000 businesses and 3,000 registered charities experiencing cyber-facilitated fraud.
The overall percentage estimates are slightly, but significantly, higher among large businesses, 7% of which have been victims of cyber-facilitated fraud (vs. 3% of businesses overall). Construction businesses (5%) are also among the most likely to fall victim to cyber-facilitated fraud.
Scale of cyber-facilitated fraud
For the 3% of businesses that report cyber-facilitated fraud, nine in ten (89%) say this happened just once in the last 12 months. The average (mean) number of cyber-facilitated frauds experienced by these businesses is a little over 1 per business.
As with the scale of cyber crime estimates (see Section 6.4), it is possible to extrapolate from these results and present estimates for the overall business population. Once again, it should be noted that these will have an associated wide margin of error (based on a sample size of 73 businesses). Nevertheless, we estimate that there were approximately 49,000 cyber-facilitated fraud events across the entire business population in the last 12 months (based on the unrounded mean estimates).
The sample size is too low to include the results (including any extrapolated population estimates) for charities at this question.
The breaches or attacks preceding cyber-facilitated fraud
Among the 3% of businesses that fell victim to cyber-facilitated fraud, Figure 6.3 traces the cyber crimes that led to the fraud. For example, around two-thirds of victims (68%) say that they had a fraud event emanating from a phishing attack. The most common enablers of cyber-facilitated fraud, in terms of the types of cyber crime, are therefore phishing, and hacking of online bank accounts. Online takeovers and viruses are less common enablers, while the remaining types of cyber crimes very rarely lead to fraud.
Figure 6.3: Percentage of businesses that had specific breaches or attacks leading to cyber-facilitated fraud, among the businesses experiencing any cyber-facilitated fraud
| Phishing attacks | 68% |
| Hacking or attempted hacking of online bank accounts | 35% |
| Takeovers of organisation’s or users’ accounts | 12% |
| Viruses, spyware or malware (excluding ransomware) | 12% |
| Denial of service attacks | 5% |
| Ransomware | 5% |
| Unauthorised accessing of files or networks by staff | 3% |
Base: 73 businesses that incurred fraud as a direct result of cyber crime in the last 12 months (excluding small numbers that say “don’t know” at each answer code)
As noted in Section 6.1, our survey estimates for cyber crime and cyber-facilitated fraud are mutually exclusive – we do not double-count instances of fraud to be cyber crime as well. If criminal activities like targeted hacking led to fraud, they are counted as cyber-facilitated fraud. If they did not lead to fraud, i.e. if the targeted hacks were the final events in their own right, they are counted as cyber crimes.
Chapter 7: Conclusions
The important context for trend findings
This latest Cyber Security Breaches Survey takes place under a different economic climate than in previous years. In the qualitative interviews, smaller organisations highlighted that they faced rising costs and challenges with financial planning, due to high inflation, higher energy prices and overall economic uncertainty. As a result, cyber security may have dropped down the priority list among the directors and trustees in smaller businesses and charities, relative to these wider concerns. This may help to explain some of the changes in the survey results compared to 2022, with fewer micro businesses and low-income charities now viewing cyber security as a high priority, and a reduction in various cyber hygiene measures being taken in these smaller organisations.
Some trends may also reflect shifts in ways of working since the pandemic. For instance, the proportion of businesses restricting access to business-owned devices has fallen successively and substantially over the last four years. Furthermore, fewer charities are undertaking any monitoring of user activity this year.
Taken together, the changes in the business environment and the normalisation of hybrid working cultures may also make it harder for smaller organisations to identify cyber security breaches or attacks. This is important context for understanding why the number of businesses experiencing breaches or attacks has fallen over the last few years (since 2020). While it could be due to a reduction in cyber attacks, this runs counter to the way many organisations – particularly large organisations – in the qualitative interviews discussed the cyber threat as either persistent or rising. An alternative explanation may be that smaller organisations are simply less capable of identifying breaches or attacks than they were three years ago.
It is also important to note that many of the changes in results since 2022, in terms of decreased prioritisation of cyber security, a reduction in cyber hygiene measures and less identification of breaches, are largely concentrated among micro businesses and, to a lesser extent, small businesses. The results for medium and large businesses, in terms of their experiences and the actions they are taking, are highly consistent with last year. In the qualitative interviews, some of these larger organisations with a strong international presence acknowledged specific actions taken in reaction to geopolitical events and threats from state actors in the last 12 months – although this was relatively rare.
Focus area for continuous improvement in organisations
The study continues to highlight various areas where organisations of all sizes can potentially improve their approaches and become more resilient to cyber attacks:
-
The qualitative findings show the impact of good, ongoing communication between those in technical cyber or IT roles, wider staff and management boards. Instilling a security-conscious work culture often relies on two-way feedback, where staff report suspicious activity and hear back from those in technical roles on the actions taken. It also requires IT and cyber teams to be visible, to build trusting relationships with wider staff and management boards. This approach underpins effective cyber security training and awareness raising, which continues to be important given that most breaches, as well as cyber crimes, are a result of phishing attacks targeted at wider staff.
-
Many medium and large businesses, as well as high-income charities, can adopt cyber security strategies, to underpin and unify all their existing policies and processes. This approach is already on the rise in large businesses specifically. The qualitative interviews suggest that having a strategy in place is associated with other changes in organisations, like making cyber security operationally and financially independent from wider IT.
-
For the first time, the majority of large businesses report taking actions to review cyber risks from their suppliers. However, this kind of activity is much less common in SMEs, where organisations still lack awareness of supply chain risks. The qualitative findings suggest that information and guidance (e.g. from the NCSC), pressure from clients and feedback from auditors can all encourage organisations to review this area, and to put more formal processes in place.
-
Formal incident response plans are relatively rare. Most organisations claim they would take a range of actions to manage a cyber incident, but these tend not to be documented. And while directors or trustees are likely to be informed of cyber incidents, they may lack training to know what their roles should be in these circumstances.
New statistics on crime and refinement in future years
This is the first Cyber Security Breaches Survey to measure cyber crime, as well as fraud that occurs as a result of cyber crime (cyber-facilitated fraud), among organisations. While only small proportions of businesses and charities identify as victims of cyber crime and cyber-facilitated fraud, at least relative to the higher proportions that identify any cyber security breaches or attacks, we must acknowledge the potential for underreporting of crime this year, given the relative complexity of these questions. The questions will be subject to further refinement next year.
Nevertheless, the survey does tell us that cyber crime can be very costly to organisations when it does occur. Moreover, among those that can recall experiencing cyber crime, it can also be a very frequent occurrence for some businesses and charities.
As this is the first year these questions have been asked and there is no baseline for comparison, users should be relatively cautious when interpreting the crime-related estimates. As stated in other places in this report, they should ideally be considered alongside other evidence, for example from the latest Commercial Victimisation Survey (CVS) and the general public Crime Survey for England and Wales (CSEW). These other surveys highlight that cyber crime is relatively rare but still ends up affecting thousands of businesses or individuals. The CVS also highlights that, as in this survey, a high proportion of crime against businesses arises out of the phishing emails that are so prolific across all organisations. This report adds to this overall picture by producing statistics covering all economic sectors for the first time (as well as charities, and the separately reported education institution findings). Further years of crime data from the Cyber Security Breaches Survey will help to validate the statistics reported here and show trends over time.
Appendix A: Guide to statistical reliability
The final data from the survey are based on weighted samples, rather than the entire population of UK businesses or charities. Percentage results are therefore subject to margins of error, which vary with the size of the sample and the percentage figure concerned.
For example, for a question where 50% of the 2,263 businesses sampled in the survey give a particular answer, the chances are 95 in 100 that this result would not vary more or less than 2.4 percentage points from the true figure – the figure that would have been obtained had the entire UK business population responded to the survey. The margins of error that are assumed to apply in this report are given in the following table.[footnote 15]
Margins of error (in percentage points) applicable to percentages at or near these levels
| 10% or 90% | 30% or 70% | 50% | |
| 2,263 businesses | ±1.4 | ±2.2 | ±2.4 |
| 1,387 micro businesses | ±1.6 | ±2.5 | ±2.7 |
| 400 small businesses | ±3.1 | ±4.7 | ±5.1 |
| 277 medium businesses | ±3.7 | ±5.6 | ±6.1 |
| 199 large businesses | ±4.3 | ±6.6 | ±7.2 |
| 1,174 charities | ±2.1 | ±3.2 | ±3.4 |
There are also margins of error when looking at subgroup differences. A difference from the average must be of at least a certain size to be statistically significant. The following table is a guide to these margins of error for the subgroups that we have referred to several times across this report.
Differences required (in percentage points) from overall (business or charity) result for significance at or near these percentage levels
| 10% or 90% | 30% or 70% | 50% | |
| 1,387 micro businesses | ±0.9 | ±1.3 | ±1.4 |
| 400 small businesses | ±2.8 | ±4.2 | ±4.6 |
| 277 medium businesses | ±3.4 | ±5.2 | ±5.7 |
| 199 large businesses | ±4.1 | ±6.3 | ±6.8 |
| 178 finance and insurance businesses | ±4.6 | ±7.0 | ±7.7 |
| 358 high-income charities | ±3.1 | ±4.7 | ±5.2 |
Appendix B: Glossary
Broad definitions of cyber security terms
| Term | Definition |
|---|---|
| Cyber security | Cyber security includes any processes, practices or technologies that organisations have in place to secure their networks, computers, programs or the data they hold from damage, attack or unauthorised access. |
| Cyber attack | A cyber attack is a malicious and deliberate attempt by an individual or organisation to breach the information system of another individual or organisation. |
| Cyber crime | In the context of this study, cyber crime involves gaining unauthorised access, or causing damage, to computers, networks, data or other digital devices, or the information held on those devices. Examples of cyber crime include hacking or unauthorised access into online accounts (e.g. banking, email or social media accounts), denial of service attacks, or devices being infected by a virus or other malicious software (including ransomware). |
| Cyber-facilitated fraud | In the context of this study, we define fraud as being dishonest action, with the intent of making a financial gain at the expense of an organisation. Cyber-facilitated fraud is deception to make a gain, or cause a loss, in relation to money, services, property or goods, which uses data or access obtained through one or more of the following: - ransomware - viruses, spyware or malware - denial of service attacks - hacking – unauthorised access to devices (including, computers, smartphones and other internet-connected devices), as well as online takeovers - phishing attacks. |
| Cyber security breach | A cyber security breach is any incident that results in unauthorised access of data, applications, services, networks and/or devices by bypassing their underlying security mechanisms. |
| Outcome | A negative outcome from a cyber security breach or attack involves a temporary or permanent material loss from an organisation, such as a loss of money or data. |
| Impact | A negative impact from a cyber security breach or attack does not have to involve a material loss. This could be issues relating to staff disruption or implementing new measures in the organisation. |
Definitions of types of cyber security breaches
| Term | Definition |
| Denial of service attack | Denial of service attacks try to slow or take down organisations’ website, applications or online services, to render these services inaccessible. |
| Hacking | In the context of this study, we define two forms of hacking. Firstly, unauthorised access of files or networks, or entry into video conferences or instant messaging. Secondly, online takeovers of organisations’ websites, social media accounts or email accounts. |
| Malware | Malware (short for “malicious software”) is a type of computer program designed to infiltrate and damage computers without the user’s consent (e.g. viruses, worms and Trojan horses). |
| Phishing | Phishing involves fraudulent attempts to extract information such as passwords or personal data (e.g. through emails or by filling in forms on websites), or to install malware on the recipient’s device or network. In the context of this study, we define phishing as staff receiving fraudulent emails, or arriving at fraudulent websites. |
| Ransomware | Ransomware is a type of malicious software designed to block access to a computer system until a sum of money (a ransom) is paid. |
| Social engineering | Social engineering involves manipulation of specific individuals to extract important information, such as passwords or personal data, from an organisation, for example, through impersonation. |
Definitions relating to cyber security processes or controls
| Term | Definition |
| Cloud computing | Cloud computing uses a network of external servers accessed over the internet, rather than a local server or a personal computer, to store or transfer data. This could be used, for example, to host a website or corporate email accounts, or for storing or transferring data files. |
| Digital Service Providers | Digital Service Providers (DSPs) manage a suite of IT services like an organisation’s network, cloud computing and applications. |
| Patch management | Patch management is about software security being regularly or automatically patched. In the context of this study, we define it as organisations having a policy to apply software security updates within 14 days of them being made available. |
| Penetration testing | Penetration testing is where staff or contractors try to breach the cyber security of an organisation on purpose, in order to show where there might be weaknesses in cyber security. |
| Removable devices | Removable devices are portable devices that can store data, such as USB sticks. |
| Restricting IT admin and access rights | This is where only certain users are able to make changes to the organisation’s network or computer settings, for example to download or install software. |
| Software as a Service | Software as a Service (SaaS) is a software distribution model in which a cloud provider hosts applications and makes them available to end users over the internet. |
| Threat intelligence | Threat intelligence is where an organisation may employ a staff member or contractor, or purchase a product to collate information and advice around all the cyber security risks the organisation faces. |
| Two-factor authentication | Two-factor authentication (2FA), or multi-factor authentication (MFA) is an electronic authentication method in which a user is granted access to a network or application only after successfully presenting two or more pieces of evidence to an authentication mechanism (e.g. a password and a one-time passcode). |
| Virtual Private Network | A Virtual Private Network (VPN) are encrypted network connections, allowing remote users to securely access an organisation’s services. |
Definitions relating to business or charity characteristics
| Term | Definition |
| Micro business | Businesses with 1 to 9 employees |
| Small business | Businesses with 10 to 49 employees |
| Medium business | Businesses with 50 to 249 employees |
| Large business | Businesses with 250 or more employees |
| SME | Small to medium-sized enterprise, i.e. micro, small and medium-sized businesses |
| Low-income charity | Charities with an income of less than £100,000 |
| High-income charity | Charities with an income of £500,000 or more |
| Very high-income charity | Charities with an income of £5 million or more |
Appendix C: Further information
- The Department for Science, Innovation and Technology and the Home Office would like to thank the following people for their work in the development and carrying out of the survey and for their work compiling this report.
- Harry Williams, Ipsos
- Finlay Procter, Ipsos
- Jamie Douglas, Ipsos
- Shahil Parmar, Ipsos
- Nick Coleman, Ipsos
- Jayesh Navin Shah, Ipsos
- Professor Steven Furnell, University of Nottingham.
-
The Cyber Security Breaches Survey was first published in 2016 as a research report, and became an Official Statistic in 2017. The previous reports can be found here. This includes the full report and the technical and methodological information for each year.
-
The responsible DSIT analyst for this release is Emma Johns. The responsible statistician is Maddy Ell. For enquiries on this release, from an official statistics perspective, please contact DSIT at evidence@dcms.gov.uk. As of publication, the DCMS mailbox remains the correct address, but this may change to a DSIT-specific email address next year.
-
For general enquiries contact: 020 7211 6000.
-
The Cyber Security Breaches Survey is an official statistics publication and has been produced to the standards set out in the Code of Practice for Official Statistics. For more information, see here. Details of the pre-release access arrangements for this dataset have been published alongside this release.
-
This work was carried out in accordance with the requirements of the international quality standard for Market Research, ISO 20252.
-
This research was previously commissioned by the former Department for Digital, Culture, Media and Sport (DCMS). In February 2023, the parts of DCMS responsible for cyber security policy moved to a new department, the Department for Science, Innovation and Technology (DSIT). ↩
-
Where subgroup mean scores are compared, the large variation in the data often means that these differences are not statistically significant – this is made clear throughout. However, looking at the pattern of mean scores across subgroups, and the direction of travel since the 2016 and 2017 surveys, can still generate valuable insights in these instances. ↩
-
Subgroup differences highlighted are either those that emerge consistently across multiple questions or evidence a particular hypothesis (i.e. not every single statistically significant finding has been commented on). ↩
-
To note, these are private sector education businesses. Results for public sector schools, colleges and universities are covered in the separately published Education Institutions Findings Annex. ↩
-
These aggregated results (for organisations updating managers at least quarterly) across this section exclude the proportion of businesses and charities that say they update senior managers each time there is a breach (although these are still included in the base). ↩
-
The charities mentioning their country’s charity regulator are also included in the 12% mentioning a government or public sector information source. ↩
-
This is according to the BEIS Business Population Estimates 2022, and excludes 0-employee businesses. ↩
-
This is the percentage of businesses and charities that say they have all the following rules or controls: having network firewalls, security controls on company-owned devices, restricting IT admin and access rights to specific users, up-to-date malware protection, and a policy to apply software updates within 14 days. ↩
-
Step 4 of the 10 Steps, as mapped to the 2023 survey, cannot be mapped to the 2022 data for a year-on-year comparison, because the questions on separate WiFi networks and VPNs were only asked of half the sample in 2022. ↩
-
These extrapolated figures are based on estimates of the total population of businesses (1,447,900 according to the BEIS Business Population Estimates 2022) and charities (201,325, when combining the charity registers for England and Wales, Northern Ireland and Scotland). These extrapolated figures are rounded to the nearest thousand. We use the unrounded prevalence estimates in this calculation – for example, the unrounded prevalence of cyber security breaches or attacks in businesses is 31.9% (rounding up to 32%, as noted in the main body of this report), so the calculation is 1,447,900 × 31.9%, which rounds to c.462,000. ↩
-
The cost estimates in this section are presented to three significant figures, or to the nearest £10 (if under 100). The mean and median scores exclude “don’t know” and “refused” responses. They merge together the answers from respondents who gave a numeric value as well as those who gave only a banded value (because they did not know the exact answer). For the latter, we have imputed numeric values from the given banded values. We lay out this approach in detail in the Technical Annex. ↩
-
This statistical significance testing across years takes into account Consumer Price Index (CPI) inflation in the cost estimates from previous years. ↩
-
These extrapolated figures are based on estimates of the total population of businesses (1,447,900 according to the BEIS Business Population Estimates 2022) and charities (201,325, when combining the charity registers for England and Wales, Northern Ireland and Scotland). Across the chapter, any extrapolated figures are rounded to three significant figures (or to the nearest thousand, if under 1 million). We use the unrounded prevalence estimates in this calculation – for example, the unrounded prevalence of cyber crime in charities is 7.6% (rounding up to 8%, as noted in the main body of this report), so the calculation is 201,325 × 7.6%, which rounds to 15,000. ↩
-
Similarly to Chapter 4, the cost estimates in Chapter 6 are presented to three significant figures, or to the nearest £10 (if under 100). The mean and median scores exclude “don’t know” and “refused” responses. They merge together the answers from respondents who gave a numeric value as well as those who gave only a banded value (because they did not know the exact answer). ↩
-
In calculating these margins of error, the design effect of the weighting has been taken into account. This lowers the effective base size used in the statistical significance testing. The overall effective base size was 1,702 for businesses (vs. 816 in 2022) and 808 for charities (vs. 267 in 2022). ↩