Crimes against businesses findings 2014
Published 23 April 2015
Applies to England and Wales

© Crown copyright 2015
This publication is licensed under the terms of the Open Government Licence v3.0 except where otherwise stated. To view this licence, visit nationalarchives.gov.uk/doc/open-government-licence/version/3 or write to the Information Policy Team, The National Archives, Kew, London TW9 4DU, or email: psi@nationalarchives.gov.uk.
Where we have identified any third party copyright information you will need to obtain permission from the copyright holders concerned.
This publication is available at https://www.gov.uk/government/statistics/crime-against-businesses-findings-from-the-2014-commercial-victimisation-survey/crimes-against-businesses-findings-2014
Executive Summary
-
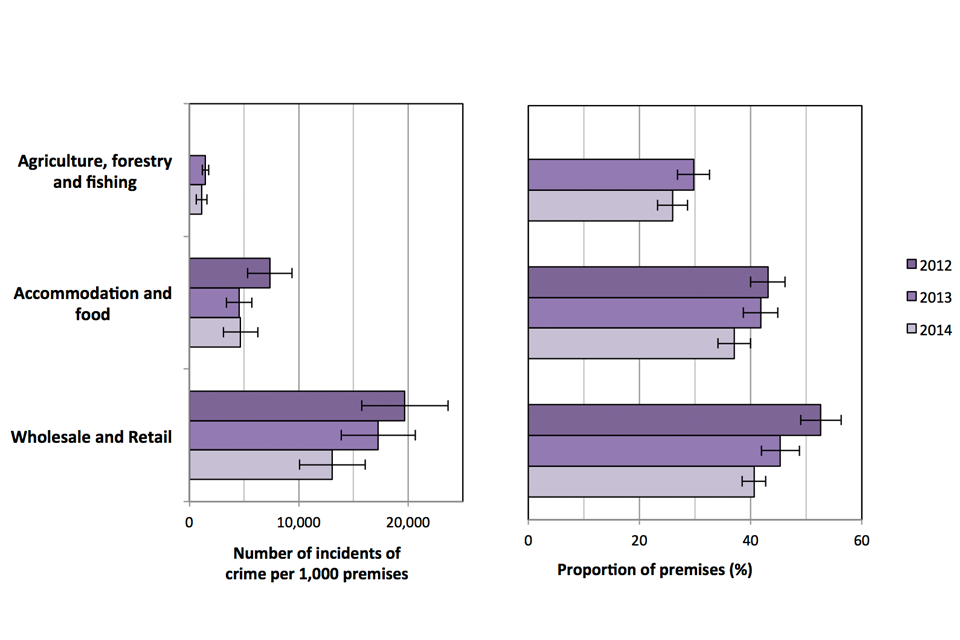
the overall crime rate against business premises in England & Wales fell in both the wholesale and retail and accommodation and food sectors between 2012 and 2014
-
the proportion of premises that were victims of crime in these two sectors also fell during the same period
-
both the rate of burglaries and the proportion of premises experiencing burglary fell in the wholesale and retail sector and the accommodation and food sector between 2012 and 2014
-
the rate of shoplifting in the wholesale and retail sector fell between 2012 and 2014. However, the average cost per incident did not change significantly
-
the agriculture, forestry and fishing sector experienced the lowest levels of crime of all the sectors surveyed in 2012, 2013 and 2014
-
levels of anti-social behaviour against business premises have remained steady over the last three years
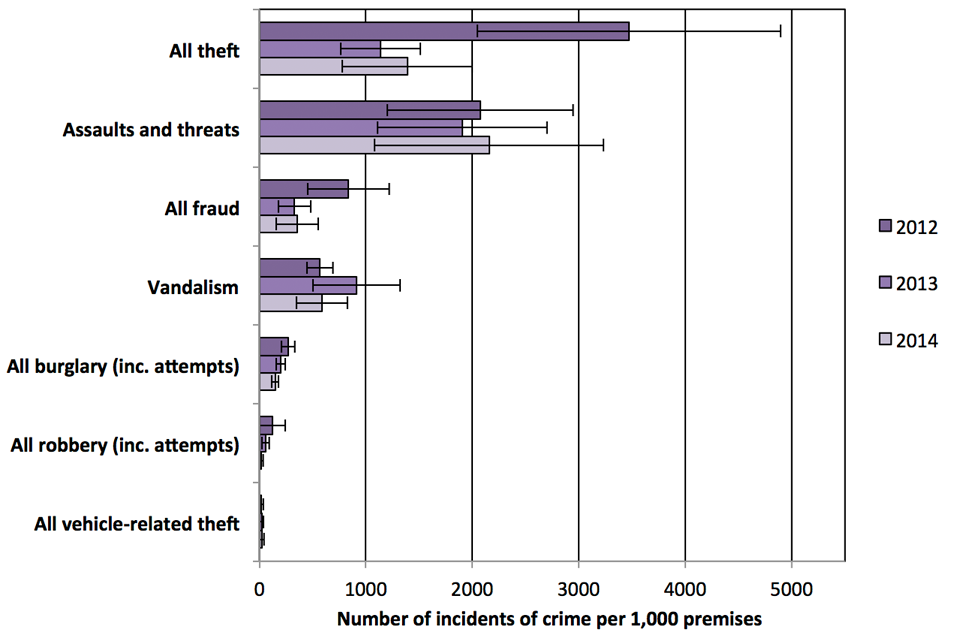
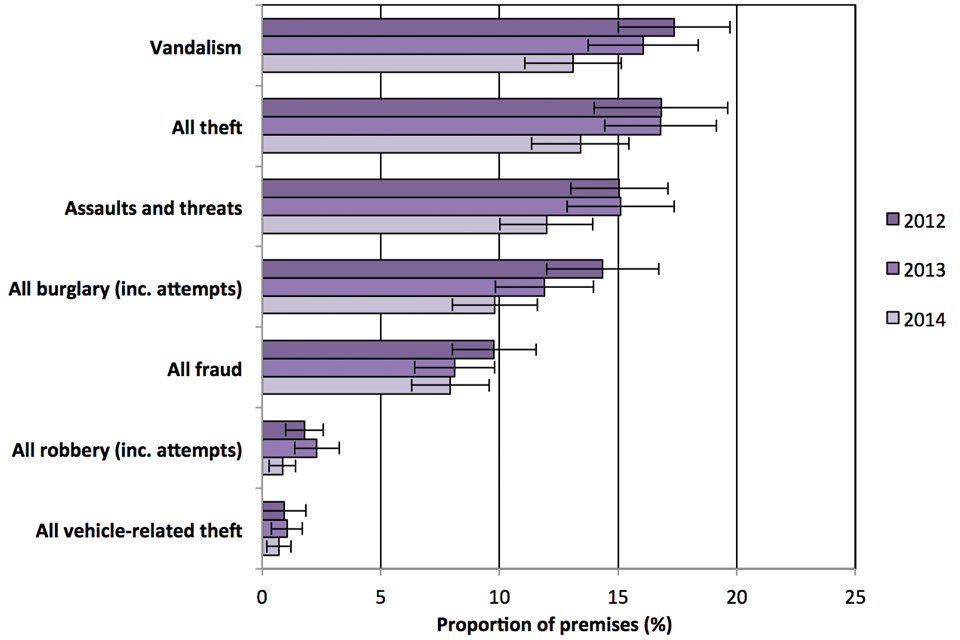
Figure E.1: Incidents of crime per 1,000 premises and proportion of premises that were victims, by sector, with 95% confidence intervals, 2012, 2013 and 2014
.
Introduction
This is the first release of data from the 2014 Commercial Victimisation Survey (CVS), a sample survey that examines the extent of crime against businesses in England and Wales. The CVS was previously run in 1994, 2002, 2012 and 2013, and is planned to be repeated annually from 2015 to 2017.
Each year a selection of industry sectors defined by the UK Standard Industrial Classification 2007 (SIC) is included in the CVS. The 2014 CVS focused on premises in three industry sectors. These were sections A (agriculture, forestry and fishing), G (wholesale and retail trade), and I (accommodation and food services activities). Between them, these three sectors accounted for just under a third of all business premises in England and Wales in 2014. In 2012 and 2013, four sectors were included in the survey. However, in 2014 the decision was taken to double the number of premises sampled in the wholesale and retail trade sector, and forego one of the other sectors. This was to allow more detailed analysis of trends in this sector due to high levels of interest in it.
All three of the sectors included in the 2014 survey were included in the 2013 survey, and two (wholesale and retail trade, and accommodation and food services activities) were also included in 2012. This means that it is now possible to look at trends in crime in these sectors in greater detail, by comparing data across the three year period. By including agriculture, forestry and fishing for a second time, comparisons can be made with 2013 for this sector. Decisions in relation to which sectors should be included were made following discussions with the CVS Steering Group, and in response to user needs. The sectors covered in future surveys will be decided in the same way, and we welcome all suggestions and feedback on this. If you would like to provide feedback, please email crimestats@homeoffice.gov.uk.
Trends over time and survey coverage
Although three years of data are now available for some sectors, comparisons between data from different survey years should be treated with caution due to the small sample sizes associated with each sector in the survey. In order to identify trends in business crime, changes between years need to be relatively large. It is therefore likely that true trends will only become apparent over the longer term.
It is important to note that although the Interdepartmental Business Register (IDBR), the sampling frame for the survey, covers 99 per cent of UK businesses, there will be some small businesses and recently started businesses that are not covered. As a result these will be excluded from the survey.
Terminology
Throughout the analysis presented in this bulletin, and its associated tables, there are four key measures of the extent of business crime presented. These focus on incidence i.e. the number of crimes taking place, and prevalence, i.e. the number of businesses that are victims. The main measures are as follows:
Total incidence: also referred to as the total crime count. This is the total number of incidents of crime experienced by business premises sampled from a particular sector. This is weighted (i.e. scaled-up) to represent the population of business premises as a whole.
Incidence rate:also referred to as the crime rate. This is the total number of incidents of crime, divided by the total number of business premises in that sector. The numbers are then multiplied by 1,000 to give the number of crimes per 1,000 premises, to allow the figures to be compared more easily. For example, comparing an incidence rate of 0.02 crimes per premises is generally not as easy to understand as a rate of 20 crimes per 1,000 premises.
Total prevalence: also referred to as the total victim count. This is the total number of premises that have been victims of crime. This is weighted (i.e. scaled-up) to represent the population of business premises as a whole.
Prevalence rate: also occasionally referred to as the victimisation rate. This is the total number of business premises that were victims of crimes, divided by the total number of premises in that sector. This gives the proportion of business premises that were victims.
One other measure that is presented is repeat victimisation. This is the number of times each victim (business premises) has experienced a particular crime. It is calculated by dividing the total number of crimes by the total number of premises that were victims. It is different from the incidence rate, which divides the total number of crimes by the total number of premises (i.e. including victims and non-victims).
Significance testing and confidence intervals
To analyse the responses to a sample survey such as the CVS, it is important to take into account the level of uncertainty introduced by using a sample, instead of the whole population of business premises in England and Wales.
To compare levels of crime in different years, statistical significance testing was carried out on the measures of crime described above. This technique is used to determine whether an observed difference is likely to be genuine rather than due to chance. Unless otherwise stated, all significance testing has been done at the 95% level, as is common for many surveys.
95% confidence intervals (error margins) have also been constructed. This is another statistical tool, closely related to significance testing. Where confidence intervals around two numbers do not overlap, the difference between the values is statistically significant. It is important to note that the opposite is not always true, i.e. overlapping confidence intervals do not always indicate a lack of statistical significance. To determine whether differences were statistically significant in such cases, formal significance testing was used. For further detail on these statistical tools, see the technical annex.
Data tables
The 2014 CVS headline tables include breakdowns, by sector and size band, of the following:
- the total number of incidents of crime (incidence, or crime count)
- the number of incidents of crime per 1,000 premises (incidence rate, or crime rate)
- the total number of victims of crime (prevalence, or victim count)
- the proportion of premises that experienced crime (prevalence rate, or victimisation rate)
The 2014 CVS comparison tables include comparisons of data from the 2014 CVS to data from the 2013 and 2012 CVS, for incidence rates, prevalence rates, reporting rates, organised crime perception rates and average numbers of incidents per victim. Statistically significant year-on-year changes are highlighted, and confidence intervals for the incidence and prevalence (by crime type) are also given.
The 2014 CVS anti-social behaviour, perceptions of policing and online crime tables show data discussed in chapter 5. Methodology tables are also provided.
Fact sheets and infographic
Summaries of the key findings from the 2014 CVS are available sector-specific fact sheets for the wholesale & retail, accommodation & food and agriculture, forestry & fishing sectors. The 2014 CVS infographic provides a visual summary of the key findings for all three sectors.
Further information
The dates of forthcoming publications are pre-announced and can be found via the gov.uk statistics release calendar. For further information about the Commercial Victimisation Survey please email crimestats@homeoffice.gov.uk.
Home Office Responsible Statistician
David Blunt, Chief Statistician and Head of Profession for Statistics Contact via crimestats@homeoffice.gov.uk.
This statistical release is produced to the highest professional standards and is free from political interference. It has been produced by statisticians working in the Home Office Statistics Unit in accordance with the Home Office’s Statement of Compliance with the Code of Practice for Official Statistics, which covers Home Office policy on revisions and other matters. The Home Office Statistics Unit works under the direct line management of the Home Office Chief Statistician, who reports to the National Statistician with respect to all professional statistical matters.
1. Crime against wholesale and retail premises
1.0 Introduction
In the 2014 Commercial Victimisation Survey (CVS), 2,109 respondents from premises in the wholesale and retail sector were asked if they had experienced any of a range of crime types in the 12 months prior to interview and, if so, how many incidents of crime had been experienced.
The wholesale and retail sector has now been included in the CVS for three years, so we are able to compare figures over this period. Most of the comparisons presented in this chapter are of 2014 against 2012 findings, as the most prominent changes in crime against this sector occurred over the two-year period. The relatively small sample size of the survey makes detecting changes between adjacent years more difficult. More information will become available in future years as longer trends develop. Comparisons with 2012 and 2013 figures, with results of statistical significance testing and confidence intervals, are presented in the accompanying 2014 CVS Comparison Tables. Premises from the wholesale and retail sector were previously also included in the 1994 and 2002 Commercial Victimisation Surveys. Due to changes in methodology between surveys and changes to the Standard Industrial Classification (SIC), estimates for this sector from the 2014 CVS can only be directly compared with the 2013 and 2012 surveys.
The 2014 CVS also collected information on areas such as online crime, organised crime, cost of crime, and reporting rates (to the police). These findings, and information on repeat victimisation (average number of crimes per victim), are presented here.
Most businesses from this sector are retailers (1,648 respondents). Wholesalers and motor vehicle trade and repair businesses are also included.
2014 CVS estimates for this sector are based on roughly twice the number of premises sampled for the 2012 and 2013 CVS. This followed extensive consultation with users and the CVS steering group, which highlighted a clear interest in finding out more about crime against this sector. Data are weighted to ensure that the sample is representative of wholesale and retail businesses in England and Wales as a whole. Results for all CVS sectors, including the wholesale and retail sector, are presented in the accompanying 2014 CVS Headline Tables.
Please refer to the introduction to this report for further information about the contents of data tables accompanying the publication.
1.1 Key findings
Crime in the wholesale and retail sector fell significantly between 2012 and 2014.
The number of incidents experienced by this sector fell from 7.7 million in 2012 to 4.1 million in 2014. This fall was statistically significant, and was largely driven by falls in shoplifting.
Shoplifting (customer theft) has fallen significantly compared with 2012.
Compared with 2012, the 2014 CVS shows that the number of thefts in the wholesale and retail sector has fallen by around a third, from 15,836 to 10,319 incidents per 1,000 premises. Within this, theft by customers (shoplifting) has fallen by 3,749 incidents per 1,000 premises, from 10,445 to 6,695 incidents per 1,000 premises. Both falls are statistically significant.
The proportion of premises experiencing crime in this sector also fell significantly.
The proportion of wholesale and retail premises that were victimised has fallen from 53 per cent in 2012 to 45 per cent in 2013 and to 41 per cent in 2014. Both decreases are statistically significant and are driven by statistically significant falls for a wide range of crime types.
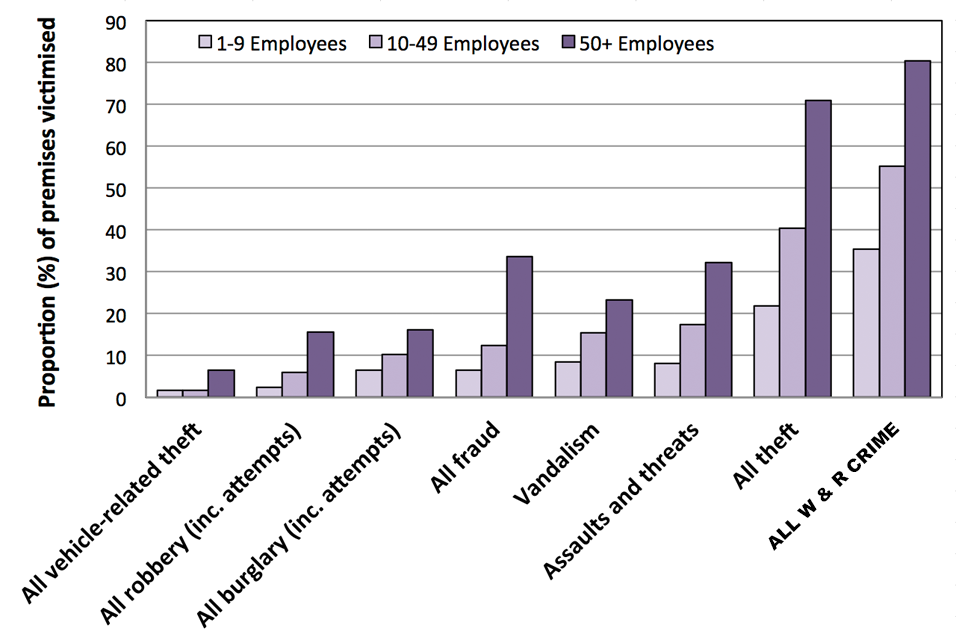
Larger businesses in this sector experienced higher crime rates and prevalence rates.
In 2014, those premises in the wholesale and retail sector with 50 or more employees experienced six times more crimes on average than those with 10-49 employees, and 40 times more than those with 1-9 employees. Similarly, higher proportions of premises with 50 or more employees were victims of crime (80%), than those premises with 10-49 employees (55%) or 1-9 employees (35%).
1.2 Extent of crime against wholesale and retail premises
Table 1.1: Experiences of crime in the last 12 months, wholesale and retail sector, 2014 cvs
| Crime type | Number of crimes (000s) | Number of crimes per 1,000 premises | Number of victims (000s of premises) | % of premises experiencing | Average number of crimes experienced by each victim (premises) |
|---|---|---|---|---|---|
| All burglary (inc. attempts) | 45 | 143 | 24 | 8 | 2 |
| Vandalism | 97 | 308 | 33 | 10 | 3 |
| All vehicle-related theft | 13 | 40 | 6 | 2 | 2 |
| All robbery (inc. attempts) | 63 | 199 | 11 | 3 | 6 |
| Assaults and threats | 410 | 1,301 | 34 | 11 | 12 |
| All theft | 3,255 | 10,319 | 85 | 27 | 38 |
| Thefts by customers | 2,112 | 6,695 | 63 | 20 | 33 |
| Thefts by employees | 69 | 219 | 11 | 3 | 6 |
| Thefts by others | 64 | 202 | 7 | 2 | 10 |
| Thefts by unknown persons | 1,010 | 3,202 | 25 | 8 | 41 |
| All fraud | 240 | 761 | 27 | 8 | 9 |
| All wholesale and retail crime | 4,123 | 13,070 | 128 | 41 | 32 |
Unweighted base: 2,109 premises
Table 1.2: Changes in crime in the wholesale and retail sector, 2014 compared with 2012 CVS
| Crime type | Change in number of crimes per 1,000 premises | Change in % of premises experiencing | Change in average number of crimes experienced by each victim (premises) |
|---|---|---|---|
| All burglary (inc. attempts) | -194 * | -4% * | -1 |
| Vandalism | -177 | -6% * | -0.07 |
| All vehicle-related theft | -31 | -3% * | +1 |
| All robbery (inc. attempts) | -434 | +1% | - |
| Assaults and threats | +127 | +0.4% | +1 |
| All theft | -5,517 * | -5% * | -12 |
| Thefts by customers | -3,749 * | -1% | -16 * |
| Thefts by employees | -424 | -1% | -7 |
| Thefts by others | +64 | +0.1% | +3 |
| Thefts by unknown persons | -1,407 | -5% * | +6 |
| All fraud | -406 | -4% * | -0.3 |
| All wholesale and retail crime | -6,630 * | -12% * | -5 |
Table notes
- columns related to victims may not sum to the totals shown for all crime: this is because one premises can be a victim of more than one type of crime; other columns may not sum exactly to the total shown due to rounding
- statistically significant changes are indicated with asterisks (*); other changes are not significant;
a hyphen (-) indicates that a figure is not shown because its unweighted base is fewer than 50 respondents
Source: Home Office, 2014 CVS Headline Tables and 2014 CVS Comparison Tables.
Wholesale and retail premises experienced 4.1 million crimes in the year prior to interview. Of these, over three quarters of incidents were thefts and, specifically, over half (51%) of the 4.1 million incidents were theft by customers (i.e. shoplifting, 2.1 million incidents). A further one million incidents (24%) were due to theft by unknown persons. These are similar proportions to 2013 and 2012, when theft by customers accounted for 55 and 53 per cent of all incidents against wholesale and retail premises, respectively, and theft by unknown persons accounted for 21 and 23 per cent, respectively.
The breakdown of the theft figures is affected by the fact that it is not always possible to identify the offender. It is likely that some of the thefts by unknown persons were committed by customers. Over the past 3 years, the proportion of incidents due to thefts by customers or by unknown persons has remained at 76 per cent of the total number of incidents experienced by wholesale and retail premises.
Number of incidents per 1,000 premises
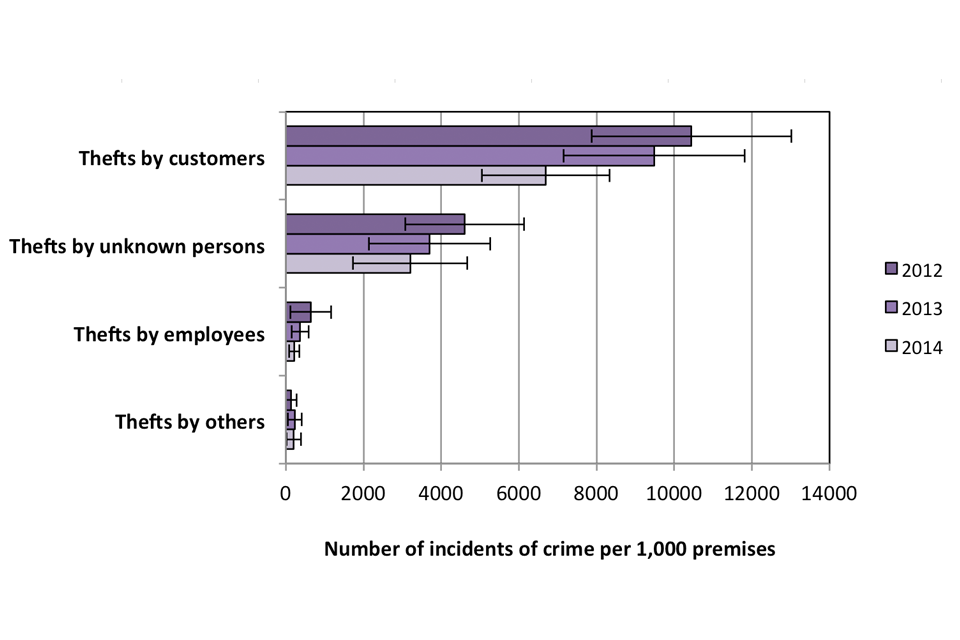
In 2014, thefts by customers fell significantly compared with 2012, but still accounted for the largest number of all crime types against the wholesale and retail sector, with 2,112 incidents in the 12 months prior to interview (6,695 incidents per 1,000 premises), see Tables 1.1 and 1.2.
The total number of incidents of crime per 1,000 premises also fell significantly compared with 2012, largely due to the above fall in thefts by customers. Further comparisons to 2012 and 2013 CVS figures are published in table “W&R” in the 2014 CVS Comparison Tables.
Figure 1.1: Incidents of theft per 1,000 premises, by type, experienced by wholesale and retail premises in the last 12 months, with 95% confidence intervals, 2012, 2013 and 2014 CVS
.
Chart notes
- theft is presented separately due to its large scale relative to the other crime types
- error bars represent 95% confidence intervals; while non-overlapping confidence intervals usually indicate a statistically significant difference, overlapping confidence intervals do not always indicate a lack of statistical significance
Source: Home Office, 2014 CVS Comparison Tables.
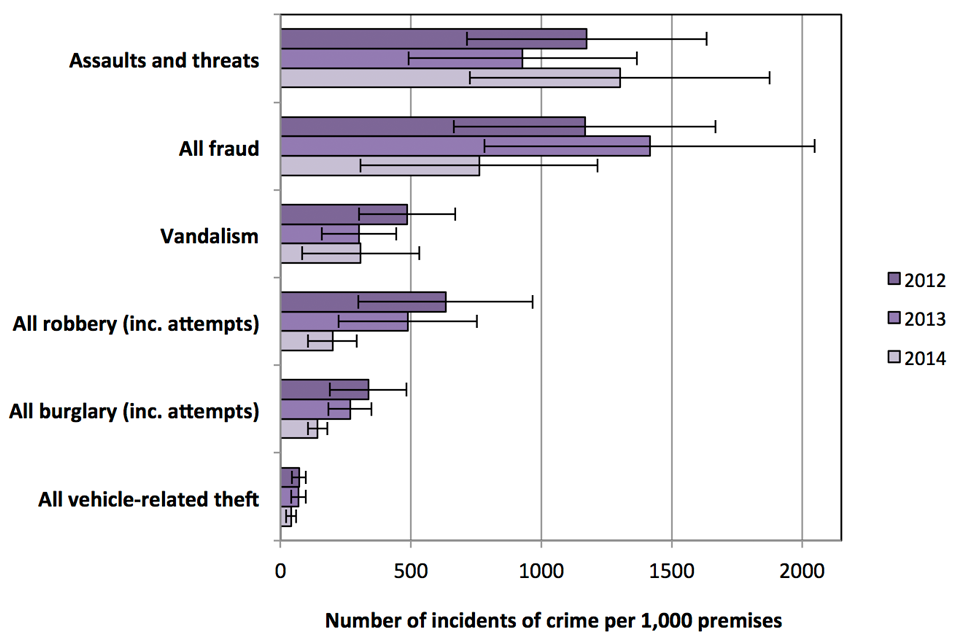
Figure 1.2: Incidents of crime per 1,000 premises (excl. thefts) experienced by wholesale and retail premises in the last 12 months, with 95% confidence intervals, 2012, 2013 and 2014 CVS
.
Chart notes
- theft is presented separately due to its large scale relative to the other crime types
- error bars represent 95% confidence intervals; while non-overlapping confidence intervals usually indicate a statistically significant difference, overlapping confidence intervals do not always indicate a lack of statistical significance
Source: Home Office, 2014 CVS Comparison Tables.
Proportions of premises that experienced a crime
The level of victimisation in the wholesale and retail sector was relatively high compared with the other sectors surveyed in 2014, but has fallen significantly over the past two years. In 2014 just over two-fifths (41%) of premises in this sector experienced a crime in the 12 months prior to interview, compared with 45% in 2013 and more than half (53%) in 2012. In both years the fall was statistically significant.
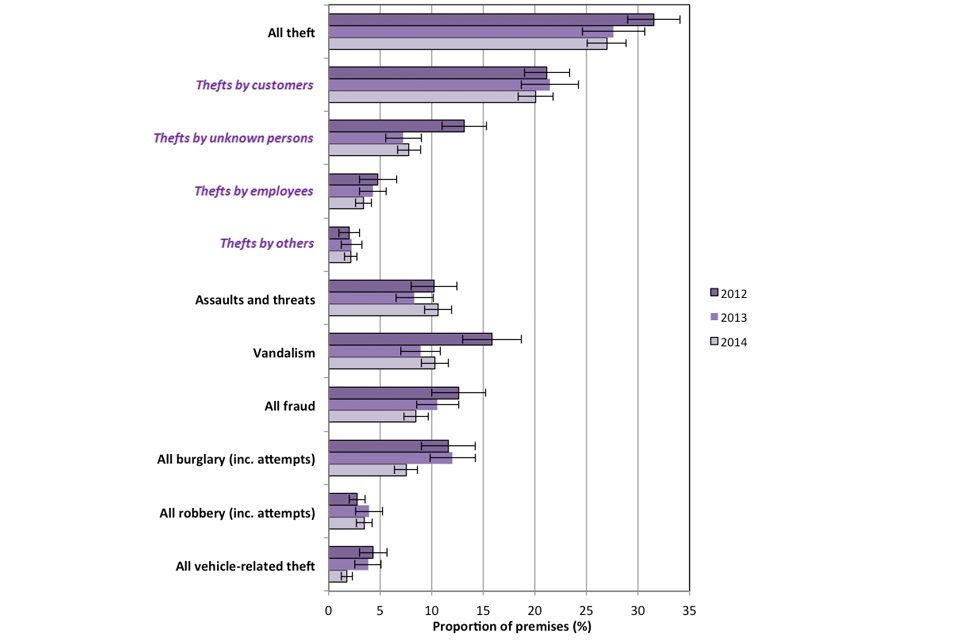
One-fifth (20%) of premises experienced theft by customers, around one-tenth (11%) experienced an assault or threat and 10 per cent experienced vandalism; these crime types showed the highest levels of victimisation in the wholesale and retail sector in 2014.
Compared with 2012, there were many statistically significant falls in the proportion of premises in this sector experiencing a variety of crime types (Table 1.3). Changes in victimisation levels compared with 2012 and 2013 can be found in the 2014 CVS Comparison Tables.
Figure 1.3: Proportion of wholesale and retail premises that experienced crime in the last 12 months, by type, with associated 95% confidence intervals, 2012, 2013 and 2014 CVS
.
Chart notes
- thefts by unknown persons, thefts by employees, thefts by customers and thefts by others are subsets of all thefts
- error bars represent 95% confidence intervals; while non-overlapping confidence intervals usually indicate a statistically significant difference, overlapping confidence intervals do not always indicate a lack of statistical significance
Source: Home Office, 2014 CVS Comparison Tables.
Incidence and prevalence rates by business size
As previously shown by the 2012 and 2013 CVS, incidence rates of crime (i.e. number of incidents per 1,000 premises) are higher for premises with more employees. In both 2013 and 2014, large businesses had significantly higher incidence rates. This pattern was particularly noticeable in the incidence rates of theft. The overall number of thefts per 1,000 premises with 50 or more employees was 21 times higher than those for premises with fewer than 50 employees in 2014.
Higher rates of (i) fraud and (ii) assault or threat against larger businesses also contributed to the differences in crime rates by business size. Together with theft, these were the three most common crime types experienced in this sector in the past year (Table 1.4).
Table 1.4: Number of incidents per 1,000 premises for most common crime types, by premises size, wholesale and retail sector, 2014 CVS
| England and Wales | ||||
|---|---|---|---|---|
| Crime type | 1 to 9 employees | 10 to 49 employees | 50+ employees | All premises |
| All theft | 2,546 | 22,869 | 129,586 | 10,319 |
| Assaults and threats | 757 | 1,496 | 14,050 | 1,301 |
| All fraud | 338 | 747 | 11,737 | 761 |
| All wholesale and retail crime | 4,039 | 26,277 | 160,510 | 13,070 |
Source: Home Office, 2014 CVS Comparison Tables.
A breakdown of prevalence rates by size (Figure 1.4) presents a similar picture. The proportions of premises that experienced a crime in the 12 months prior to interview also increased with the number of employees at the premises, and were highest for theft, but varied less than the numbers of incidents per 1,000 premises.
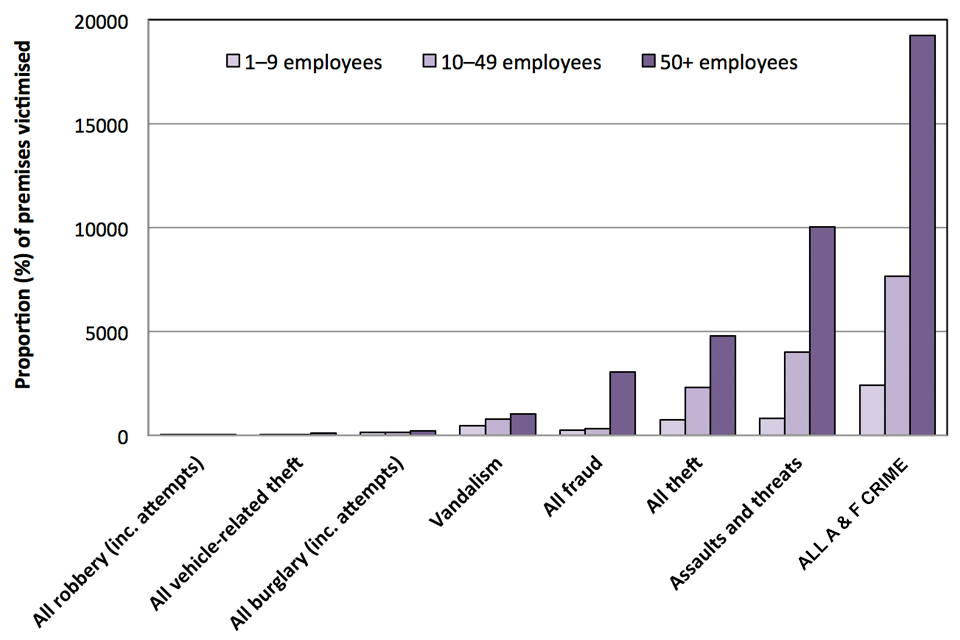
Figure 1.4: Proportion of wholesale and retail premises that experienced crime in the last 12 months, by crime type and number of employees at premises, 2014 CVS
.
Source: Home Office, 2014 CVS Comparison Tables.
Average number of incidents of crime per victim (premises)
The average number of incidents of crime per victim is a measure of repeat victimisation, representing the average number of times each victim has experienced a particular crime. It is calculated by dividing the total number of crimes by the total number of victims. Changes in the average number of incidents per victim depend on both the number of incidents and the number of victims. For example, if the number of incidents increases, but the number of victims increases by more, this measure will actually fall. This measure can reveal some interesting trends in crime.
Overall, each victim of crime in the wholesale and retail sector experienced an average of 32 incidents in the last year. The highest average numbers of incidents per victim were for thefts, with each theft victim experiencing an average of 38 thefts in the last year. Looking at different types of theft, there were 33 incidents per victim of theft by customers, and 41 incidents per victim of theft by unknown persons.
Theft by customers (33 incidents per victim) has fallen from 49 incidents per victim in 2012 and 44 incidents per victim in 2013. The decrease over the two years since 2012 is statistically significant, although the decrease from 2013 alone is not. Theft by unknown persons (41 incidents per victim) has fallen compared with 2013 (from an average of 51 incidents per victim), but risen compared with 2012 (from an average of 35 incidents per victim); neither change is statistically significant.
1.3 Other results from the survey
This section includes findings on shoplifting (theft by customers) and its cost, online crime, reporting rates and organised crime.
Shoplifting
The 2014 CVS reveals that shoplifting (theft by customers) made up 51% of all incidents of crime in the wholesale and retail sector in 2014. It was the most common crime type, with 6,695 incidents per 1,000 premises, although this has fallen significantly since 2012 (by 3,749 incidents per 1,000 premises).
In 2014, 20 per cent of premises experienced shoplifting, which was broadly similar to 2012. The average number of shoplifting incidents per victim has fallen significantly, down to 33 incidents per victim, compared with 49 incidents per victim in 2012.
It is important to note that the CVS may underestimate the volume of shoplifting, as the “theft by unknown persons” category may also contain a large proportion of unidentified customer thefts. However, it is likely that this will have been the case for each of the years from 2012 to 2014, so this should not affect the overall direction of the trend.
These findings are comparable[footnote 1] to findings from the British Retail Consortium (BRC) Retail Crime Survey 2014, which also showed that theft by customers made up the majority of crime against retailers (81%). According to the BRC survey, customer theft has decreased slightly in the past year from 631,391 incidents in 2012/13 to 552,069 in 2013/14. This is also consistent with the trend shown by the 2014 CVS, where customer theft fell from 3.25 million incidents in 2013 to 2.11 million in 2014.
By contrast, the latest police recorded crime statistics published by the Office for National Statistics (ONS) show an increase in shoplifting. The number of shoplifting offences recorded by the police rose from 317,047 offences in the year ending December 2013 to 325,504 offences in the year to December 2014, an increase of 3 per cent. However, the increase in the number of offences recorded by the police could be due to an increase in the proportion of shoplifting incidents that come to the attention of police, or changes to police recording practices. This is supported by the fact that the police recorded crime figures are lower than those reported by the CVS and BRC.
The 2014 CVS estimates that the mean cost of shoplifting per incident in 2014 was £126. This is a fall compared with both 2012 (£157) and 2013 (£177) CVS data, though neither change is statistically significant. Meanwhile the number of incidents of shoplifting has fallen significantly between 2012 and 2014 (Figure 1.5). For more information on how the costs of shoplifting are calculated, please see the technical annex.
These findings contrast those reported in the BRC Retail Crime Survey 2014, which reported a 36% increase in the average cost of theft by customers between 2012/13 and 2013/14, and a 4% fall in the volume of shoplifting. The CVS suggests that while the volume of shoplifting may be falling, the average cost is not increasing, and if anything may also be falling.
Figure 1.5: Incidents of theft by customers per 1,000 premises and mean value of items stolen/unpaid per incident, wholesale and retail sector, 2012, 2013 and 2014 CVS

.
Chart notes
Error bars represent 95% confidence intervals. While non-overlapping confidence intervals usually indicate a statistically significant difference, overlapping confidence intervals do not always indicate a lack of statistical significance.
Source: Home Office, 2014 CVS survey responses and 2014 CVS Headline Tables.
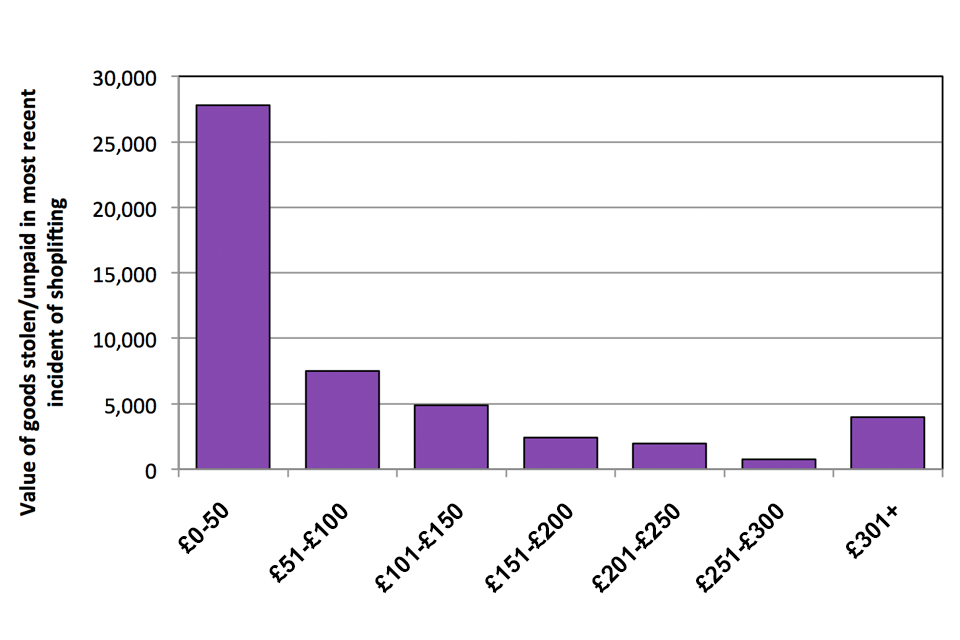
Comparing the mean, median and maximum costs of the most recent shoplifting incident experienced by respondents in the 12 months prior to interview (Table 1.5) reveals that most incidents of shoplifting are fairly low-cost, although there are a small number of incidents where high-value items have been taken in each of the last three years. This can be seen from the fact that the mean is higher than the median for each year; for this reason, when looking at the costs of shoplifting it is often more informative to consider the median cost rather than the mean. This pattern is also illustrated by figure 1.6, which shows that the majority of shoplifting incidents in 2014 involved relatively low value items being stolen.
Table 1.5: Value of items stolen/unpaid in the most recent incident of shoplifting experienced in the 12 months prior to interview, wholesale and retail sector, 2012, 2013 and 2014 CVS
| Value of items stolen/unpaid | 2012 | 2013 | 2014 |
|---|---|---|---|
| Mean value of items stolen/unpaid | £158 | £177 | £126 |
| Median value of items stolen/unpaid | £35 | £50 | £40 |
| Maximum value of items stolen/unpaid | £20,000 | £3,000 | £2,500 |
| Unweighted base | 213 | 207 | 508 |
Table note
This analysis excludes two cases where the numbers of crimes reported were so large that it was judged that they were very likely to be erroneous or that the respondents had misunderstood some questions. For further details please see the methodology section of the technical annex.
Source: Home Office, 2014 CVS survey responses.
Figure 1.6: Incidents of shoplifting grouped by value of goods stolen/unpaid, based on the most recent incident experienced by each premises, wholesale & retail sector, 2014 CVS
.
Unweighted base: 508 premises.
Source: Home Office, 2014 CVS survey responses.
Supermarkets experienced significantly higher incidence and prevalence rates for shoplifting, compared with the sector as a whole. In 2014 supermarkets experienced 63,158 incidents of shoplifting per 1,000 premises, compared with 6,695 incidents per 1,000 premises across the wholesale and retail sector. Similarly, 64 per cent of supermarkets were victims of shoplifting, compared with 20 per cent of all wholesale and retail premises. Shoplifting from supermarkets accounts for one third (33%) of all customer theft in the wholesale and retail sector, although retail supermarket premises account for only 3% of all premises in this sector.
Shoplifting and self-service tills
The 2014 CVS included a new question, asking retail supermarket premises whether they had any self service tills. The responses to this question give an estimate of how many supermarkets have self-service tills, and allow a comparison of shoplifting rates for premises with and without self-service tills.
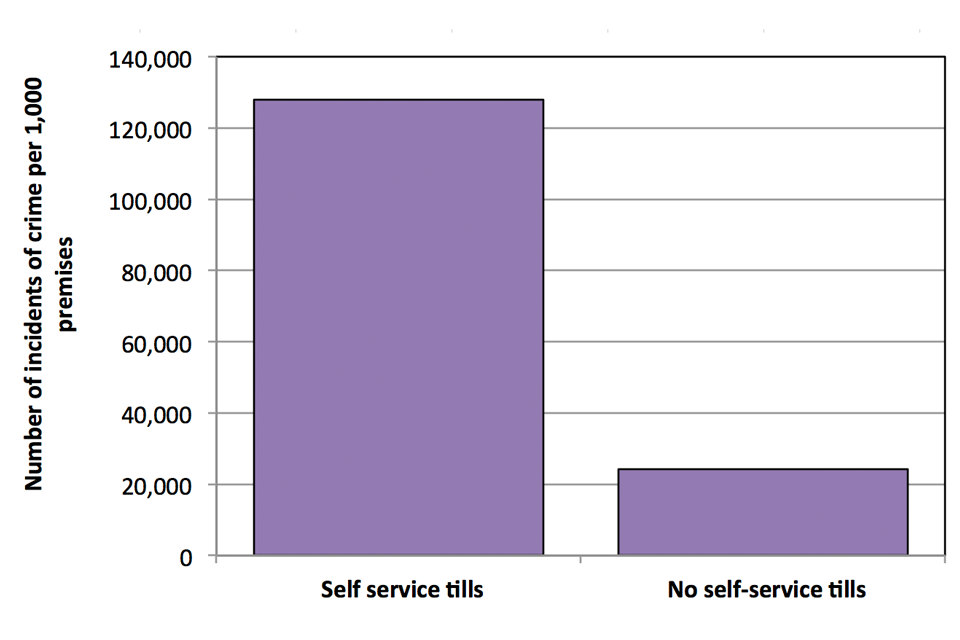
The survey found that self-service tills were found in fewer than half (38%) of supermarkets. However, the survey also suggested that supermarkets with self-service tills were significantly more likely to experience shoplifting than those without, with 86 per cent of those with self-service tills being victims, compared with 52 per cent of those without. Those with self-service tills also experienced significantly more crimes (figure 1.7).
These findings suggest a link between self-service tills and higher levels of shoplifting. However, it is important to note that this possible link does not show that self-service tills cause higher levels of shoplifting. Large supermarket premises are much more likely to contain self-service tills (89% contain them) than small ones (8%), so the size of the supermarket may be the important factor, rather than the presence of self-service tills. Other research into the effect of self-service tills on shoplifting has not demonstrated a clear link between the two, but does suggest that they may generate some additional crime [footnote 2].
Figure 1.7: Rates of shoplifting for supermarkets with, and without, self-service tills
.
Unweighted base: 187 premises.
Source: Home Office, 2014 CVS survey responses.
As shown in table 1.4 and figure 1.4, large premises in this sector are more likely to be victims of crime, and also experience more crimes (especially thefts) than smaller premises. To truly establish a link between self-service tills and shoplifting, it would be necessary to analyse the link between self-service tills and shoplifting independently of other factors. For this analysis to be robust, more data would be needed, which may become available from future surveys.
Online crime
Online crime covers a range of crime types carried out over computer networks. Respondents from this sector, who used computers at their premises, were asked about their experience of various types of online crime. See the technical annex for the online crime types covered in the survey and for further details of online crime. It is important to bear in mind that respondents were only asked about online crimes affecting the premises. Many online crimes may affect only head offices and will not have been picked up by the survey.
Half of the respondents from the wholesale and retail sector were asked whether computers were used at the premises. Those who used computers were then asked about their business’s experience of online crime. In the wholesale and retail sector 85% of businesses said they used computers, compared with 84% across all the six sectors surveyed in 2012, 2013 and 2014.
The 2014 CVS estimates that there were 136,000 incidents of online crime against businesses in the wholesale and retail sector in the 12 months prior to interview. This is a notable decrease compared with 2013 (234,000 incidents), but an increase compared with 2012 (69,000 incidents). Neither change is statistically significant, reflecting the degree of uncertainty associated with the small sample. However, compared with 2012, there has been a statistically significant increase (+3%) in the proportion of premises that have experienced a computer virus.
The most commonly experienced online crimes in each of the last three years were computer viruses. In 2014 there were 118,000 incidents in the year prior to interview, making up 87 per cent of all incidents of online crime against this sector (compared with 91 per cent in 2013 and 81 per cent in 2012).
The number of online crime incidents per 1,000 premises was higher for premises with fewer employees (see table 1.7). This may suggest that smaller businesses spend less on IT security. Findings from the 2013 CVS suggest that larger businesses have a larger spend on online security.
Around 10 per cent of all wholesale and retail premises experienced at least one type of online crime in the last year, with nine per cent experiencing a virus and two per cent experiencing hacking in the 12 months prior to interview. Victimisation of the other types of online crime (such as hacking or phishing) was less widespread. Possible reasons for this are discussed in more detail in Chapter 4, which presents cross-sector CVS findings.
Table 1.6: Experiences of online crime in the last 12 months, wholesale & retail sector, 2014 CVS
| Crime type | Number of crimes (000s) | Number of crimes per 1,000 premises | Number of victims (000s of premises) | % of premises experiencing | Average number of crimes experienced by each victim (premises) |
|---|---|---|---|---|---|
| Hacking | 6 | 19 | 5 | 2 | 1 |
| Phishing | 5 | 15 | 1 | 0 | 7 |
| Theft of money (online) | 5 | 15 | 1 | 0 | 7 |
| Theft of information (online) | 0 | 1 | 0 | 0 | 2 |
| Website vandalism | 2 | 8 | 1 | 0 | 2 |
| Computer virus | 118 | 373 | 28 | 9 | 4 |
| All online crime | 136 | 430 | 31 | 10 | 4 |
Unweighted base: 1,097 premises
Table 1.7: Numbers of online crime per 1,000 premises in the last 12 months, by number of employees at premises, wholesale & retail sector, 2014 CVS
| Crime type | 1 to 9 Employees | 10 to 49 Employees | 50+ Employees | Total |
|---|---|---|---|---|
| Hacking | 22 | 6 | 13 | 19 |
| Phishing | 2 | 67 | 0 | 15 |
| Theft of money (online) | 2 | 67 | 4 | 15 |
| Theft of information (online) | 0 | 5 | 0 | 1 |
| Website vandalism | 7 | 12 | 5 | 8 |
| Computer virus | 417 | 240 | 126 | 373 |
| All online crime | 449 | 398 | 148 | 430 |
| Unweighted base | 668 | 214 | 215 | 1097 |
Table notes
- columns related to victims do not sum to the totals shown for all online crime; this is because one premises can be a victim of more than one type of crime; other columns may not sum exactly to the total shown due to rounding
- since computers are used at a high proportion of premises, incidence and prevalence rates are reported relative to the total number of business premises in the sector, not only those where computers are used
- incidents of online crime are not included in the overall count of CVS crime as these questions are only asked of half the sample and there is a risk of double-counting with other crime types, such as theft or fraud
- although described here as crimes, it is worth noting that not all of these incidents would be recorded as a crime by the police; whether receiving a phishing email or being infected by virus is counted under police recorded crime depends on whether the incident was targeted at a specific victim, or any financial loss was incurred, as per the Home Office Counting Rules
Source: Home Office, 2014 CVS Headline Tables.
Reporting rates
The 2014 CVS asked those respondents who had experienced crime in the past year whether the police came to know about the most recent incident of each crime type experienced.
Table 1.8 compares 2014 CVS reporting rates to 2013 and 2012. Comparisons should be treated with some caution given their variability from one year to the next in many cases.
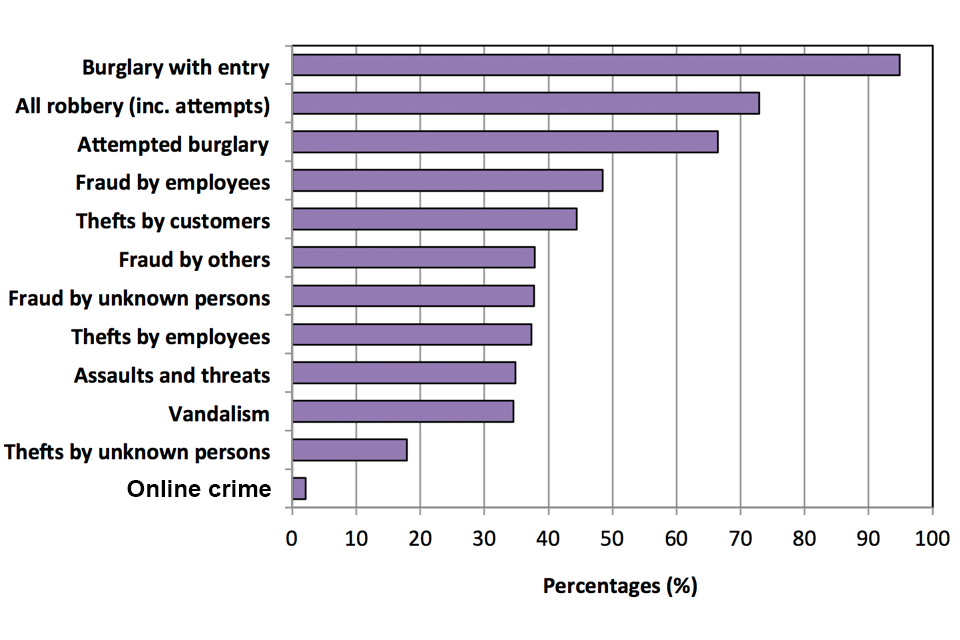
Where sample sizes were large enough to look at reporting rates for the wholesale and retail sector, the CVS showed that reporting rates varied considerably by the type of offence (table 1.8, figure 1.8). Estimates show that incidents of burglary and robbery were well reported, with 95 per cent of incidents of burglary with entry, 73 per cent of incidents of all robbery and 66 per cent of incidents of attempted burglary being reported to police for this sector.
Table 1.8: Proportion of most recent incidents of crime in the wholesale and retail sector reported to police, by crime type, 2012, 2013 and 2014 CVS.
| Percentages | |||||
|---|---|---|---|---|---|
| Crime type | 2012 | 2013 | 2014 | Change (2012 to 14) | Change (2013 to 14) |
| All burglary (inc. attempts) | |||||
| Burglary with entry | 87 | 82 | 95 | +8 | +13 * |
| Attempted burglary | 62 | 66 | 66 | +5 | +1 |
| Vandalism | 46 | 35 | 35 | -11 * | -1 |
| All vehicle-related theft | |||||
| Theft of vehicles | - | - | - | - | - |
| Theft from vehicles | 62 | - | - | - | - |
| All robbery (inc. attempts) | - | - | 73 | - | - |
| Assaults and threats | 29 | 36 | 35 | +6 | -1 |
| All theft | |||||
| Thefts by customers | 41 | 42 | 44 | +3 | +2 |
| Thefts by employees | 28 | 31 | 37 | +10 | +6 |
| Thefts by others | - | - | - | - | - |
| Thefts by unknown persons | 26 | 33 | 18 | -8 | -15 * |
| All fraud | |||||
| Fraud by employees | - | - | 49 | - | - |
| Fraud by others | 42 | 59 | 38 | -4 | -21 * |
| Fraud by unknown persons | - | - | 38 | - | - |
| Online crime | - | - | 2 | - | - |
Table notes
- numbers are rounded to the nearest percentage point; changes between years were calculated before rounding
- results are not shown where the unweighted base was fewer than 50; they are represented by a hyphen (-)
- atatistically significant changes are shown in bold italics with asterisks (*); other changes are not significant
- it is not possible to show percentages for combined crime groups (e.g. all burglary) as the questions on reporting are asked regarding the most recent incident experienced in the last 12 months, which cannot be identified for groups
- fraud offences may have been reported to Action Fraud, the central recording body for fraud offences, not the police
Source: Home Office, 2014 CVS Headline Tables.
The high reporting rates for these crime types are likely to reflect the need for victims to obtain a crime reference number from the police in order to make an insurance claim. Reporting rates were comparatively low for theft by employees (37%), assaults and threats (35%), vandalism (35%) and thefts by unknown persons (18%).
Figure 1.8: Proportion of incidents experienced by premises in the wholesale and retail sector reported to the police (%), for selected crime types, 2014 CVS
.
Chart note
Some categories are not shown due to having an unweighted base of fewer than 50 respondents.
Source: Home Office, 2014 CVS Headline Tables.
Organised Crime
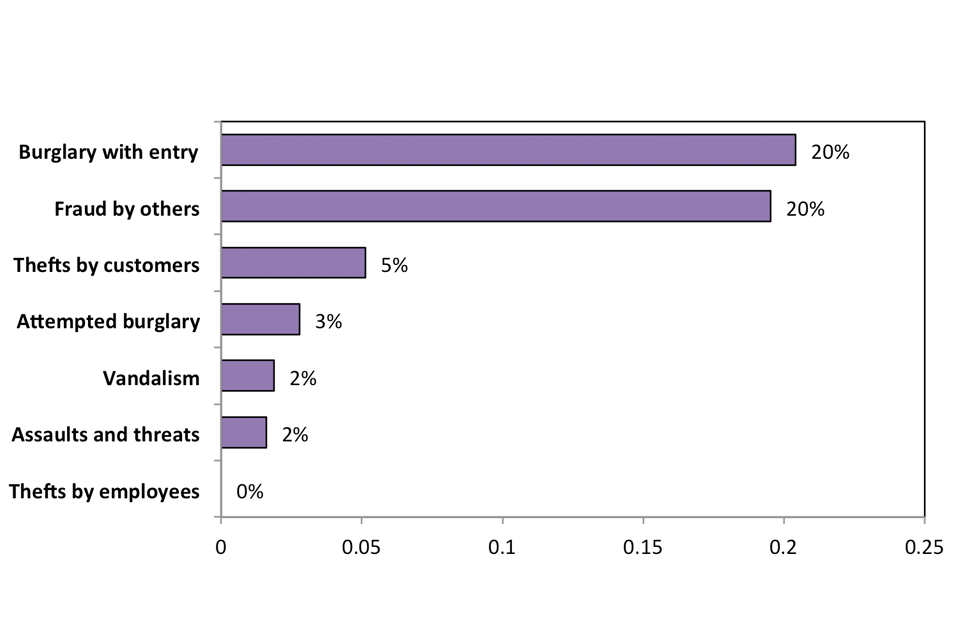
Organised crime is defined as crime that involves individuals, normally working with others, committing serious crime on a continuing basis. Focusing on the most recent incident of each crime type experienced in the 12 months prior to interview, respondents in the wholesale and retail sector were asked whether they perceived it to have been carried out by “an organised group of criminals”, a “loosely knit group”, or “someone working alone”.
The crime most commonly perceived as organised was burglary with entry, with 35% of respondents saying that they thought the last incident of burglary with entry they experienced was carried out by an organised group of criminals. Attempted burglary was the second most common crime type perceived as organised (27%), followed by fraud by others (22%). Conversely, the crime types least likely to have been perceived as organised crime were thefts by employees (0%), assaults and threats (2%) and vandalism (4%).
Compared with 2013, there has been a small (+4%) but statistically significant increase in the proportion of thefts by customers, which were perceived to have been carried out by an organised group of criminals. The proportion of such incidents remains low (9%) and this is consistent with findings from the Association of Convenience Stores (ACS) which likewise reported that organised crime was attributed to 9 per cent of shop theft.
There have also been larger statistically significant increases in the proportions of burglary (+18%) and attempted burglary (+18%) perceived to be carried out by an organised group compared with 2013. In comparison to 2012, the proportion of attempted burglaries perceived to be organised crime also rose significantly (+19%). However, there is a lot of variation in the estimated numbers of organised crimes over the three years, so these numbers should be interpreted with caution.
Chapter 4 explores the reasons respondents gave for thinking that a crime was carried out by an organised group of criminals. Figures on the proportion of incidents respondents thought were carried out by an organised group of criminals, by industry sector, can be found in Table OC2 in the 2014 CVS Headline Tables.
Comparison with 2002
A comparison between the wholesale and retail sector in 2002 and 2012 was carried out for the Crime against businesses: Detailed findings from the 2012 Commercial Victimisation Survey report, published in June 2013. Analysis was based on a subset of the 2012 CVS data in order to make it directly comparable with the 2002 dataset (see the report for more details). The analysis showed there were around 14.5 million fewer crimes against wholesale and retail business premises in 2012 than in 2002 (down from around 21.5 million to around 8 million).
Comparison with other sources
The British Retail Consortium (BRC) Retail Crime Survey 2014 results show that theft by customers made up the majority of crime against retailers (81%) and fraud accounted for the second highest proportion of all retail crimes (17 per cent). This reflects the CVS finding that the most common crime types experienced by the wholesale and retail sector are thefts, although the CVS places assaults and threats as the second most common crime type, followed by fraud.
Although there are some similarities between the CVS and BRC results in terms of the crime types affecting the sector, the trends in crime sometimes differ between the two. This may be due to differences in coverage and methodology between sources. CVS results are based on wholesalers as well as retailers, whereas the BRC survey covers only retailers. In addition, the CVS is sampled at premises level, whereas the BRC samples respondents at enterprise level; differences may therefore be due to incidents not being reported to head offices (for those retailers with head offices), or differences in recording practices at the premises and enterprise level. The time periods of the two surveys also differ, with the CVS being based on calendar years while the BRC survey results are based on financial years.
In addition, victims captured in the CVS are only asked if they reported the most recent incident to the police, not all incidents. Therefore results could be subject to recall error, where respondents recall the most prominent (rather than most recent) incident. This may lead to higher ‘reporting’ figures, as more prominent incidents are more likely to be reported to the police. It is also possible that some CVS victims may say they reported to the police, but actually reported to their internal security, for example. When comparing results of the BRC survey with the CVS, users should bear in mind these differences between the two surveys.
Despite the differences described above, it is useful to compare findings from different sources of data, such as the BRC, CVS, and police recorded crime statistics. According to the BRC survey, customer theft has decreased slightly in the last year, from 631,391 incidents in 2012 to 2013, to 552,069 in 2013 to 2014. This is consistent with the trend shown by the 2014 CVS. However, the BRC also shows a long term increase in customer theft, from just under 3,000 incidents per 100 stores in 2007 to 2008 to around 4,500 in 2013 to 2014.
In the case of burglary rates, the BRC showed a 22 per cent fall between 2012 to 2013 and 2013 to 2014, while the CVS showed a 46 per cent fall in the wholesale and retail sector between 2013 and 2014, which was statistically significant. Both surveys also indicated falls in robbery and employee theft, although in the case of the CVS these falls were not statistically significant. However, there are areas where the two surveys differ. For example, while the BRC survey found that fraud and online crime had increased in 2013 to 2014 compared with the year before, the CVS indicated a fall between 2013 and 2014, albeit not statistically significant.
By contrast, the latest police recorded crime statistics published by the Office for National Statistics (ONS) show an increase in shoplifting. The number of shoplifting offences recorded by the police rose from 317,047 offences in the year, to December 2013 to 325,504 offences in the year to December 2014, an increase of 3 per cent. However, the increase in the number of offences recorded by the police could be due to an increase in the proportion of shoplifting incidents that come to the attention of police, or changes to police recording practices. This is supported by the fact that the police recorded crime figures are lower than those reported by the CVS and BRC.
The Association of Convenience Stores also present statistics on crime against convenience stores. However, because these only cover a small proportion of premises in the wholesale and retail sector it is hard to directly compare the findings with those from the CVS. The time periods covered also differ. The 2014 survey had 11 respondents representing 3,592 stores, and found that 76 per cent of retailers had experienced some form of theft in their store since 2012.
Further findings
Overall estimates for all of the CVS sectors combined, including for online crime, metal theft and reporting rates are available in Chapter 4.
2. Crime against accommodation and food premises
2.0 Introduction
In the 2014 Commercial Victimisation Survey (CVS), respondents from 1,052 premises in the accommodation and food sector were asked if they had experienced any of a range of crime types in the 12 months prior to interview and, if so, how many incidents of crime had been experienced.
The accommodation and food sector has now been included in the CVS for three years, and so we are able to compare figures over this period. Most of the comparisons presented in this chapter are of 2014 against 2012 findings, as the most prominent changes in crime against this sector occurred over the two-year period. The relatively small sample size of the survey makes detecting changes between adjacent years more difficult. More information will become available in future years as longer trends develop. Comparisons with 2012 and 2013 figures, with results of statistical significance testing and confidence intervals, are presented in the accompanying 2014 CVS Comparison Tables.
The 2014 CVS also collected information on areas such as online crime, organised crime, cost of crime, and reporting rates (to the police). This information is presented here, as well as information on repeat victimisation (average number of crimes per victim).
Results for all CVS sectors, including the accommodation and food sector are presented in the accompanying 2014 CVS Headline Tables.
Please refer to the introduction to this report for further information about the contents of data tables accompanying the publication.
2.1 Key findings
Crime against the accommodation and food sector fell between 2012 and 2014.
The number of victims of crime (individual premises) in this sector fell from 58,000 victims in 2012 to 45,000 in 2014. The number of incidents has also fallen from 985,000 to 565,000 over the same period, driven largely by falls in theft.
Since 2012, the proportion of premises experiencing crime has decreased across all offence groups.
Overall the proportion of premises that suffer a crime in this sector has fallen, even though for some offences the rate of incidents has increased (for example assaults and threats).
Assaults and threats were the most common crime type against this sector in 2014.
Overall, the 2014 CVS recorded 565,000 crimes against accommodation and food premises, of which 46 per cent (260,000 incidents) were assaults and threats. This is a similar proportion to the 2013 CVS.
Larger premises experienced higher rates of crime than smaller premises.
The rate of crime experienced by premises with 50 or more employees was 19,224 incidents per 1,000 premises compared with 2,146 per 1,000 premises with 1-9 employees, and 7,649 per 1,000 premises with 10-49 employees. The proportion of larger businesses experiencing crime was also much higher.
2.2 Extent of crime against accommodation and food premises
Table 2.1: Experiences of crime in the last 12 months, accommodation & food sector, 2014 CVS
| Crime type | Number of crimes (000s) | Number of crimes per 1,000 premises | Number of victims (000s of premises) | % of premises experiencing | Average number of crimes experienced by each victim (premises) |
|---|---|---|---|---|---|
| All burglary (inc. attempts) | 18 | 148 | 12 | 10 | 2 |
| Vandalism | 71 | 588 | 16 | 13 | 4 |
| All vehicle-related theft | 3 | 22 | 1 | 1 | 3 |
| All robbery (inc. attempts) | 2 | 19 | 1 | 1 | 2 |
| Assaults and threats | 260 | 2,158 | 14 | 12 | 18 |
| All theft | 168 | 1,389 | 16 | 13 | 10 |
| Thefts by customers | 111 | 922 | 9 | 7 | 13 |
| Thefts by employees | 23 | 188 | 4 | 3 | 6 |
| Thefts by others | 7 | 61 | 2 | 1 | 5 |
| Thefts by unknown persons | 26 | 218 | 5 | 5 | 5 |
| All fraud | 43 | 354 | 10 | 8 | 4 |
| All accommodation and food premises crime | 565 | 4,677 | 45 | 37 | 13 |
Unweighted base: 1,052 premises
Table 2.2: Changes in crime in the accommodation & food sector, 2014 compared with 2012 CVS
| Crime type | Change in number of crimes per 1,000 premises | Change in % of premises experiencing | Change in average number of crimes experienced by each victim (premises) |
|---|---|---|---|
| All burglary (inc. attempts) | -122 * | -5% * | -0.4 * |
| Vandalism | + 19 | -4% * | +1 |
| All vehicle-related theft | + 2 | -0.2% | - |
| All robbery (inc. attempts) | -104 | -1% | - |
| Assaults and threats | +85 | -3% * | +4 |
| All theft | -2,082 * | -3% * | -10 * |
| Thefts by customers | -269 | +1% | -5 |
| Thefts by employees | -1,185 * | -3% * | -18 * |
| Thefts by others | +26 | -0.3% | - |
| Thefts by unknown persons | -655 | -2% * | -8 |
| All fraud | -482 * | -2% | -4 * |
| All accommodation and food premises crime | -2,684 * | -6% * | -4 |
Table notes
- columns related to victims may not sum to the totals shown for all crime; this is because one premises can be a victim of more than one type of crime; other columns may not sum exactly to the total shown due to rounding
- the fall in the incidence rate for employee theft is particularly large; in 2013 there were 233 incidents per 1,000 premises, and in 2014 there were 188 incidents per 1,000 premises, indicating that the 2012 estimate was particularly large
- statistically significant changes are indicated with asterisks (*); other changes are not significant
- a hyphen (-) indicates that a figure is not shown because its unweighted base is fewer than 50 respondents
Source
Home Office, 2014 CVS Headline Tables and 2014 CVS Comparison Tables.
There were 565,000 crimes against accommodation and food premises in the year prior to interview, and 37 per cent of premises in the sector had experienced at least one incident of crime (of any type) within the last 12 months. Each victim in the accommodation and food sector had experienced an average of 13 incidents in the previous 12 months. These figures are presented in table 2.1.
Assaults and threats were the most common crime type, making up 46 per cent of all incidents against this sector (260,000 incidents). Twelve per cent of premises in this sector had experienced at least one such incident in the last year. Victims of assaults and threats experienced a relatively high level of repeat victimisation compared with victims of other crime types, with an average of 18 incidents per premises in the 12 months prior to interview. Differences are also apparent for other crime types, for example vandalism and theft have very similar prevalence levels, but theft has a much higher incidence rate, which suggests greater repeat victimisation.
The total estimated number of crimes against the accommodation and food sector fell from 985,000 in 2012 to 565,000 in 2014. The main driver of this was a fall in the number of incidents of theft, which fell from 465,000 in 2012 to 168,000 in 2014 (accounting for 71% of the overall fall). There were large falls in the number of thefts by employees (from 184,000 to 23,000) and thefts by unknown persons (from 117,000 to 26,000). The direction of change across each crime type is summarised in table 2.2, see the 2014 CVS Comparison Tables for a more detailed breakdown.
Number of incidents per 1,000 premises
The rate of crime against the accommodation and food sector fell by over a third, from 7,361 incidents per 1,000 premises to 4,677 per 1,000 premises between 2012 and 2014. In 2012, thefts were the most common crime type experienced by the accommodation and food sector (3,471 incidents per 1,000 premises). However, as in 2013, assaults and threats are now the most common crime type experienced by the sector (2,158 incidents per 1,000 premises in 2014). Changes over time are summarised in Figure 2.1 below.
Figure 2.1: Incidents of crime per 1,000 premises experienced by the accommodation and food sector in the last 12 months, with associated 95% confidence intervals, 2012, 2013 and 2014.
.
Chart notes
Error bars represent 95% confidence intervals. While non-overlapping confidence intervals usually indicate a statistically significant difference, overlapping confidence intervals do not always indicate a lack of statistical significance.
Source
Home Office, 2014 CVS Comparison Tables.
Proportions of premises that experienced a crime
After remaining steady between 2012 and 2013, the level of victimisation in the accommodation and food sector fell by 6 percentage points in 2014.
The change in the prevalence rate for specific crime types are shown in figure 2.2. Between 2013 and 2014 there has been a significant decline in the proportion of premises suffering assaults and threats while incidence rates have stayed fairly flat. This suggests that those that have suffered assaults and threats have been repeat victims in a number of cases. During this period the number of incidents per victim has increased from 13 to 18, but this was not statistically significant.
Figure 2.2: Proportion of premises experiencing incidents of crime in the accommodation and food sector in the last 12 months, with associated confidence intervals, 2012, 2013, and 2014.
.
Chart notes
Error bars represent 95% confidence intervals. While non-overlapping confidence intervals usually indicate a statistically significant difference, overlapping confidence intervals do not always indicate a lack of statistical significance.
Source
Home Office, 2014 CVS Comparison Tables.
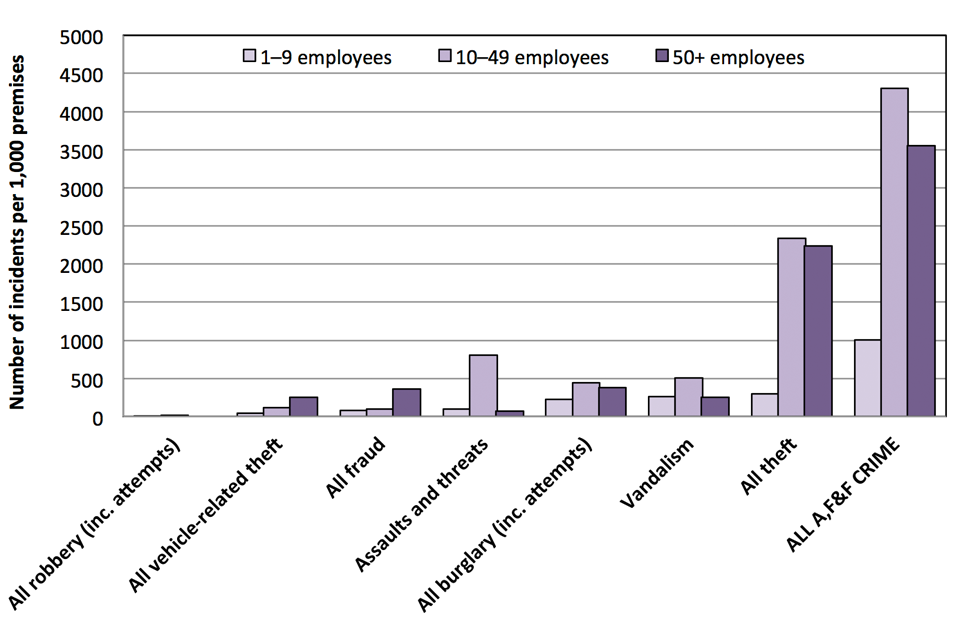
Incidence and prevalence rates by business size
As previously shown by the 2012 and 2013 CVS, incidence rates of crime (i.e. number of incidents per 1,000 premises) are noticeably higher for premises with more employees. During 2014, small, medium and large businesses experienced markedly different incidence and prevalence rates of crime. Premises with 50+ employees experienced approximately 8 times more incidents per 1,000 premises compared with the smallest premises (1 to 9 employees) (Table 2.3).
This difference in rate is largely driven by the main three crime types in this sector: (i) assaults and threats (ii) theft and (iii) fraud (Figure 2.3). Table 2.3 shows that the prevalence rate is higher for every crime type for premises with 50 or more employees compared with premises with 1-9 or 10-49 employees.
Table 2.3: Incidents of crime per 1,000 premises and proportion of premises experiencing at least 1 incident of crime, by premises size, accommodation and food sector, 2014 CVS.
| 1 to 9 employees | 10 to 49 employees | 50+ employees | ||||
|---|---|---|---|---|---|---|
| incidence (per 1,000) | prevalence (%) | incidence (per 1,000) | prevalence (%) | incidence (per 1,000) | prevalence (%) | |
| All burglary (inc. attempts) | 139 | 9 | 157 | 11 | 230 | 14 |
| Vandalism | 464 | 13 | 787 | 13 | 1,015 | 18 |
| All vehicle-related theft | 9 | 1 | 38 | 1 | 119 | 2 |
| All robbery (inc. attempts) | 10 | 0 | 34 | 2 | 38 | 2 |
| Assaults and threats | 805 | 8 | 4,018 | 18 | 10,012 | 28 |
| All theft | 750 | 11 | 2,299 | 17 | 4,776 | 30 |
| All fraud | 237 | 6 | 316 | 10 | 3,033 | 24 |
| All accommodation and food premises crime | 2,416 | 32 | 7,649 | 45 | 19,224 | 58 |
Unweighted base: 1,052 premises
Source
Home Office, 2014 CVS Headline Tables.
Figure 2.3: Incidents of crime per 1,000 premises experienced by the accommodation and food sector in the last 12 months, by number of employees at premises, 2014 CVS
.
Source: Home Office, 2014 CVS Comparison Tables.
Average number of incidents of crime per victim (premises)
Overall, each victim of crime in the accommodation and food sector experienced an average of 13 incidents in the last year. The highest average numbers of incidents per victim were for assaults and threats, with each victim experiencing an average of 18 incidents of this crime type in the last year. Theft by customers has the next highest rate of repeat victimisation, at 13 incidents per victim.
The level of repeat victimisation for theft by employees have decreased significantly, driving an overall significant decrease in the level of repeat victimisation for theft overall. There has also been a significant decrease in repeat victimisation for fraud offences.
2.3 Other results from the survey
This section includes findings about online crime, reporting rates (to the police) and organised crime in the accommodation and food sector.
Online crime
Online crime covers a range of crime types carried out over computer networks. Respondents from this sector, who used computers at their premises, were asked about their experience of various types of online crime. See the Technical Annex for the types covered in the survey and for further details of online crime. It is important to bear in mind that respondents were only asked about online crimes affecting the premises. Many online crimes may affect only head offices and so will not be picked up by the survey.
Half of the respondents from the accommodation and food sector were asked whether computers were used at the premises. Those who used computers were then asked about their business’s experience of online crime. In the accommodation and food sector 68 per cent of businesses said they used computers, compared with 84 per cent across all the six sectors for which data are available. Computer use is probably lower in this sector because of the types of businesses it encompasses are far less likely to have computers.
Table 2.5: Experiences of online crime in the last 12 months, accommodation & food sector, 2014 CVS
| Crime type | Number of crimes (000s) | Number crimes per 1,000 premises | Number of victims (000s of premises) | % of premises experiencing |
|---|---|---|---|---|
| Hacking | 4 | 32 | 2 | 2 |
| Phishing | 0 | 2 | 0 | 0 |
| Theft of money (online) | 1 | 8 | 0 | 0 |
| Theft of information (online) | 1 | 9 | 1 | 1 |
| Website vandalism | 0 | 1 | 0 | 0 |
| Computer virus | 12 | 103 | 6 | 5 |
| All online crime | 19 | 155 | 8 | 7 |
Unweighted base: 488 premises.
Table notes
- columns related to victims may not sum to the totals shown for all online crime; this is because one premises can be a victim of more than one type of crime; other columns may not sum exactly to the total shown due to rounding
- since computers are used at a high proportion of premises, incidence and prevalence rates are reported relative to the total number of business premises in the sector, not only those where computers are used
- incidents of online crime are not included in the overall count of CVS crime as these questions are only asked of half the sample and there is a risk of double-counting with other crime types, such as theft or fraud
- although described here as crimes, it is worth noting that not all of these incidents would be recorded as a crime by the police; whether receiving a phishing email or being infected by virus is counted under police recorded crime depends on whether the incident was targeted at a specific victim, or any financial loss was incurred, as per the Home Office Counting Rules.
Source: Home Office, 2014 CVS Headline Tables.
The 2014 CVS estimates there were 19,000 incidents of online crime against businesses in the accommodation and food sector in the 12 months prior to interview, an increase compared with 2013 (13,000 incidents), and compared with 2012 (16,000 incidents). Neither change is statistically significant.
The most commonly experienced online crimes in each of the last three years were computer viruses. In 2014 there were 12,000 incidents in the year prior to interview, making up 66 per cent of all incidents of online crime against this sector. In 2013 computer viruses made up 64 per cent of all online crimes in this sector, and in 2012 this proportion was 50 per cent.
Reporting rates
The CVS asked those respondents who had experienced crime in the past year whether the police came to know about the most recent incident of each crime type experienced.
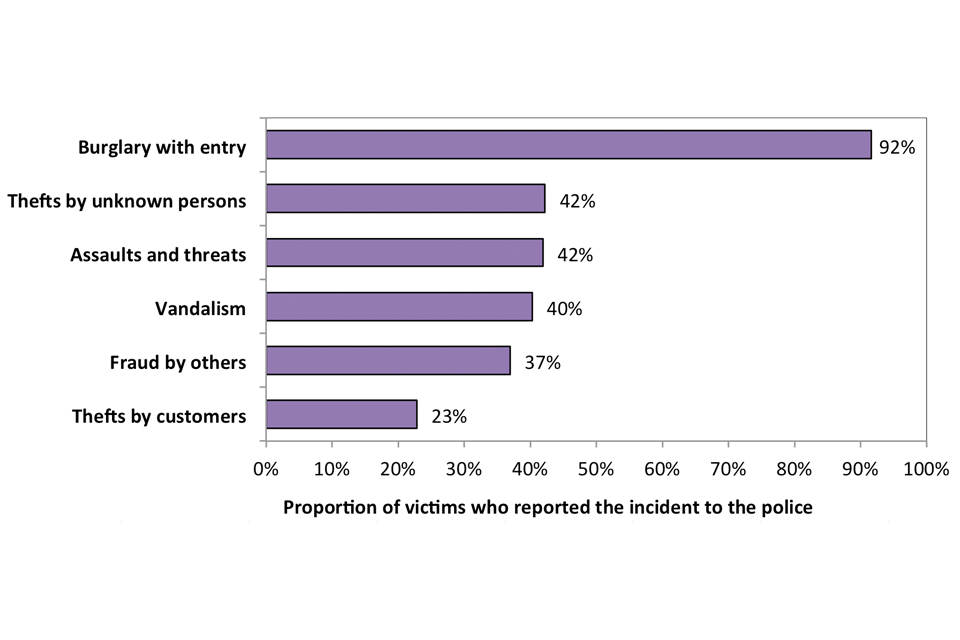
Where sample sizes were large enough to look at reporting rates for the accommodation and food sector, the CVS showed that reporting rates varied considerably by the type of offence (Figure 2.4). Estimates show that incidents of burglary with entry were well reported, with 92 per cent of incidents of incidents being reported to police for this sector.
Reporting rates were low for thefts by customers, where only 23 per cent were reported to the police.
There has been a significant fall in the number of incidents of thefts by customers reported to the police between 2012 and 2014, in contrast to the wholesale and retail sector where the reporting rate has remained steady.
The figures suggest that the reporting rate is highest for crimes where the largest financial losses were incurred, and a crime reference number was needed for insurance purposes. For example, the 2013 CVS found burglary with entry to be one of the costliest crimes in terms of the median value of goods stolen per incident, and figure 2.4 shows that this crime type has the highest reporting rate.
Figure 2.4: Proportion of incidents experienced by premises in the accommodation and food sector reported to the police (%), for selected crime types, 2014 CVS.
.
Chart notes
- results are not shown where the unweighted base was fewer than 50
- it is not possible to show percentages for combined crime groups (e.g. all burglary) as the questions on reporting are asked regarding the most recent incident experienced in the last 12 months, which cannot be identified for groups
- fraud offences may have been reported to Action Fraud, the central recording body for all fraud offences, not the police
Source
Home Office, 2014 CVS Headline Tables.
Organised Crime
Organised crime is defined as a crime that involves individuals, normally working with others, committing serious crime on a continuing basis. Focusing on the most recent incident of each crime type experienced in the 12 months prior to interview, respondents in the accommodation and food sector were asked whether they perceived it to have been carried out by “an organised group of criminals”, a “loosely knit group”, or “someone working alone”.
In 2014 the crimes most commonly perceived as organised were burglary with entry, and fraud by others, with 20% of respondents saying that they thought the last incidents they had experienced of burglary with entry, or fraud by others, had been carried out by an organised group of criminals. The most common crime type in this sector (assaults and threats) was seldom (2%) perceived to be organised.
Chapter 4 explores the reasons respondents gave for thinking that a crime was carried out by an organised group of criminals. Figures on the proportion of incidents respondents thought were carried out by an organised group of criminals, by industry sector, can be found in Table OC2 in the 2014 CVS Headline Tables. Figure 2.5 below summarises the proportion of each crime type thought to be carried out by an organised group for the accommodation and food sector. Not all crime types are shown, as the number of respondents did not allow for robust estimates in all cases.
Figure 2.5: The proportion of victims for each crime type who thought the crime they experienced involved an organised group of criminals.
.
Source: Home Office, 2014 CVS Headline Tables.
Further findings
Overall estimates for all of the CVS sectors combined, including for online crime, organised crime, and reporting rates are available in Chapter 4.
3. Crime against agriculture, forestry and fishing premises
3.0 Introduction
Respondents to the 2014 Commercial Victimisation Survey (CVS) from premises in the agriculture, forestry and fishing sector were asked if the business at their current premises had experienced any of a range of crime types in the 12 months prior to interview and, if so, how many incidents of crime had been experienced. In addition, the 2014 CVS also collected information on other crime types, such as livestock and chemical theft, organised crime and reporting rates. These, alongside comparisons to 2013 figures, are presented here and in the 2014 CVS Comparison Tables. This sector was not included in the 2012 survey; premises from the agriculture, forestry and fishing sector were covered by the Commercial Victimisation Survey (CVS) for the first time in 2013.
The estimates presented in this chapter are based on interviews with respondents at 1,019 agriculture, forestry and fishing sector premises. Data are weighted to ensure that the sample is representative of businesses in this sector in England and Wales as a whole.
The majority of premises interviewed from the agriculture, forestry and fishing sector describe farming as the main activity at the premises. Of the 843 farming premises, around half farmed animals, a quarter were crop farmers and a further quarter farmed both animals and crops. This is very similar to the sample from this sector interviewed for the 2013 CVS.
Results for all CVS sectors, including the agriculture, forestry and fishing sector are presented in the 2014 CVS Headline Tables.
Please refer to the introduction to this report for further information about the contents of data tables accompanying the publication.
3.1 Key findings
Of all sectors surveyed by the CVS, the agriculture sector experienced the least crime.
There were around 95,000 crimes affecting around 26 per cent of agriculture, forestry and fishing premises in 2014. Both figures have fallen slightly compared with 2013 (but this is not statistically significant), and remain the lowest incidence and prevalence rates among all six sectors surveyed in 2012-2014.
The number of burglaries per 1,000 premises in the agriculture sector fell by over a third.
Compared with 2013, the number of incidents of burglary with entry per 1,000 premises in the agriculture, forestry and fishing sector fell from 206 to 132.
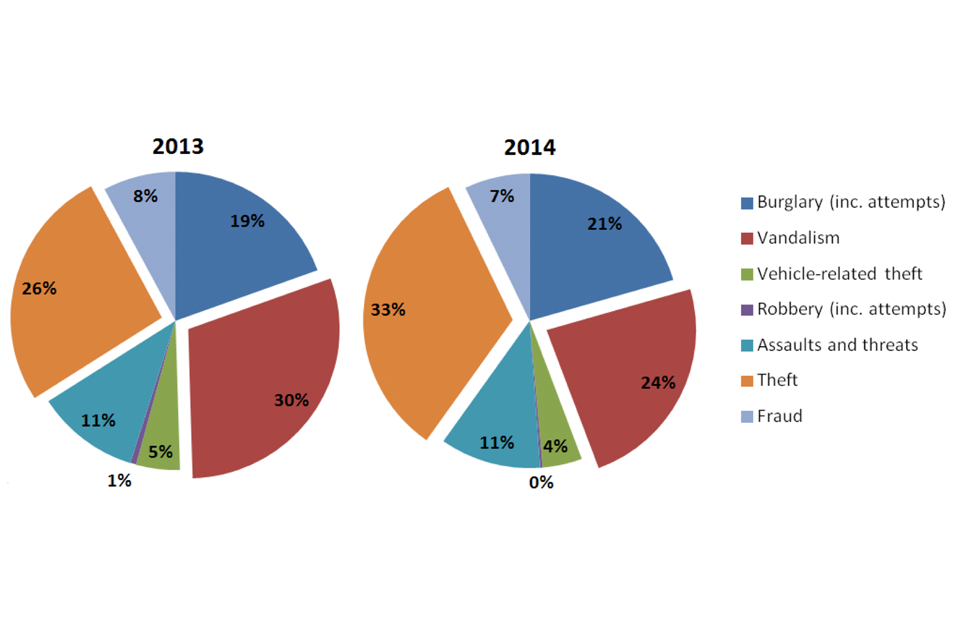
Theft and vandalism were the most common crime types experienced in this sector.
Theft made up 33 per cent of incidents, while vandalism made up around a quarter (24%) of all incidents against agriculture, forestry and fishing premises in 2014.
3.2 Extent of crime against agriculture, forestry and fishing premises
Table 3.1: Experiences of crime in the last 12 months, agriculture, forestry & fishing sector, 2014 CVS
| Crime type | Number of crimes (000s) | Number of crimes per 1,000 premises | Number of victims (000s of premises) | % of premises experiencing | Average number of crimes experienced by each victim (premises) |
|---|---|---|---|---|---|
| All burglary (inc. attempts) | 19 | 232 | 9 | 11 | 2 |
| Vandalism | 23 | 269 | 7 | 8 | 3 |
| All vehicle-related theft | 4 | 48 | 3 | 4 | 1 |
| All robbery (inc. attempts) | 0 | 3 | 0 | 0 | 1 |
| Assaults and threats | 10 | 123 | 3 | 3 | 4 |
| All theft | 31 | 375 | 7 | 8 | 5 |
| All fraud | 7 | 80 | 2 | 3 | 3 |
| All agriculture, forestry and fishing premises crime | 95 | 1,131 | 22 | 26 | 4 |
Unweighted base: 1,019 premises
Table 3.2: Changes in crime in the agriculture, forestry & fishing sector, 2014 compared with 2013 CVS
| Crime type | Change in number of crimes per 1,000 premises | Change in % of premises experiencing | Change in average number of crimes experienced by each victim (premises) |
|---|---|---|---|
| All burglary (inc. attempts) | -55 | -4 * | +0.2 |
| Vandalism | -174 | -2 | -1 |
| All vehicle-related theft | -20 | -1 | -0.09 |
| All robbery (inc. attempts) | -6 | -0.1 | - |
| Assaults and threats | -40 | -1 | - |
| All theft | -13 | -1 | 1 |
| All fraud | -35 | -1 | - |
| All agriculture, forestry and fishing premises crime | -345 | -4 | -1 |
Table notes
- columns related to victims may not sum to the totals shown for all crime; this is because one premises can be a victim of more than one type of crime; other columns may not sum exactly to the total shown due to rounding
- statistically significant changes are indicated with asterisks (*); other changes are not significant
- a hyphen (-) indicates that a figure is not shown because its unweighted base is fewer than 50 respondents
Source
Home Office, 2014 CVS Headline Tables and 2014 CVS Comparison Tables.
Agriculture, forestry and fishing premises experienced 95,000 crimes in the year prior to interview. This fall compared with 2013 (when the CVS estimated 133,000 crimes) is not statistically significant.
Compared with 2013, the proportions of incidents attributed to each crime type have remained similar, with prominent differences only for the two most common crime types for this sector: (i) theft and (ii) vandalism.
Figure 3.1: Proportions of incidents of crime attributed to each crime type, agriculture, forestry and fishing sector, 2013 and 2014 CVS
.
Source: Home Office, 2014 CVS Headline Tables.
Number of incidents per 1,000 premises
As discussed in chapter 4, the agriculture, forestry and fishing sector experienced relatively low rates of crime compared with the other sectors surveyed in 2014. Table 3.1 shows that the highest rates of crime against this sector were for thefts (375 incidents per 1,000 premises), followed by vandalism (269 incidents per 1,000 premises), burglary (232 incidents per 1,000 premises) and assaults and threats (123 incidents per 1,000 premises).
Figure 3.2: Incidents of crime per 1,000 premises experienced by agriculture, forestry and fishing premises in the last 12 months, with 95% confidence intervals, 2013 and 2014 CVS

.
Chart notes
Error bars represent 95% confidence intervals. While non-overlapping confidence intervals usually indicate a statistically significant difference, overlapping confidence intervals do not always indicate a lack of statistical significance.
Source
Home Office, 2014 CVS Comparison Tables.
Compared with 2013, within the main crime types there has been a statistically significant fall in the incidence rate of burglary with entry, down from 206 to 132 incidents per 1,000 premises. There was also a notable fall in the number of incidents of vandalism (down by 174, from 443 in 2013), but this is not statistically significant. Other changes in incidence rates can be found in the 2014 CVS Comparison Tables and are illustrated by Figure 3.2.
As shown in Figure 3.3 below, the highest rates of crime at agriculture, forestry and fishing premises were among those with 10-49 employees, which are similar to those for premises with 50 or more employees. This differs from the other sectors, where larger businesses appear to experience higher crime rates.
Figure 3.3: Number of incidents of crime per 1,000 premises experienced by the agriculture, forestry and fishing sector in the last 12 months, by number of employees at premises, 2014 CVS
.
Source: Home Office, 2014 CVS Headline Tables.
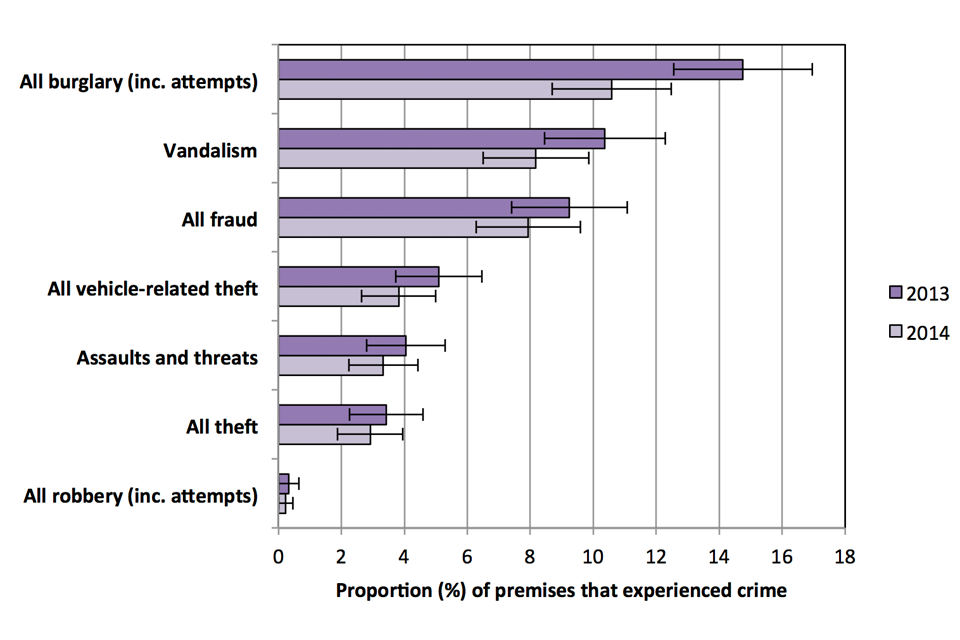
Proportions of premises that experienced a crime
Just over a quarter (26%) of agriculture, forestry and fishing premises experienced at least one incident of crime in the 12 months prior to interview. This is the lowest prevalence rate among the six sectors surveyed in 2012, 2013 and 2014. The most prevalent crime type in the agriculture, forestry and fishing sector in 2014 was burglary, which 11 per cent of premises experienced.
The 2013 CVS found that, in contrast to other sectors, where the majority of premises have alarms installed, only a third (32%) of agriculture, forestry and fishing premises had one. However, the 2013 survey results also indicated that the presence of a burglar alarm does not fully offset the risk of victimisation in high-risk and accessible locations. This shows some similarities with a finding by Tilley et al (2015), whereby alarms were actually associated with increased risk of burglary in households.
Two per cent of premises experienced theft of a vehicle (with no change compared with 2013). According to findings from the Crime Survey for England and Wales (CSEW), this proportion is higher than the proportion of vehicle theft incidents experienced by households. The CSEW estimated that 0.2 per cent of households experienced theft of a vehicle in the year to December 2014. Figures for overall vehicle-related theft, which includes both theft of a vehicle and theft from vehicles, were similar for businesses in the agriculture sector and vehicle-owning households (both around 3%). This may suggest that in vehicle-related theft against this sector, the vehicle itself is more frequently a target, most likely due to higher value compared with household vehicles. The NFU Rural Crime Survey 2014 revealed that the cost of rural theft has been driven up by thefts of high-value tractors worth up to £80,000, while thieves are also targeting lower value tractors not fitted with high-tech systems. Conversely, in household vehicles, the contents may be more frequently targeted.
Compared with 2013 there were small (but statistically significant) falls in the proportions of premises that experienced burglary (-4%) and thefts by employees (-1%). There were no increases in prevalence rates for any crime types. The changes are shown below in Figure 3.4.
Figure 3.4: Proportion of agriculture, forestry and fishing premises that experienced crime in the last 12 months, by type, with 95% confidence intervals, 2013 and 2014 CVS
.
Chart notes
Error bars represent 95% confidence intervals. While non-overlapping confidence intervals usually indicate a statistically significant difference, overlapping confidence intervals do not always indicate a lack of statistical significance.
Source
Home Office, 2014 CVS Comparison Tables.
As Figure 3.5 shows, the proportion of agriculture, forestry and fishing premises that experienced crime in the last 12 months increases with the number of employees at the premises, for overall crime against this sector; however, this pattern is not consistently seen among individual crime types. The breakdown of the overall prevalence rate by business size complements the findings on incidence rates shown in Figure 3.3, suggesting that in 2014 those premises with 10-49 employees that experienced crime, experienced higher crime rates on average. A visual comparison of figures 3.3 and 3.5 shows that this is likely to be due to the high rate of theft from medium-sized businesses, compared with a relatively low prevalence rate. Please note that the crime types in figures 3.3 and 3.5 are ordered in increasing order of overall incidence and prevalence rates, respectively, so the crime types appear in different places on each chart.
Figure 3.5: Proportion of agriculture, forestry and fishing premises that experienced crime in the last 12 months, by number of employees at premises, 2014 CVS
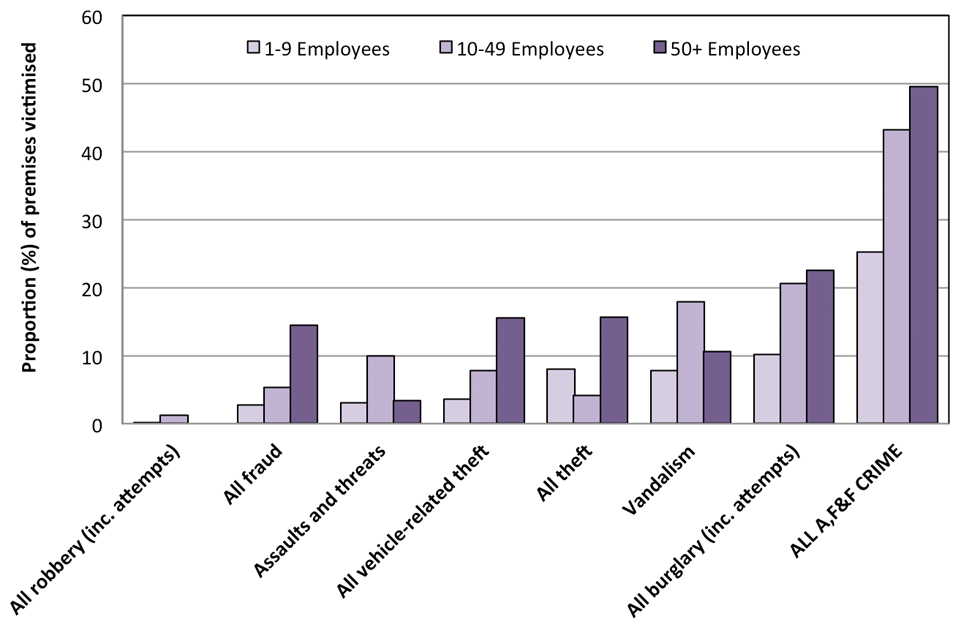
.
Source: Home Office, 2014 CVS Headline Tables.
Average number of incidents of crime per victim (premises)
Overall, each victim of crime in the agriculture, forestry and fishing sector experienced an average of 4 incidents in the last year. This is the lowest repeat prevalence rate across the six sectors surveyed in 2012, 2013 and 2014, and is another indicator that crime is generally low in this sector.
3.3 Other results from the survey
This section includes findings on reporting rates and organised crime in the agriculture, forestry and fishing sector, as well as metal, fuel, chemical and livestock theft from premises in this sector.
Reporting rates
The 2014 CVS asked those respondents who had experienced crime in the past year whether they reported the most recent incident of each crime type experienced to the police. Because of the low levels of crime in this sector, there are only a handful of crime types that are common enough to establish the extent to which they were reported to the police. These were burglary with entry (for which 68% of incidents were reported to the police), vandalism (41% reported) and theft by unknown persons (37% reported). Figures on the proportion of incidents reported to the police can be found in Table RR1 in the 2014 CVS Headline Tables and in Table RR5 in the 2014 CVS Comparison Tables.
Organised crime
Organised crime is defined as crime that involves individuals, normally working with others, committing serious crime on a continuing basis. Focusing on the most recent incident of each crime type experienced in the 12 months prior to interview, respondents in the agriculture, forestry and fishing sector were asked whether they perceived it to have been carried out by ‘an organised group of criminals’, a ‘loosely knit group’, or ‘someone working alone’.
Again, because of the low levels of crime in this sector, there are only a few crime types for which the incidence of perceived organised crime can be estimated. Burglary with entry was more likely to be perceived as organised crime (25% of incidents), while vandalism was generally not perceived to be organised (6% of incidents). Figures on the proportion of incidents respondents thought were carried out by an organised group of criminals, by industry sector, can be found in Table OC2 in the 2014 CVS Headline Tables and in Table OC5 in the 2014 CVS Comparison Tables. Reasons for crimes being perceived as organised are explored in Chapter 4.
Metal, fuel, livestock and chemical theft
CVS respondents in the agriculture, forestry and fishing sector were asked whether any metal, fuel, livestock or chemicals had been stolen from the premises in the 12 months prior to interview. Chemical theft could include theft of fertilisers, or other chemicals used to treat crops or livestock, that are kept on the premises. Table 3.3 below shows that the proportions of premises in this sector that had experienced these types of theft in 2014 were low, and down compared with 2013. The only statistically significant change was a decrease by 3% in the proportion of premises experiencing metal theft. This was consistent with findings published in Focus on Property Crime 2013 to 2014, which reported that there were 40,680 metal theft offences recorded by police in England and Wales in 2013/14, a decrease of around a third compared with 2012 to 2013.
Table 3.3: Proportion of agriculture, forestry and fishing premises that experienced metal, livestock, chemical or fuel theft in the last 12 months, 2013 and 2014 CVS
| Crime type | 2013 | 2014 | Change (2013 to 2014) |
|---|---|---|---|
| Metal theft | 10 | 6 | -3 * |
| Fuel theft | 7 | 5 | -2 |
| Livestock theft | 4 | 2 | -2 |
| Chemical theft | 0.4 | 0.4 | +0.004 |
| Unweighted base | 1,085 | 1,019 |
Table notes
- statistically significant changes are indicated with asterisks (*); other changes are not significant
- the figures presented on livestock theft have an unweighted base of 651 respondents in 2013 and 631 in 2014; these were the numbers of respondents in the agriculture, forestry and fishing sector that reported having livestock on their premises in the 2013 and 2014 CVS.
Source
Home Office, 2014 CVS Comparison Tables.
Findings from NFU Mutual’s Rural Crime Survey
The National Farmers’ Union (NFU) Mutual analysed data collected in their survey of claims experiences, combined with claims data, in order to produce their annual Rural Crime Survey findings.
The latest findings for 2014 focus on events that took place in 2013 and showed that theft of livestock, and opportunist theft of garden tools and ornaments, have risen compared with findings from the 2013 survey, while fuel, tools and quad bikes remained the most commonly targeted items. NFU Mutual provides insurance to 73% of the rural market. The NFU Mutual 2014 Rural Crime Survey was conducted in July 2014 and collected responses from 216 NFU Mutual agencies, regarding their claims experience.
Further findings
Analysis for all CVS sectors combined, including for organised crime and reporting rates, are available in Chapter 4. As the agriculture, forestry and fishing sector was only introduced to the CVS in 2013, it is not possible to comment on the time series from 2012 to 2014, as for the other two sectors in this report.
4. Crime against business premises across all sectors 2012, 2013 and 2014 CVS
4.0 Introduction
This section covers some of the key findings across the six sectors covered in the three CVS surveys (2012, 2013, 2014) that have taken place so far. The three sectors surveyed in 2014 have been combined with the three surveyed in previous years. Table 4.1 summarises the sectors that have been included in each year of the CVS.
Table 4.1: Sector coverage of the CVS, 2012 to 2014
| 2012 | 2013 | 2014 | |
|---|---|---|---|
| Wholesale and Retail | Yes | Yes | Yes |
| Accommodation and food | Yes | Yes | Yes |
| Agriculture, Forestry and Fishing | Yes | Yes | |
| Arts, Entertainment and Recreation | Yes | ||
| Transportation and Storage | Yes | ||
| Manufacturing | Yes |
Table note: The sample size was doubled for the wholesale and retail sector in 2014.
Combining the results from the different years gives as broad a picture of crimes against business premises in England and Wales as is currently possible using the CVS. However, it is important to remember that the six sectors involved only represent a subset (two fifths) of business premises in England and Wales [footnote 3]. It is also important to note when comparing sectors that the results for sectors are taken from different survey years, depending on when the sector was last included. This could influence comparisons, as sectors that were only included in previous years may have experienced changes in levels of crime since then.
More information about the sectors included in the 2013 and 2012 CVS can be found in the relevant releases.
Results for all CVS sectors are presented in the accompanying 2014 CVS Headline Tables. Tables T1 to T4 show crime across all six sectors surveyed, including:
- the total number of incidents of crime (incidence, or crime count)
- the number of incidents of crime per 1,000 premises (incidence rate, or crime rate)
- the total number of victims of crime (prevalence, or victim count)
- the proportion of premises that experienced crime (prevalence rate, or victimisation rate)
4.1 Key findings
There was a fall in crime against business premises between 2013 and 2014, both in terms of the crime rate and the proportion of premises affected.
Across the three sectors included in the 2013 and 2014 surveys, crime fell between the two years. This is consistent with the Crime Survey for England and Wales, which also showed a fall in crime over the same period.
Just under 40 per cent of premises across the six CVS sectors experienced crime in the last year.
Combined estimates from the 2012 to 2014 CVS show that there were 5.5 million crimes against premises in the six industry sectors included, with 37 per cent of premises experiencing crime.
Wholesale and retail premises experienced the highest levels of crime.
This sector experienced just over 13,000 crimes per 1,000 premises, with the next highest sector experiencing just under 6,000. Agriculture, forestry and fishing premises experienced the lowest levels of crime, with just over 1,100 incidents per 1,000 premises.
The proportion of premises affected by crime was fairly similar across several sectors.
The arts, entertainment recreation sector (2013) had the highest proportion of premises experiencing crime (45%), closely followed by wholesale and retail and transportation and storage sectors. Agriculture, forestry and fishing premises were least likely to experience crime (26%).
4.2 Overall extent of crime
The estimates presented here are based on interviews with respondents across the three survey years. Data are weighted to ensure that the sample is representative of premises in the six sectors covered by the CVS in England and Wales as a whole.
Combined estimates from the three years show that there were 5.5 million crimes against premises in the 6 industry sectors covered by the surveys (Table 4.2). This is lower than the 7.3 million incidents estimated from the combined 2012 and 2013 surveys, which were based on the same six sectors. These figures should not be taken to represent the scale of business crime as a whole, because as mentioned the six sectors only account for around 40 per cent of all businesses in England and Wales.
Table 4.2: Experiences of crime in the last 12 months, by sector, 2012, 2013 and 2014 CVS
| Sector | Number of crimes (000s) | Number of crimes per 1,000 premises | Number of victims (000s of premises) | % of premises experiencing | Average number of crimes per victim (premises) | Unweighted base | |
|---|---|---|---|---|---|---|---|
| 2014 | Wholesale &retail | 4,123 | 13,070 | 128 | 41 | 32 | 2,109 |
| 2014 | Accommodation & food | 565 | 4,677 | 45 | 37 | 13 | 1,052 |
| 2014 | Agriculture, forestry & fishing | 95 | 1,131 | 22 | 26 | 4 | 1,019 |
| 2013 | Arts, entertainment & recreation | 196 | 4,660 | 19 | 45 | 10 | 888 |
| 2012 | Manufacturing | 164 | 1,500 | 33 | 30 | 5 | 962 |
| 2012 | Transportation and storage | 324 | 5,824 | 22 | 40 | 15 | 879 |
| 2012 | All 6 CVS sectors | 5,467 | 7,519 | 269 | 37 | 20 | 6,909 |
Table notes
Columns related to victims may not sum to the totals shown for all crime. This is because one premises can be a victim of more than one type of crime. Other columns may not sum exactly to the total shown due to rounding.
Source
Home Office, 2014 CVS Headline Tables.
Thirty-seven per cent of premises, in the six sectors covered by the three surveys, had experienced at least one of the main crime types covered by the survey in the 12 months prior to interview. The proportion of business premises experiencing crime in the last year is more than double the proportion of households experiencing crime, with figures published by the Office for National Statistics (ONS) showing that 12 per cent of households experienced at least one crime in the year to December 2014.
Thefts were by far the most common type of crime experienced (3.7 million incidents), making up around two thirds (67%) of all incidents of crime against the 6 sectors. Theft was experienced by around one in five premises (18%).
Cross sector comparisons of crime
The wholesale and retail sector is, by far, the largest of the six sectors covered by the survey in terms of the number of premises in England and Wales, accounting for 43 per cent of all premises across the six sectors, and just under 20 per cent of all premises in England and Wales. As a result of this and the relatively high crime and prevalence rates in this sector, the overall distribution of crime is heavily influenced by patterns of crime against this sector. The 4.1 million crimes experienced by the wholesale and retail sector (in 2014) represent 75 per cent of all crimes against the 6 sectors (figure 4.1).
Figure 4.1: Proportion of incidents of all CVS crime by industry sector, 2012, 2013 and 2014 CVS
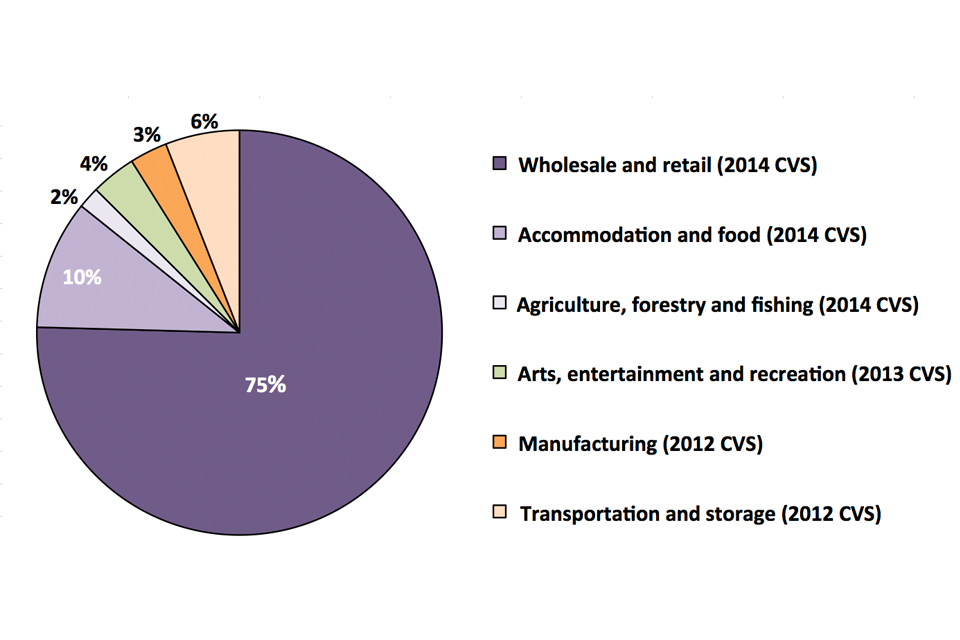
.
Chart notes
This only covers the six sectors that have been included in the 2012 to 2014 CVS surveys. These account for around 40 per cent of business premises in England and Wales.
Source
Home Office, 2014 CVS Headline Tables.
Of the 6 sectors, the agriculture, forestry and fishing sector experienced the lowest rate of overall crime (1,131 incidents per 1,000 premises in 2014), followed by the manufacturing sector (1,500 incidents per 1,000 premises in 2012). Wholesale and retail premises experienced the highest rate of overall crime (13,070 incidents per 1,000 premises in 2014).
When comparing between sectors it is important to bear in mind the different years that results are taken from. For example, in the wholesale and retail sector the rate of crime has fallen substantially from 19,701 incidents per 1,000 premises in 2012 to 13,070 incidents per 1,000 premises in 2014. Given that we have not surveyed sectors such as manufacturing since 2012, it is possible that they may also have experienced changes in the level of crime during this period. As a result, comparing results from different sectors from different years should be done with some caution.
The high rate of crime experienced by the wholesale and retail sector was driven mainly by a very high rate of thefts (10,319 per 1,000 premises). Discounting thefts from all sectors, the rate of crime in this sector was actually lower than the accommodation and food, arts, entertainment and recreation and transportation and storage sectors (Figure 4.2). The same figure shows that overall crime for the agriculture, forestry and fishing and manufacturing sectors was lower than the other sectors.
Figure 4.2: Number of crimes per 1,000 premises experienced in the 12 months prior to interview (excluding theft), by sector, 2012, 2013, 2014 CVS
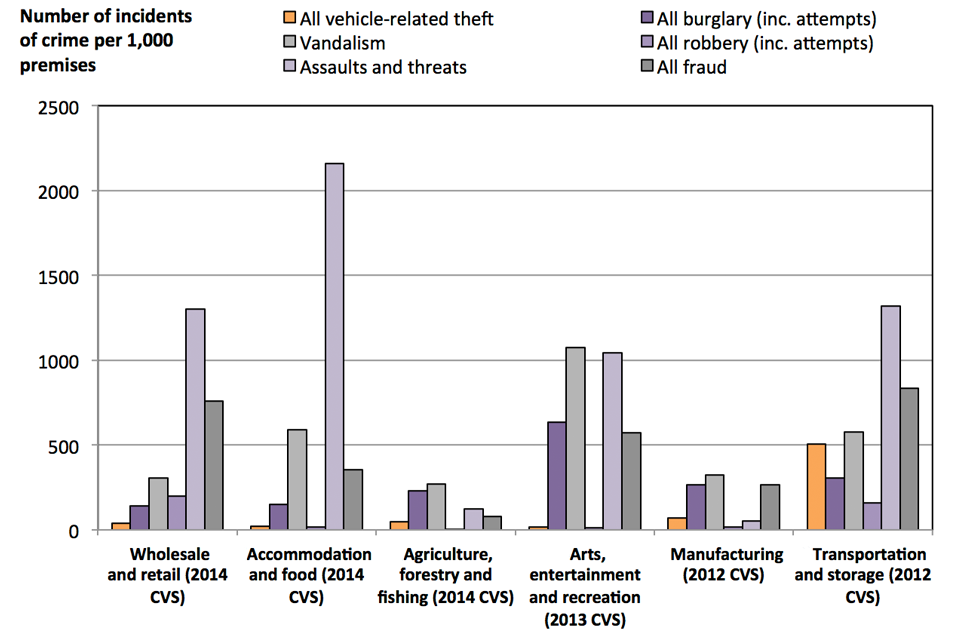
.
Figure 4.3: Proportion of premises experiencing crimes in the 12 months prior to interview, by sector, 2012, 2013, 2014 CVS
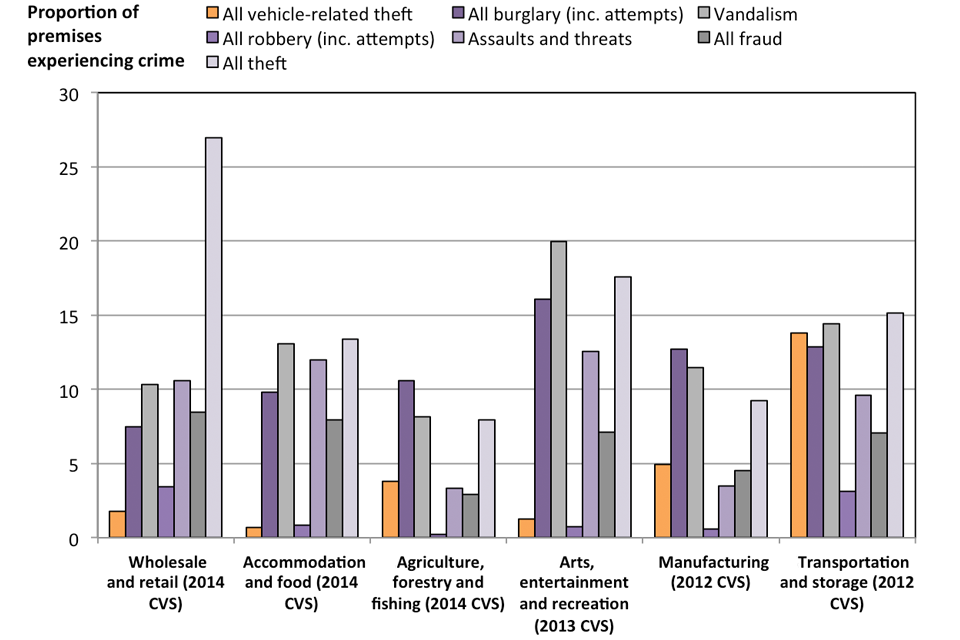
.
Source: Home Office, 2014 CVS Headline Tables.
Figures 4.2 and 4.3 show how the frequency and prevalence of different crime types varies by sector. For example, while the rates of vandalism and burglary were highest in the arts, entertainment and recreation sector, assaults and threats were most common in the accommodation and food sector. Unsurprisingly, vehicle theft was most common in the transportation and storage sector. Overall, victimisation was most widespread in the arts, entertainment and recreation sector (45% of premises had experienced crime) and least widespread in the agriculture, forestry and fishing sector (26%).
Comparison with last year’s survey
Because the 2013 and 2014 surveys both included the wholesale and retail, accommodation and food, and agriculture, forestry and fishing sectors, it is possible to draw some comparisons between the total levels of crime across these three sectors between the two years. As table 4.3 shows, both the rate at which crimes were experienced and the proportion of premises experiencing crimes across the three sectors fell between the two years. The wholesale and retail sector is a key driver of the overall trends, given the large numbers of premises in this sector and the high crime rate. This sector drove the fall in the rate of crimes experienced, while all three sectors saw similar falls in the proportion of premises experiencing crimes.
Table 4.3: Experiences of crime in comparable sectors, by survey year, 2013 and 2014 CVS
| Sector | Incidents of crime per 1,000 premises | Proportion of premises that experienced crime (%) | Unweighted base | |||
|---|---|---|---|---|---|---|
| 2013 | 2014 | 2013 | 2014 | 2013 | 2014 | |
| Wholesale and retail | 17,261 | 13,070 | 45 | 41 | 935 | 2,109 |
| Accommodation and food | 4,565 | 4,677 | 42 | 37 | 1,133 | 1,052 |
| Agriculture, forestry and fishing | 1,475 | 1,131 | 30 | 26 | 1,085 | 1,019 |
| All 3 sectors combined | 11,857 | 9,198 | 42 | 37 | 3,153 | 4,180 |
Source
Home Office, 2014 CVS Headline Tables.
Comparisons with police recorded crime data
The CVS is one of a number of sources of data on business crime, and so it is important to put the CVS results in context by comparing the findings with other sources of data. In particular, it is useful to compare the survey findings against police recorded crime (PRC) data for various crime types. Table 4.4 shows some of the crime types that can be compared between police recorded crime and the CVS, and the recent trends in these crime types in the two sources. However, when interpreting this table it is important to bear in mind that police recorded crime statistics do not currently meet the required standard for designation as National Statistics. As a result, some caution should be exercised when comparing with these data. More details on the re-designation of police recorded crime statistics can be found on the crime statistics area of the ONS website.
Table 4.4: Changes in crime types according to the CVS and Police Recorded Crime, 2014 CVS compared with 2012 CVS
| CVS (2012 survey vs. 2014 survey) | Police recorded crime (2012 calendar year vs. 2014 calendar year) |
|---|---|
| Theft by customers down in the wholesale and retail sector. | Shoplifting up 9%. |
| Burglary down for wholesale and retail and accommodation and food. | Non-domestic burglary down 8%. |
| Theft by employees down for accommodation and food sector, and down for wholesale and retail sector but not statistically significant. | Theft by an employee up 1%. |
| Robbery down but not statistically significant. | Robbery of business property down 8%. |
Table note: all changes stated for the CVS are statistically significant unless otherwise stated.
As table 4.4 shows, there are some areas in which the CVS and police recorded crime data show similar trends. For example, both sources show a fall in burglaries, and the CVS also indicates a downward trend in robbery (although not statistically significant), as suggested by the police recorded crime data. There are, however, other areas where the two sources differ. This is particularly true of shoplifting, where police recorded crime shows a clear upward trend between 2012 and 2014, while the CVS shows a significant fall during this period in the wholesale and retail sector. The reasons for this are discussed in more detail in chapter 1.
4.3 Other results from the survey
This section presents cross-sector findings about online crime, organised crime and reporting rates (to the police).
Online crime
Online crime covers a range of crime types carried out over computer networks. The CVS asks respondents who used computers at their premises about their experience of the following types of online crime:
- hacking: having a computer system accessed without permission
- online theft of money: having money stolen electronically (for example, through online banking)
- phishing: having money stolen after responding to fraudulent messages or being redirected to fake websites
- online theft of information: having confidential information stolen electronically (such as staff or customer data)
- website vandalism: having a website defaced, damaged or taken down
- viruses: having computers infected with files or programmes intended to cause harm
The online crime questions were not asked of agriculture, forestry and fishing premises as these were found to have a low proportion of computer use during the piloting stage. Therefore, the online crime results only cover five of the six CVS sectors. Also, when considering levels of online crime it should be noted that not all business premises use computers and so cannot become victims of online crime.
Overall, computers were used by 84 per cent of premises across the five sectors covered, with levels of computer use varying by sector [footnote 4]:
- manufacturing (92%)
- transportation and storage (91%)
- arts, entertainment and recreation sectors (90%)
- wholesale and retail (85%)
- accommodation and food (68%)
Combined estimates from the three surveys show that there were an estimated 264,000 incidents of online crime against business premises in the 5 sectors in the 12 months prior to interview. The vast majority of these were computer viruses (211,000 incidents), which accounted for 80 per cent of all online crime. Overall, around 10 per cent of premises in the five sectors had experienced one or more incident of online crime. As figure 4.4 shows, this figure was highest for the arts, entertainment and recreation sector (16%), and lowest for the accommodation and food sector (7%).
Figure 4.4: Proportion of premises experiencing online crime, by sector, 2012, 2013 and 2014 CVS
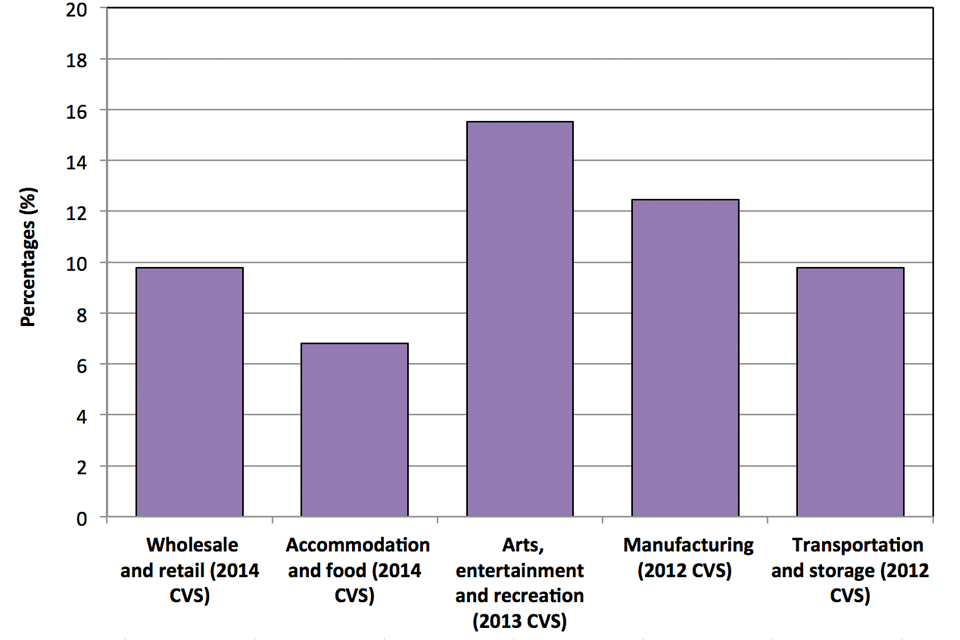
.
Chart note
Questions about online crime were not asked of the agriculture, forestry and fishing sector.
Source
Home Office, 2014 CVS Headline Tables.
Although the levels of computer viruses picked up by the CVS are relatively high, the levels of other online crimes are lower. This is likely to be because these crimes do not come to the attention of victims. For example, in the case of phishing, the offending email may be caught by spam filters, or victims may not know that their computer systems have been hacked. It may also be the case that many types of online crime are not picked up by the CVS as they do not affect businesses at the premises level. Some of these offences may be more likely to be focused on head offices or corporate websites.
Incidents of online crime are not included in the overall count of CVS crime as these questions are only asked of half the sample, and there is also a risk of double-counting with other crime types, such as theft or fraud. In addition, not all negative online incidents would be recorded as a crime. Whether receiving a phishing email or being infected by virus is counted under Police Recorded Crime depends on whether the incident was targeted at a specific victim, or any financial loss was incurred.
Organised crime
Organised crime is defined as crime that involves individuals, normally working with others, committing serious crime on a continuing basis. This usually includes elements of planning, control and coordination, and benefits those involved. The motivation is often, but not always, financial gain.
To provide information on this type of crime, respondents who had experienced crime in the past year were asked whether they thought that the most recent incident of each crime type experienced was carried out by a ‘loosely knit group’, ‘an organised group of criminals’ or ‘someone working alone’. Respondent perceptions of this varied considerably by the type of crime.
Across the six sectors surveyed between 2012 and 2014, theft of vehicles was the crime type that the highest proportion of respondents thought had been carried out by an organised group, at 43 per cent. The crime types that were least likely to be perceived to be organised were theft by employees, assaults and threats, and fraud by employees.
Figure 4.5: Proportion of incidents respondents perceived to have been carried out by an organised group of criminals across all six sectors, by crime type, 2012, 2013 and 2014 CVS
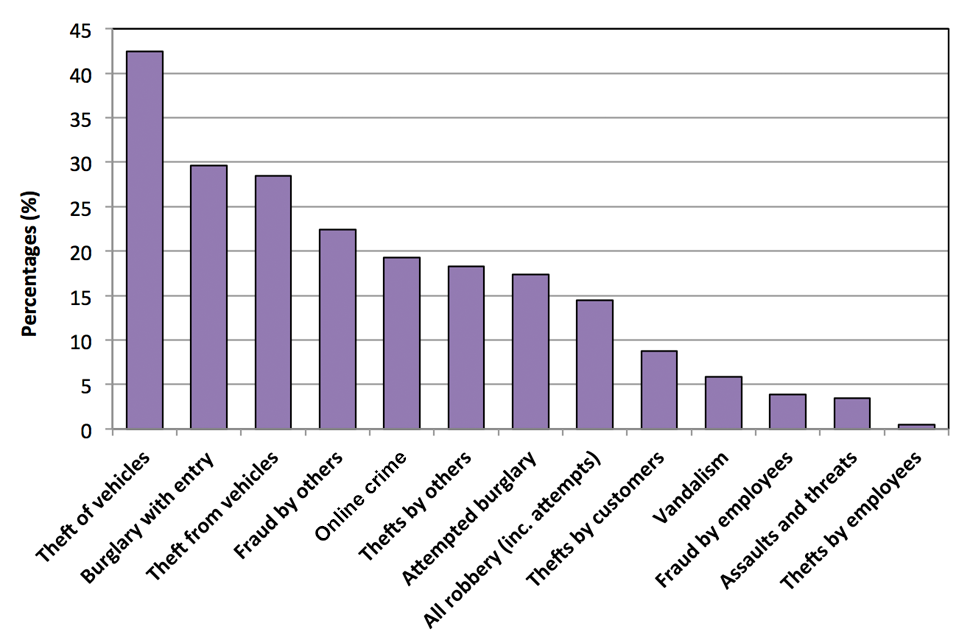
.
Source: Home Office, 2014 CVS Headline Tables.
Figures on the proportion of incidents respondents thought were carried out by an organised group of criminals, by industry sector, can be found in Table OC2 in the 2014 CVS Headline Tables.
Reasons for thinking that a crime was organised
The 2014 CVS included questions asking respondents why they perceived a particular incident to have been carried out by an organised group of criminals. This was asked as an open ended question, with no response categories specified.
292 business premises across all three sectors answered this question, with a reason given for each incident where the respondent thought that the crime had been carried out by an organised group. The crime types that victims thought were most often carried out by an organised group of criminals were theft by customer, burglary and fraud.
Although the question was open ended, some of the responses revealed some common themes:
- the suspect seemed to have knowledge of the business layout/area
- other business premises in the area had recently experienced similar offences
- they recognised the offenders as having previously committed an offence at the premises
- several people seemed to be working together, or the job was too big for one person
- they were a group that seemed to know each other (in the case of assaults)
- police information (other stolen goods discovered, group known to police)
- particularly with vehicle thefts or thefts from vehicles, the suspects seemed very prepared
- assumptions based on the appearance/personal characteristics of the offender (foreigners, travellers, people dressed unusually, etc.)
Given the relatively broad definition of organised crime, most of these reasons appear to be consistent with the definition. However, in some cases it is hard to see a clear difference between cases where the crime is carried out by an organised group, as opposed to a loosely knit group. Future development of this question will be considered alongside other priorities for the survey.
Reporting rates
The CVS asks those respondents in the 6 sectors who had experienced an incident of crime in the past year whether the police came to know about the most recent incident of each crime type.
The combined results from the 2012 to 2014 CVS surveys showed that reporting rates varied considerably by the type of offence. Of all the crime types, incidents of vehicle theft were the most likely to be reported, with a 100 per cent reporting rate. Incidents of burglary were also well reported with around 87 per cent of incidents of burglary with entry and 57 per cent of attempted burglaries being reported to police. It is likely that in cases of both vehicle theft and burglary, high reporting rates are partly due to the higher losses associated with these crimes (as indicated by findings from the 2013 survey), which in turn mean that victims need to obtain a crime reference number from the police in order to make an insurance claim.
Reporting rates were lowest for online crime (3%). This may well be because the losses associated with many of these crimes, in particular computer viruses, are small. Rates were also low for crimes such as theft by employees (34%) and assaults and threats (38%).
Figure 4.6: Proportion of incidents reported to the police across all six industry sectors, by crime type, 2012, 2013 and 2014 CVS
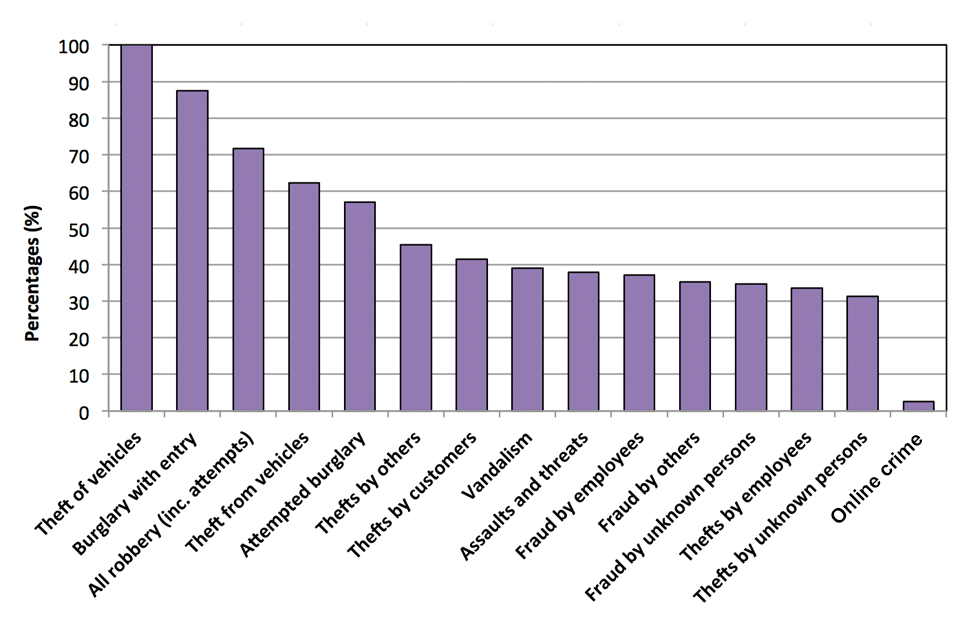
.
Source: Home Office, 2014 CVS Headline Tables.
Victims of crime who had not reported their most recent incident of crime to the police were asked to provide reasons for not doing so, which varied considerably by crime type. For example, for burglaries and thefts lack of police engagement was often quoted as a reason, as was the fact that the crime was trivial/there was no loss involved. Thefts and frauds involving employees were often dealt with internally. Lack of evidence was sometimes quoted as a reason for not reporting incidents of theft.
5. Anti-social behaviour, police perceptions and online crime
5.0 Introduction
This section covers a range of other findings from the CVS, which span various business sectors:
- anti-social behaviour (ASB) against business premises
- contact with and perceptions of the police
- fear and impact of online crime
Results for these topics are presented in the accompanying 2014 CVS Anti-social behaviour, perceptions of policing and online crime tables.
5.1 Key findings
Most premises perceive anti-social behaviour (ASB) to either not be a problem at all, or only a small problem.
Only a small proportion of premises perceived it to be a very/fairly big problem (around 5 per cent in each sector).
Contact with the police had fallen amongst premises across all three sectors.
Aside from crimes reported, the proportion of premises in all three 2014 sectors that had been in contact with the police fell. Levels are now around 15-20 per cent.
Worry about online crime varies depending on sector.
Fear of online crime in the wholesale and retail sector (24%) has increased since 2012, and is higher than in the accommodation and food sector (11%).
5.2 Anti-social behaviour
Over the last three years the proportion of premises experiencing anti social behaviour (ASB) has remained fairly steady, as shown by figure 5.1. Premises in the accommodation and food sector were most likely to have experienced ASB, with almost one in five having done so. This is unsurprising, given that this sector includes pubs, bars and nightclubs. However, the perceived impacts of anti-social behaviour were generally quite small. For example, over a third of those experiencing ASB in the accommodation and food and wholesale and retail sectors reported that it had little or no impact. The most common types of impact were negative impacts on custom in these two sectors (37% for each sector), and financial impacts in the agriculture, forestry and fishing sector (54%).
Figure 5.1: Proportion of premises experiencing anti-social behaviour, 2012, 2013 & 2014 CVS
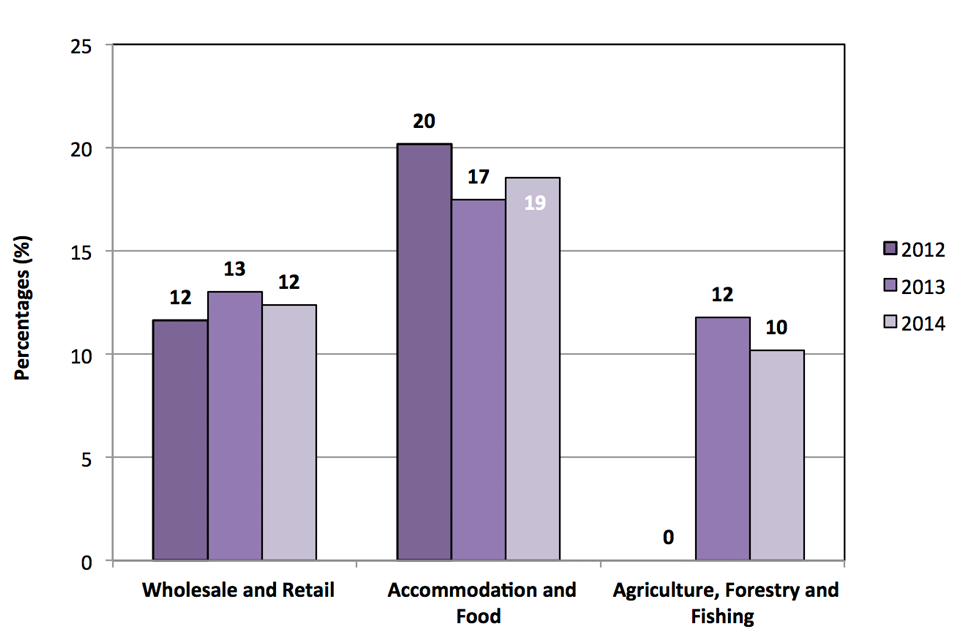
.
Chart note
Data was not collected for the agriculture, forestry and fishing sector in 2012 survey.
Source
Home Office, 2014 CVS Anti-Social Behaviour, perceptions of policing and online crime tables.
As figure 5.2 below shows, in addition to many premises reporting that ASB had little, or no, impact most premises also perceive ASB to either not be a problem at all, or only be a small problem. Only a very small proportion (around 5% in each sector) perceived it to be a big problem.
Figure 5.2: The extent to which premises perceive anti-social behaviour to be a problem, by sector, 2014
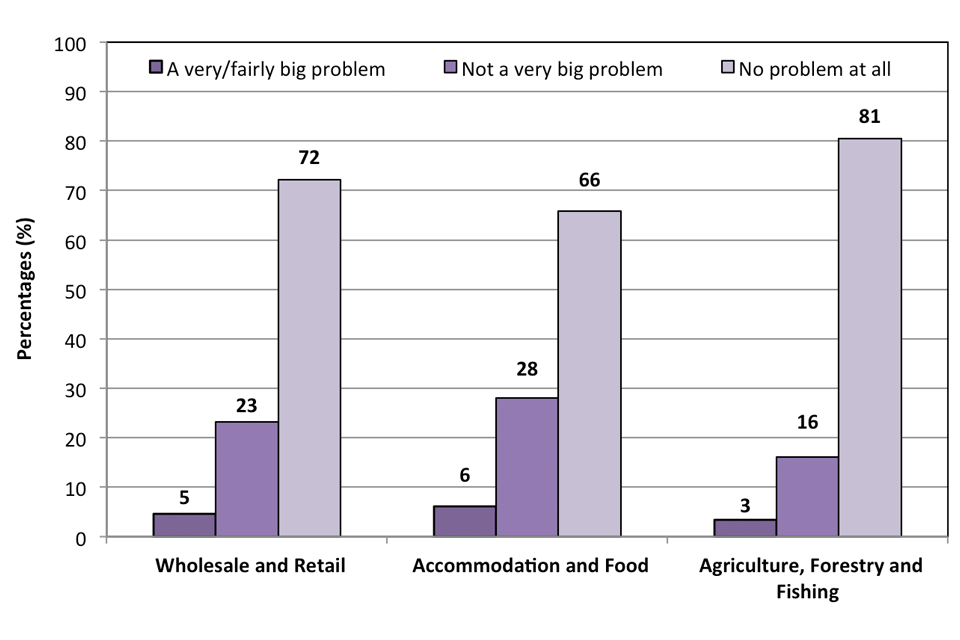
.
Source: Home Office, 2014 CVS Anti-Social Behaviour, perceptions of policing and online crime tables.
5.3 Contact with and perceptions of the police
The CVS asks questions about the contact that business premises have had with the police, excluding any crimes that they reported. It then also asks about their perceptions of the police. Figure 5.3 below shows that over the last three years both the wholesale and retail, and accommodation and food sectors, have seen statistically significant falls in the proportion of premises that had contact with the police. The agriculture, forestry and fishing sector also saw a significant fall between 2013 and 2014. There are many factors that could have caused this, such as fewer visits from the police, or fewer local meetings between business premises and the police. It is also possible that fewer business premises felt the need to contact the police given the fall in business crime over this period.
It is interesting to note alongside this that, between 2013 and 2014, there was a statistically significant increase in the proportion of premises in the agriculture, forestry and fishing sector that were dissatisfied with the way in which the police had handled crime in their area. However, similar increases in dissatisfaction were not seen for the wholesale and retail or accommodation and food sectors, and recent findings from the Crime Survey for England and Wales showed a rise in the proportion of people who rated the local police as ‘good’ between 2012 to 2013 and 2013 to 2014 [footnote 5]. Amongst business premises, the most common reasons for dissatisfaction across all sectors included the police taking too long to react to incidents, or not being interested in reported crimes.
As was the case in 2013, premises that were victims of crime were significantly more likely to be dissatisfied with the way in which the police dealt with crime than premises that had not been victims. This was true across all business sectors, and is also similar to findings from the Crime Survey for England and Wales. This found that victims of crime were more likely than non-victims to disagree that the police and local council were dealing with anti-social behaviour and crime issues in the local area. Similarly, victims were less likely to have confidence in the local police.
Figure 5.3: Proportion of premises who had contact with the police about crime problems or prevention in the last 12 months, by sector, 2012, 2013 and 2014 CVS
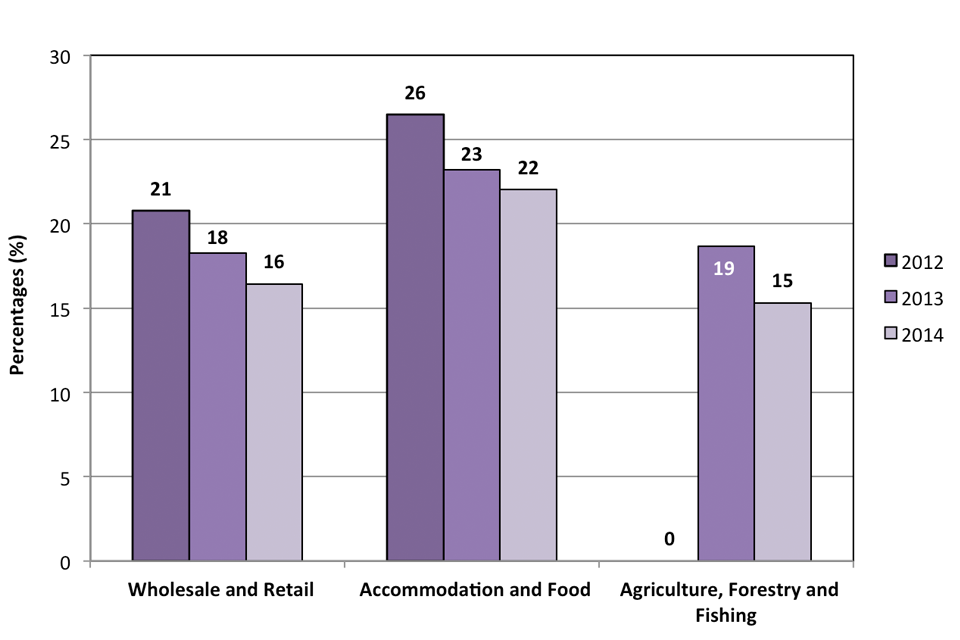
.
Source: Home Office, 2014 CVS Anti-Social Behaviour, perceptions of policing and online crime tables.
5.4 Online crime
In the CVS premises are asked about how worried they are about online crime, and how much of a problem they think it is for them. Premises in the agriculture, forestry and fishing sector were not asked these questions given the small proportion that used computers. The wholesale and retail sector and the accommodation and food sector showed a different picture in terms of worry about online crime (figure 5.4). Between 2012 and 2014 the proportion of premises worried increased significantly in the wholesale and retail sector, but fell significantly in the agriculture and food sector. While in 2012 and 2013 levels of worry were similar in both sectors, the wholesale and retail sector now has much higher levels of worry (24%) than the accommodation and food sector (11%).
The extent to which premises think online crime is a problem for them does not seem to be linked to their worry about online crime. Whilst the proportion of premises worried changed between 2012 and 2014, the proportion of premises who thought that online crime was a problem for them remained steady during this period, at low levels of 5 per cent or less. This suggests that the fear of online crime is greater than the problems caused by it at the moment, and may also indicate that whilst online crime is not a major problem at present, businesses fear that it may become so in future.
Figure 5.4: Proportion of premises who were worried about online crime, by sector, 2012, 2013 and 2014 CVS
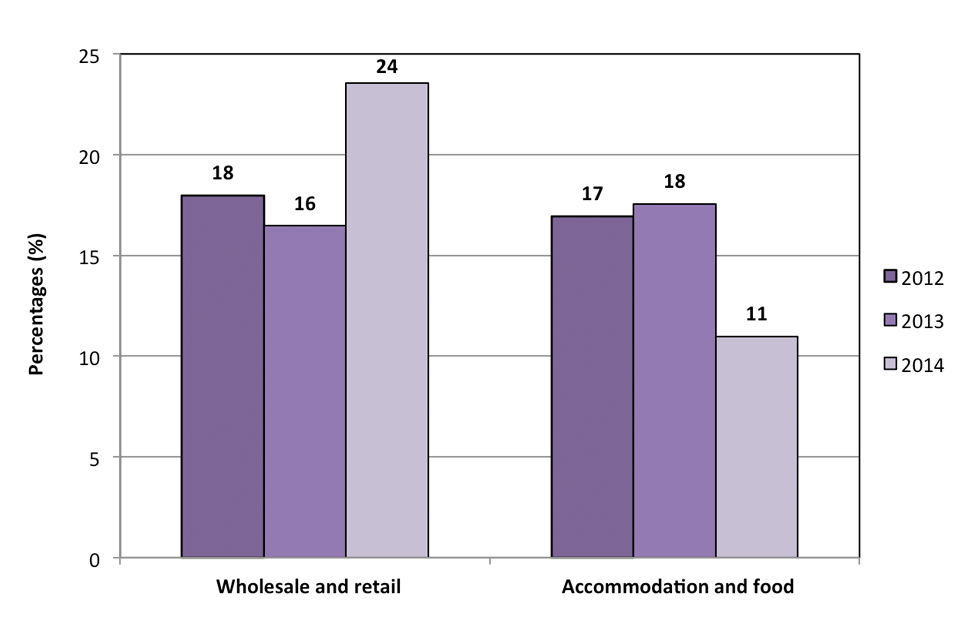
.
Source: Home Office, 2014 CVS Anti-Social Behaviour, perceptions of policing and online crime tables.
6. Annex A. Matching CVS data to the Home Office Data Hub
In the 2014 CVS, respondents who said they had reported crimes to the police were asked for the first time whether they received a crime reference number from the police. Those who did receive one were then also asked to provide this. Having crime reference numbers for these crimes offers many extra opportunities for analysis, as these crimes in the CVS could then be matched with the Home Office Data Hub (HODH), a record level database of police recorded crime. The combined information provided by the two data sources could allow much more in depth analysis to be produced, such as more detailed geographical analysis and details about the crimes themselves, such as items stolen, or the outcomes of them.
There are several questions in the CVS that lead to the respondent being asked for a crime reference number. Importantly, victims are only asked to provide a crime reference number for the most recent incident that they experienced. This is to avoid placing unnecessary burden on respondents, but it does limit the number of opportunities for matching these numbers with HODH, especially for premises that experience many crimes in the year. The number of crime reference numbers provided can never be as great as the number of incidents reported in the CVS: it can only be as high as the number of victims.
Figure A1: Conceptual diagram illustrating the process by which crime reference numbers are provided in the CVS.
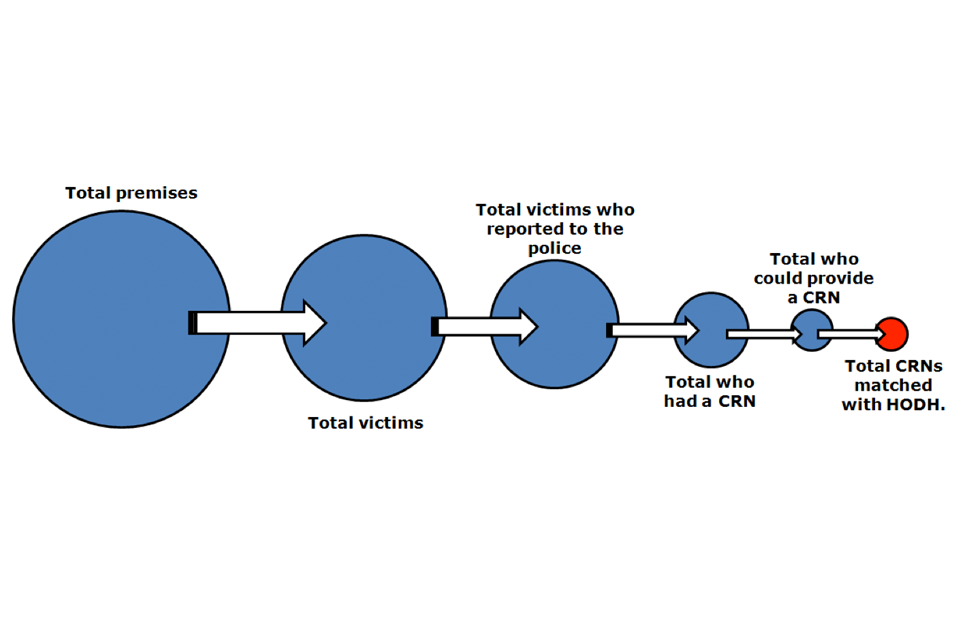
.
Chart notes
- not to scale
- CRN = crime reference number
- HODH = Home Office Data Hub
Table A1 highlights some of the issues encountered with this approach. For some crime types, the proportion of crimes reported to the police and then given a crime reference number is quite high (up to 93% for some crime types). However, the proportion of these where the victim recalls or is able to provide the crime reference number is low. Even for the crime types where respondents were more likely to have received a crime reference number, such as burglary with entry and theft by customers (shoplifting), fewer than a quarter of those respondents who were given a crime reference number were able to provide it in the survey. Across all crime types, only 166 crime reference numbers were provided out of a total of over 3,700 crimes for which a crime reference number was asked for in the survey.
Table A1: Respondents who were given a crime reference number, and able to provide it, 2014
| Number of victims (000s) | Incidents reported to police (000s) - as a proportion of the number of victims | Incidents where a crime reference number was given by the police (000s) - as a proportion of incidents reported | Incidents where respondent could provide the crime reference number (000s) - as a proportion of incidents where a crime reference number was given | |
|---|---|---|---|---|
| Crime type | ||||
| All burglary (inc. attempts) | ||||
| Burglary with entry | 32 | 28 (87%) | 26 (93%) | 6(24%) |
| Attempted burglary | 20 | 11 (57%) | 9 (76%) | 1 (11%) |
| Vandalism | 55 | 20(37%) | 15(76%) | 2 (14%) |
| All vehicle-related theft | ||||
| Theft of vehicles | 3 | - | - | - |
| Theft from vehicles | 7 | 4(52%) | - | - |
| All robbery (inc. attempts) | 12 | 9(72%) | 7(80%) | 1 (8%) |
| Assaults and threats | 51 | 19(37%) | 12(64%) | 2(13%) |
| All theft | ||||
| Thefts by customers | 73 | 29(40%) | 25(85%) | 6(23%) |
| Thefts by employees | 14 | 5(31%) | 4(82%) | 0(0%) |
| Thefts by others | 9 | 4(40%) | - | - |
| Thefts by unknown persons | 35 | 8(23%) | 6(75%) | 1(15%) |
| Online crime | 39 | 1(2%) | - | - |
Table notes
- figures have been rounded to the nearest whole; percentages have been calculated prior to rounding
- fraud offences are excluded because they have been recorded by Action Fraud since April 2014, following a phased transition from police forces recording them; as a result, many of the fraud offences covered by the 2014 CVS will have been reported to Action Fraud rather than the police; crime reference numbers from Action Fraud are not collected via the Home Office Data Hub, and so it is not possible to include them in this matching work
Source
Home Office, CVS findings 2014.
For the relatively small number of cases where a crime reference number was provided, an attempt was made to match these to the Home Office Data Hub. This was done for some of the more prevalent crime types, such as shoplifting and burglary. There were few matches with the Home Office Data Hub. Of just over 100 unweighted cases of shoplifting and burglary where a crime reference number was provided in the CVS, only 16 could be matched to the Home Office Data Hub. This could be for several reasons:
- respondents do not recall the crime reference number correctly, and what they provide the interviewer with is not actually the correct crime reference number; there were some cases where the reference number provided was clearly not the correct one
- the crime is not in the Home Office Data Hub; currently around 35 police forces are providing some data via this method, although the completeness and quality varies; therefore some offences in the CVS will not be found in HODH; this will improve as more forces supply more comprehensive data to the HODH
No analysis is presented here from the matching itself, due to the relatively small number of matches. This work does have potential for the future but it is clear that there are a couple of key things that prevent the approach from being more successful at this stage:
- many premises do not keep a record of, or recall, crime reference numbers, it is likely that if they are required to make an insurance claim for particular crime types, they are often disposed of once the claim has been made
- victims do not always correctly recall crime reference numbers; the crime reference numbers supplied by respondents did not always appear to be ‘correct’, and so cannot be matched successfully
- not all police forces are supplying good quality crime data to the Home Office Data Hub; once all forces are doing so, the potential for matching will be greater
Collection of crime reference numbers and potential matching work will be considered further by the CVS steering group, with a view to revisiting this area in future bulletins.
7. Technical annex
7.1 Conventions used in figures and tables
Table abbreviations
‘n/a’ indicates that the question was not applicable.
‘-’ indicates that data are not reported because the unweighted base is fewer than 50 respondents.
7.2 Unweighted base
All percentages and rates presented in the tables are based on data weighted to compensate for differential non-response and stratification of the sample design. Unweighted bases that represent the number of people interviewed in the specified group are shown in the headline and comparison tables.
7.3 Percentages
Row or column percentages may not add to 100 per cent due to rounding.
Most tables present cell percentages where the figures refer to the proportion of business premises having the attribute discussed and the complementary percentage, to add to 100 per cent, is not shown.
A percentage may be quoted in the text for a single category that is identifiable in the tables only by summing two or more component percentages. In order to avoid rounding errors, the percentage has been recalculated for the single category and therefore may differ by one percentage point from the sum of the percentages derived from the tables.
7.4 ‘No answers’ (missing values)
All analysis excludes don’t know/refusals unless otherwise specified.
8. Methodology
8.1 Introduction
The 2014 Commercial Victimisation Survey (CVS) is the third of a series of Home Office surveys covering crime against businesses, which began with the 2012 CVS. There are plans to repeat the survey in 2015, 2016 and 2017. Prior to this, the survey was run in 1994 and 2002.
The National Statistician’s review of crime statistics recommended the Home Office continue to implement its plans for a telephone survey of businesses in order to address the significant gap in crime statistics that existed for crimes against businesses. While police recorded crime does include crimes against businesses, it does not separate these out from other crimes (other than for offences such as shoplifting which, by their nature, are against businesses) and also only includes those crimes that are reported to, and recorded by, the police. The Crime Survey for England and Wales (CSEW) is a survey of crime against households and individuals living in those households and so does not cover crime against businesses.
8.2 Key facts
-
CVS is a telephone survey in which respondents from a representative sample of business premises in England and Wales are asked about crimes experienced at their premises in the 12 months prior to interview
-
estimates for the 2014 CVS are based on 4,080 interviews with respondents at premises in the wholesale and retail, accommodation and food, and agriculture, forestry and fishing industry sectors
-
fieldwork was carried out between August and November 2014 and the survey achieved a response rate of 54 per cent
8.3 Data Tables
Final fieldwork figures, giving the number of interviews by sector and business size, can be found in the 2014 Commercial Victimisation Survey methodology tables.
Sample and survey coverage
The 2014 CVS focused on three industry sectors defined by the UK Standard Industrial Classification 2007 (SIC). These were sectors A (agriculture, forestry and fishing), G (wholesale and retail trade) and I (accommodation and food services activities). The last two Crime Victimisation Surveys each focused on four sectors. In 2014, one sector was dropped in favour of collecting a double sample (2,109 respondents) from the wholesale and retail sector. This was to allow more detailed analysis of this sector, due to particular user interest in this area. Between them, the three sectors account for just under a third of all business premises in England and Wales.
Two of the three sectors included in the 2014 survey were also included in the 2012 and 2013 surveys. They were the wholesale and retail (G) sector and the accommodation and food (I) sector. The third sector (agriculture, forestry and fishing) was also included in 2013.This continuity has enabled some reporting on trends in crime against businesses for the first time since the introduction of the CVS. Decisions on sector coverage were made following discussions with the CVS Steering Group and in response to user needs.
The survey was designed to measure crime at the premises rather than the enterprise level (i.e. a single outlet of a national chain would have been sampled rather than the entire business entity). As such, only crimes that were directly against the specific sampled premises were in scope. To be representative at the premises level, the sample was also designed so that multiple premises in the same enterprise could be sampled.
The sample was drawn from the Interdepartmental Business Register (IDBR), a list of UK businesses covering 99 per cent of UK economic activity which is maintained by the Office for National Statistics (ONS) and widely used as a sample frame for national surveys of businesses. Companies are included on the IDBR if they are registered with (HM Revenue and Customs (HMRC) for VAT purposes, operate a PAYE scheme, or are registered at Companies House. In practice, the VAT registration threshold means that all companies in the UK with a turnover of taxable goods and services over £79,000 per annum were included in the sample. Those with a turnover less than this are excluded, and as a result it is likely that some recently formed companies and small companies will not be covered by the survey.
The sample was stratified by size and industry sector to ensure that there were an adequate number of interviews for analysis of different sized businesses within each sector. However, as the survey was designed to produce national estimates, there was no geographic stratification and therefore the sample size is too small to produce sub-national estimates.
8.4 Fieldwork
The 2014 CVS was conducted as a series of telephone interviews with respondents between August and November 2014. Premises were first contacted to identify the appropriate respondent for the interview, which was generally the person responsible for security and crime-related issues at the premises. Respondents were then sent an ‘Experience of crime’ sheet before being contacted for interview which detailed the information that would be requested by the interviewer, allowing them time to gather and make note of required information relating to the extent of crime against their premises in advance.
Estimates for the 2014 CVS are based on a total of 4,080 interviews, with around 2,000 in the wholesale and retail sector and around 1,000 in the remaining two sectors covered by the survey. The final main stage of the survey had an overall response rate of 54 per cent, which is considered high for a voluntary survey of businesses. Further information on response rates and reasons for non-response is included in the technical report.
Table T1: Target and achieved number of interviews, 2014 CVS
| Sector | Target number of interviews | Achieved interviews |
|---|---|---|
| Wholesale and retail | 2,000 | 2,111 |
| Accommodation and food | 1,000 | 1,052 |
| Agriculture, forestry and fishing | 1,000 | 1,019 |
| Total | 4,000 | 4,182 |
8.5 Questionnaire structure
Respondents were asked whether the business at the current premises had experienced a range of crimes in the 12 months prior to interview. If so, they were then asked how many crimes of each type had been experienced in the same 12-month period. Less than three per cent of businesses had been at their current premises for less than 12 months and in these cases they were asked only about crimes experienced since they had moved to their current premises.
Respondents were also asked a number of questions about the circumstances of the crimes experienced, some of which (such as reporting the incident to the police and whether they thought the incident had been carried out by an organised group of criminals) are reported here. Where business premises had experienced more than one incident of a particular crime type in the last 12 months, they were asked about the circumstances of only the most recent incident.
As well as the range of core offences covered by the survey, the CVS questionnaire also includes a module asking about experience of online crime and another asking about crime prevention. Around half of the sample was randomly assigned to answer questions from the online crime module and the other half the crime prevention module.
Respondents were also asked about other crime-related issues at the sampled premises, such as experience of anti-social behaviour and contact with the police.
8.6 Analysis
Prior to analysis of the survey data, a number of modifications were carried out on the data. The methodology below will be reviewed against future data to assess its effect across more than one year of data.
Weighting
Data are weighted to take account of both non-response and the stratification of the original sample. Non-response is a result of either being unable to identify contact details for sampled business premises or from contacted premises being unwilling to take part in the survey. Weighting accounts for stratification by ensuring that the sample is representative of businesses in these four sectors in England and Wales as a whole.
Data cleaning
The nature of crime against businesses means that it is possible that a small number of premises may have experienced a volume of crime that has a disproportionately large effect on figures for the sample as a whole, which would make comparison of trends over time problematic. To prevent a small number of sampled premises having an excessive influence on overall figures, the data were assessed to identify any outliers. Within this, two cases were identified where the numbers of crimes reported were so large that it was judged that they were very likely to be erroneous or that the respondents had misunderstood some questions (for example, they had given the number or value of items stolen rather than the number of incidents of theft). These cases were removed from the data, as these respondents were judged to be unreliable.
Further to these two cases, the data were examined for other outlier values in terms of the number of incidents reported by a respondent. A process of incident capping is used in other crime surveys (for example, the CSEW in effect caps the number of incidents that can be experienced by a respondent at 30). However, for the CVS a more detailed approach is needed to account for the wide variation in the type of premises in the sample and the crime types covered. For example, it would be wrong to set a single cap across the whole survey as incidents of theft by a customer against a large retailer would be expected to occur much more often than incidents of burglary.
A statistical measure known as Cook’s distance was used as a measure of whether data points were outliers. A high Cook’s distance indicates that a data point has a large effect on the mean. For each crime type, any data points within a particular sector and size band that had a Cook’s distance greater than 10 and that were substantially higher than the mean number of incidents experienced by respondents in the same sector and size band (i.e. more than 30 times the square root of the mean) were identified as outliers.
Across the 4,080 remaining interviews and the 14 crime types covered by the survey (a total of 58,520 figures supplied on numbers of crimes experienced), a total of 14 figures (0.02%) were identified as outliers. These were then set to the mean number of incidents experienced by victims within the same sector and size band.
Imputation of missing data
A small number of respondents to the survey said that they did not know if their business had been a victim of a particular type of crime at all in the previous 12 months. In these cases, values were imputed as the mean number of incidents experienced by the other business premises in the same industry sector and size band. Where this was less than one, these cases were classed as non-victims for the purpose of calculating prevalence rates; where this was one or more, they were classed as victims.
Of the 62,730 responses to questions regarding whether a particular crime type had been experienced, a total of 179, (0.3%) were imputed.
8.7 Interpreting the results
When interpreting the results presented in this publication, some consideration should be given to various issues around the structure of the survey and of business premises in England and Wales.
Coverage
As outlined above, the 2014 CVS focused on business premises in three industry sectors:
- wholesale and retail
- accommodation and food
- agriculture, forestry and fishing
Each of these sectors has previously been surveyed; in addition, three other sectors were surveyed in 2012 and 2013. However, due to the varied nature of business sectors, the results of the survey should not be considered to be representative of crime against businesses as a whole, only of crime against the sectors surveyed. For example, it would be unwise to take the survey results presented here to indicate trends in crime against the financial or IT sectors, which are very different in their nature.
The CVS is a premises-based survey and many businesses will operate at, or own, a number of different premises. It is important to bear this in mind when considering the results of the survey. In addition, where results are presented by premises size (measured by the number of employees at the premises), it should be remembered that this relates to the number of employees employed at that particular premises, and not in the business as a whole.
Similarly, while the CVS is intended to complement existing sources of information on crime, such as the CSEW, consideration of the methodology and coverage of the surveys means that it is not possible to combine the results from the two to obtain a ‘total’ count of crime. Differences in definitions and methodology between the two surveys mean figures are not directly comparable. In addition, as stated above, the CVS does not intend to give a full count of crime against all businesses, only against those in the sectors covered. There may also be a small amount of double counting between the two surveys, particularly in cases of robbery and assaults and threats.
Rates and numbers
Numbers of crimes are presented for premises in each sector, broken down by the numbers of employees at the premises. These numbers are produced by scaling up weighted data from the survey sample to the total number of business premises in each sector and size band combination in England and Wales as a whole. Therefore, care should be taken when comparing levels of crime between sectors, or when comparing different premises sizes due to differences in the number of such premises in the country as a whole.
For example, the wholesale and retail sector is the largest of those covered by the CVS, with survey estimates grossed to around 315,000 premises in England and Wales, whereas survey estimates for the accommodation and food sector are grossed to a total of 121,000 and agriculture, forestry and fishing to 84,000 in the 2014 CVS. Arts, entertainment and recreation grossed to 40,000 in the 2013 CVS, and manufacturing to 110,000 and transportation and storage, and accommodation and food, to 60,000 premises in the 2012 CVS. A greater number of crimes against the wholesale and retail sector would therefore be expected as it accounts for more premises than the other two 2014 sectors combined.
For this reason, when making comparisons between different types of business premises, either by sector or by size, it is better to compare the rates of crime between these premises, which control for the different number of premises in each category.
Reporting rates and organised crime
As well as rates and numbers for the main crime types covered by the CVS, figures are also presented here on reporting rates (the proportion of incidents of crime reported to the police) and organised crime (the proportion of crimes perceived to have been carried out by an organised group of criminals). These figures are based on the most recent incident of each crime type that occurred in the last 12 months. It is not possible to show percentages for combined crime groups (for example, all burglary, all theft) as the questions on reporting and organised crime are asked only of the most recent incident experienced and this cannot be identified across these groups. For example, where a respondent has experienced theft by a customer, and theft by an employee, it is not possible to identify which of these was the most recent and therefore produce a figure for the most recent incident of theft.
Statistical methodology
The CVS estimates are based on a representative sample of businesses in a selection of industry sectors in England and Wales each year. The CVS uses a sample, which is a small-scale representation of the population from which it is drawn.
Any sample survey may produce estimates that differ from the figures that would have been obtained if the whole population had been interviewed. It is, however, possible to calculate a range of values around an estimate, known as the confidence interval (also referred to as margin of error) of the estimate. Standard 95% confidence intervals were calculated using the means and standard deviations of variables estimated using the survey data. In practice this means that if many different samples of business premises were drawn, the estimates produced from the vast majority of these would fall within the interval (error margin).
Formal significance testing of the differences between survey estimates from different years was carried out. Significance testing is a statistical tool which is used to determine whether a difference between two estimates is likely to be genuine (statistically significant) or whether there is insufficient evidence in the survey data to suggest that the difference hasn’t been observed by chance, due to sample variation (not statistically significant). Unless otherwise stated, all significance tests were carried out at the 95% level. This means that the statistically significant results quoted in this bulletin have at least a 95% chance of reflecting genuine differences, i.e. the probability of observing such difference by chance is 5% or less.
Two-sample z-tests for means were used to do significance testing for incidence rates and the average numbers of crimes per victim, while unpooled two-sample z-tests for proportions were used for prevalence rates, reporting rates (to the police) and the proportions of crimes that were perceived to have been carried out by an organised group of criminals. Statistical significance was determined by the results of the z-tests.
In some places significance was also indicated by the fact that the confidence intervals of two estimates did not overlap. However, while non-overlapping confidence intervals usually indicate a statistically significant difference, overlapping confidence intervals do not always indicate a lack of statistical significance.
8.8 Details of the calculation of costs of crime
Respondents who had been victims of crime within the previous 12 months were asked for the direct financial cost resulting from the most recent incident of that crime type. Respondents were asked for the total value regardless of whether the items were returned or whether they received any insurance payment. A minority of respondents were unable to provide absolute figures for the cost of a particular crime and were therefore asked to estimate them within a range. Some respondents were unable or refused to provide an estimate. Information from both questions was combined to produce the estimates presented, by taking the midpoint of each range in the second question as the estimate of the cost. The ranges defined in the questionnaire are as follows:
Which of the following is closest to the total value?
Nil, negligible
Up to £250
£251-£500
£501-£750
£751-£1000
£1,001-£2,500
£2,501-£5,000
£5,001-£10,000
£10,001-£50,000
£50,001-£100,000
£100,001-£500,000
£500,001-£1,000,000
£1,000,001-£5,000,000
£5,000,001-£9,000,000
More than £9,000,000
Don’t know
8.9 Survey burden
Producers of official statistics, such as those presented in this report, are required to be compliant with the Code of Practice for Official Statistics (2009) (the Code) Principle (6) on proportionate burden, which states:
“The cost burden on data suppliers should not be excessive and should be assessed relative to the benefits arising from the use of the statistics”
In order to comply with the Code, the Home Office is required to report the estimated costs to businesses of responding to statistical surveys such as the CVS, using a compliance cost model that is used consistently by government departments.
As the CVS is completed by businesses, the Home Office make annual estimates of the cost to these organisations of completing the survey. The total compliance cost for this survey, on businesses, is estimated to be around £24,000 per annum.
Estimates of survey compliance costs are collated and published by the ONS Survey Control Unit, for all government departments, including the Home Office. These can be found here:
Total survey compliance costs for each Government department
Compliance costs for individual Government surveys
8.10 Other data sources
Figures on the number of incidents, incidents per 1,000 premises, number of victims and proportion of premises that experienced crime by sector and business size, can be found in the 2014 CVS Headline tables.
Headline and detailed findings from the 2012 and 2013 CVS, including figures on the numbers of crimes, numbers of victims and incidence and prevalence rates, are also available online.
-
Although it is valuable to draw parallels between similar data sources, the differences in methodology and timing make it impossible to compare the CVS and the BRC Retail Crime Survey directly. The Comparison with other sources section of this chapter discusses these differences in more detail. ↩
-
Beck, A. (2011) ‘Self-scan checkouts and retail loss: Understanding the risk and minimising the threat’, Security Journal 24(3): 199-217. ↩
-
Source: 2014 Inter-Departmental Business Register. Data are for local units in England and Wales, as estimated by the ONS Business Registers Employment Survey (BRES). ↩
-
The figures for computer use in the manufacturing, transportation and storage, and arts, entertainment and recreation sectors presented in the 2013 bulletin have been revised. ↩
-
Source: Focus on Public Perceptions of Crime and the Police, and the Personal Well-being of Victims, 2013/14. ↩