Country and regional analysis 2022: guidance
Published 16 November 2022

© Crown copyright 2022
This publication is licensed under the terms of the Open Government Licence v3.0 except where otherwise stated. To view this licence, visit nationalarchives.gov.uk/doc/open-government-licence/version/3 or write to the Information Policy Team, The National Archives, Kew, London TW9 4DU, or email: psi@nationalarchives.gov.uk.
Where we have identified any third party copyright information you will need to obtain permission from the copyright holders concerned.
This publication is available at https://www.gov.uk/government/statistics/country-and-regional-analysis-2022/country-and-regional-analysis-2022-guidance
Overview
This document supplies additional information about the revisions, quality and methodology for the Country and Regional Analysis (CRA) publication. Please see the main text document for the headline figures, statistics, and visualisations.
The full set of tables showing public expenditure by England, Scotland, Wales, Northern Ireland, the English regions and function (A tables) and by sub-function (B tables) are available in spreadsheet format alongside this document.
In addition, the interactive tables allow users to manipulate the data to focus on, for example, expenditure by individual departments or individual countries or regions. The full set of data underlying these tables have also been published, so analysis of spend at a lower programme (‘segment’) level is also possible.
The methodology spreadsheet provides users with a brief overview of how expenditure at the segment level has been assigned to countries and regions by departments and HM Treasury.
Differences in TES totals
Total Expenditure on Services (TES) in the CRA will not match the TES figures in the November 2022 PSS publication, as it is based on earlier data published in the July 2022 PSS publication. For example:
| PESA July 2022 TES total | CRA November 2022 TES total | PSS November 2022 TES total |
|---|---|---|
| 952,291 (£million) in 2021-22 | 957,691 (£million) in 2021-22 | 953,882 (£million) in 2021-22 |
- The PESA July 2022 TES total was the first published outturn figure for 2021-22 TES.
- The CRA November 2022 TES total is based on the same OSCAR data used in PESA July 2022, but uses revised ONS figures and includes some other adjustments for functions and regions.
- The PSS November 2022 TES total is based on a different OSCAR dataset which includes revisions and updates made by departments.
Other notes
- The majority of the tables show expenditure rounded up to the nearest million. Tables may not sum due to rounding.
- Tables showing expenditure ‘per head’ are rounded up to the nearest pound.
- “0” in tables denote entries that are less than £0.5 million but do have expenditure against them.
- “-“ in tables denote entries with no expenditure against them.
- Sub-function descriptions that include “n.e.c.” in their wording denote “not elsewhere classified”.
Key terms and definitions
Real terms
Real terms figures are values that have been adjusted for inflation. This means expenditure can be compared across different years as if the prices of goods had not changed over time. Figures in nominal terms (i.e. that have not been adjusted for inflation) are not suitable for comparison across different years, as changes in part are due to the effect of inflation.
Real terms figures in this release are the nominal figures adjusted to the latest price levels using GDP deflators from the GDP deflators collection page on GOV.UK. The GDP deflators used for each release are published in the annex of the CRA release main text document.
Functions and subfunctions
Functions and subfunctions provide data breakdowns to further categorise areas of expenditure. This is done based on the Classification Of the Functions of Government (COFOG) framework under ‘Classifications’ on the left hand side choose ‘COFOG’: a United Nations defined system for functional analysis of government spending. The CRA and PESA analysis is consistent with the COFOG framework except for the health function. The sub-function analysis of health is presented against HM Treasury’s own sub-functional classification. This is because the NHS in England and Wales (not applicable to Scotland or Northern Ireland) is neither financed nor organised along the lines of COFOG level 2, so capturing the required additional information is not currently possible.
Per head figures
Per head figures have been calculated as follows. For 2021-22 financial year, population figures used for England, Wales and Northern Ireland are as of Census day 2021. England and Wales are sourced from the ONS and Northern Ireland from the Northern Ireland Statistics and Research Agency. Figures for Scotland are mid-2021 population estimates. All other years are mid-year population estimates from the ONS for the Countries of the UK and the English Regions (2011 Population Census based) mid-2017 to mid-2020. The population estimates used for each release are in an annex published in each related CRA release main text document.
Index Values
In some tables, (e.g., Table A.16) spend is shown as an index value. When this is done, total UK identifiable expenditure is shown to be 100 and spend in Scotland, Wales, Northern Ireland and the English regions is shown as a percentage of this. For example, if the total UK identifiable expenditure for a year was £8,000 per head, that would mean £8,000 would be 100 on the index scale. If a particular region had a spend of £4,000 per head, that would be equivalent to 50 on the index scale. If a particular region had a spend of £12,000 per head, that would be equivalent to 150 on the index scale.
Note that an index value of 100 across different functions does not necessarily represent a similar monetary value. Figure 1 shows an example of total identifiable expenditure per head from the CRA: November 2022 release (as part of tables A.15 and A.16).
Figure 1: Spend per head and index value comparisons, CRA 2022
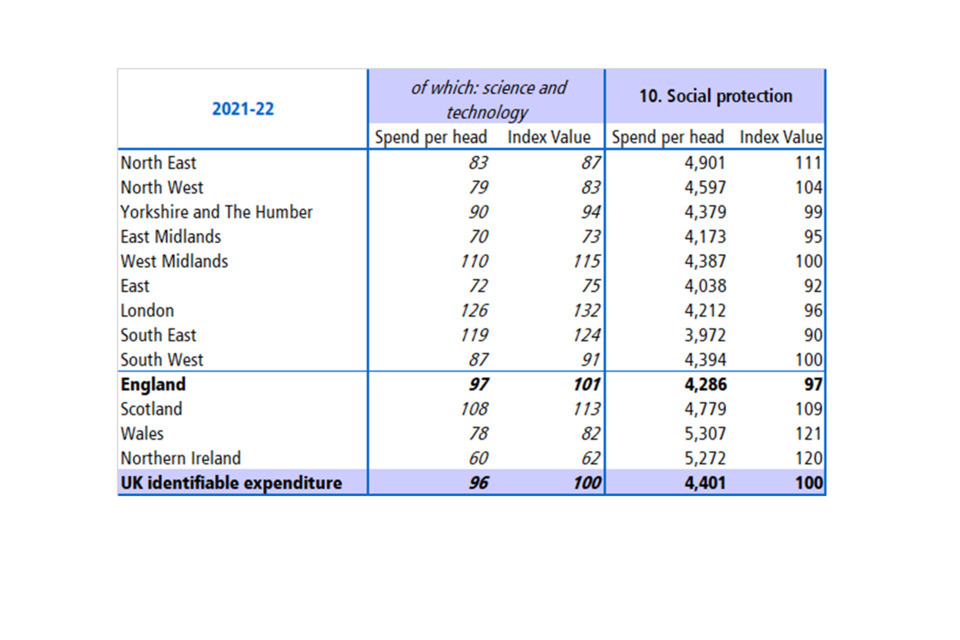
A table showing a comparison between expenditure per head and index values across different functions
Here, the total UK identifiable spend per head for science and technology is £102 which equals 100 as the index value, because £102 = 100% of the identifiable UK expenditure for that function. Whereas for social protection, the spend per head for the UK is £4,053 which also equals 100, as it represents the total UK identifiable expenditure for that function.
Therefore, it is important to note when comparing indexes across functions, that they can represent different monetary values. Index values are best used for comparing the variance of spending across countries and regions, and also spending in a region over time (when looking at real terms data).
ITL map and regions
The maps and data in these dashboards are based on the boundaries for the International Territorial Level (ITL) at Level 1, in the United Kingdom, as defined by the ONS as at January 2021. This has replaced the Nomenclature of territorial units for statistics (NUTS) geographies for the UK that were operational when the UK was a member of the European Union. ITLs include the boundaries for Northern Ireland, Scotland, Wales, and the 9 statistical regions in England. ITL regions are currently identical to the NUTS regions used in CRA 2021.
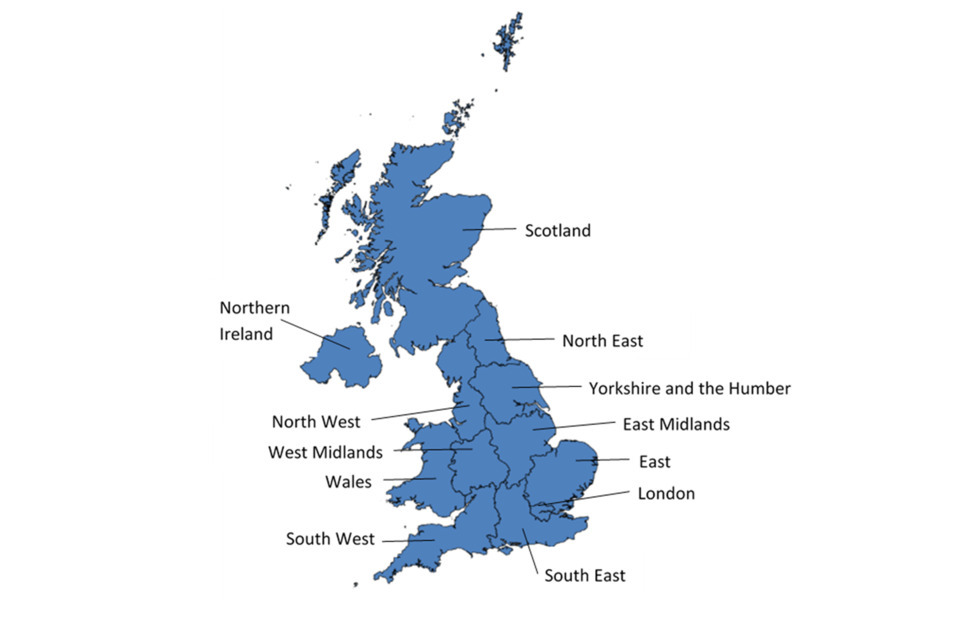
A map showing the UK ITL regions with labels
Guidance on using maps
Maps showing a breakdown of ITL level 1 geography are included to show a visual breakdown of expenditure per head and indexes. In the CRA release, darker shades of colour represent higher levels of expenditure or higher index values. Lighter shades of colour represent lower levels of expenditure or a lower index value. Please refer to the scale for each individual map to see the highest and lowest values for that version.
Maps showing total identifiable expenditure per head
For maps showing total identifiable expenditure per head, there is no scale set for the map. For example, the lowest point of the scale will be set to the value of the region with the lowest spend per head, and the highest point of the scale will be set to the value of the region with the highest spend per head.
Maps by function
The maps by function included within the main text show the indexed spend per head. Maps by function/subfunction have only been included where the total UK identifiable spend accounted for over 2% of the UK total identifiable expenditure per head for the latest year of the CRA release.
As at November 2022, the index scale is set from 50 to 150 to represent an equal spread of values and their distribution from the total UK index value of 100. There may be some cases where expenditure may exceed or fall below the highest or lowest point of the index scale, which would mean any values above 150 would appear as the same colour. For example, an index value of 151 and 250 would appear on the map in the same shade of blue. For transparency and usability of the maps, the data values for the highest and lowest index value of each region have been pinpointed for each functional map.
Data tables
In the main CRA release, the “A” tables show functional spending by Scotland, Wales, Northern Ireland and the English regions. The “B” tables show spending by sub-function (with the exception of B.9 and B.10 that show spending for English regions by sub-function for the latest outturn year). Each CRA publication includes a selection of tables for the purposes of providing a data summary.
A tables
- Table A.1a shows identifiable public sector expenditure on services by Scotland, Wales, Northern Ireland and the English regions. This spending is also shown in Table A.1b on a per head basis, Table A.2a in real terms and Table A.2b in real terms on a per head basis.
- Tables A.3a shows identifiable public sector expenditure on services by Scotland, Wales, Northern Ireland and the English regions with a breakdown for capital and current expenditure. This spending is shown in Table A.3b on a per head basis, Table A.4a in real terms and Table A.4b in real terms on a per head basis.
- Tables A.5 to A.14 each focus on a particular function, showing current, capital and total public sector expenditure by Scotland, Wales, Northern Ireland and the English regions.
- Table A.15 shows identifiable public sector spending by function, Scotland, Wales, Northern Ireland and the English regions on a per head basis. Table A.16 shows this spending as percentages of the UK total.
- Tables A.17 to A.20 provide a sector breakdown of Tables A.1a and A.1b. Table A.17 shows the allocations of local government expenditure, and Table A.18 shows this on a per head basis. Tables A.19 and A.20 show the equivalent presentations for total expenditure on services excluding local government spending.
- For Scotland, Wales and Northern Ireland, Table A.21 shows the relative contributions of the devolved administrations, Whitehall departments and local government under each functional heading. This table covers the latest outturn year only.
B tables
- Tables B.1 to B.4 present total identifiable expenditure on services by sub-function for the UK.
- Tables B.5 to B.8 present total identifiable expenditure on services by sub-function per head for the UK.
- Table B.9 shows English regional spending by sub-function for the latest outturn year. Table B.10 shows English regional spending by sub-function on a per head basis for the latest outturn year.
Data analysis tools
As well as the CRA Release document, the Treasury will publish further analysis tools in the form of interactive tables and a CRA database on GOV.UK. These tools will allow users to choose how they view CRA data. For example, it should be possible to view information in Table A.21 or for Table B.9 for earlier years.
The interactive tables include all the information available from the CRA dataset with the exception of underlying CRA segments. There are two interactive table sheets;
- a sheet labelled Accruals £’000 that shows nominal expenditure figures
- a sheet labelled Accruals, £’000 real terms that show nominal figures adjusted to 2021-22 prices
An accompanying Metadata sheet is also included.
The data underlying the CRA is published in the form of a database consisting of over 20,000 rows of data. To supplement this database, a Pivot Table sheet is included that has similar functionality to the interactive tables, with the added capability of being able to drill down to segment level. A Metadata sheet is also included.
Methods
Background: How public expenditure is planned and controlled
Public expenditure is planned and controlled on a departmental basis, except where devolved responsibility lies with the Scottish Government, Welsh Government, Northern Ireland Executive or with local government. This means that in several areas expenditure is planned on a UK-wide or GB-wide basis rather than by reference to a single region. The Country and Regional Analysis (CRA) exercise is a statistical analysis. It plays no direct part in resource allocation.
The process of appointing expenditure
In order to provide information on the allocation of expenditure split by Scotland, Wales, Northern Ireland and the English regions, the Treasury asks UK government departments and devolved administrations to undertake an annual statistical exercise. This is based on expenditure data published in July each year in HM Treasury’s Public Spending Statistics release.
- The exercise is based on spending by the Devolved Administration and the subset of departmental spending that can be identified as benefiting the population of individual regions. It asks departments and Devolved Administrations to apportion that spending between countries and regions following guidance issued by the Treasury.
- The Treasury then collates departments’ returns and combines these with the known spending of local government to produce the analyses of public expenditure by Scotland, Wales, Northern Ireland and the English regions that are published in this release.
The CRA includes a wider coverage of expenditure for Scotland, Wales and Northern Ireland than that for which the devolved administrations and the Secretaries of State for Scotland, Wales and Northern Ireland are directly responsible.
As mentioned above, a background methodology note accompanies this release. It provides users with more information on the methods used to allocate spend between Scotland, Wales, Northern Ireland and the English regions. Further information can be found in the methodology section below.
Identifiable expenditure on services
The CRA analyses are set within the overall total expenditure on services (TES) framework, which broadly represents total current and capital spending of the public sector. As such, it is similar to the National Accounts measure of Total Managed Expenditure (TME). The main difference from TME is that expenditure on services does not include general government capital consumption (depreciation) and does not reverse the deduction of certain VAT refunds in departments’ budget-based expenditure data. See Annex E in PESA 2022 for further information on the TES framework.
For the CRA analyses, expenditure on services is divided into identifiable and non-identifiable expenditure:
- Around 86 per cent of public sector expenditure on services is identifiable expenditure, which has been incurred for the benefit of individuals, enterprises or communities within particular regions. Examples are health, education, and social protection spending;
- Non-identifiable expenditure, constituting the remaining 14 per cent of total public sector expenditure on services, is deemed to be incurred on behalf of the United Kingdom as a whole. Examples include the majority of expenditure on defence, overseas representation, tax collection and debt interest.
Where precise accounting data on the recipients’ locations are not available, allocation is based on other available information, following rules set down in the Treasury’s guidance for departments. For example, administration costs incurred centrally in support of regional spending are attributed to regions in the same proportions as the spending that they support. In other cases, departments approximate regional benefits where the immediate beneficiaries’ head office locations mask the final recipients’ locations.
Expenditure financed by EU receipts can be classified as identifiable or non-identifiable depending on the characteristics of the expenditure itself. Receipts from the EU are treated as non-identifiable within TES. Consequently, regional expenditure includes the expenditure financed by EU receipts. Payments to the EU are attributed to ‘outside UK’ as these are transfer payments that the EU then spends. In 2018-19 and 2019-20 departments and devolved administrations were provided with funding for the purpose of EU Exit preparation. Although it is not possible to identify this expenditure separately in any of the tables or data published in the CRA, it is included within the spending aggregates. The amounts allocated to individual departments have been published elsewhere[footnote 2]. Following the UK’s withdrawal from the EU, European Union Financial Settlement payments and receipts are also treated as ‘Outside UK’ within the CRA.
How identifiable expenditure is attributed to Scotland, Wales, Northern Ireland and the English regions
Identifiable expenditure is attributed to a specific area using the ‘for’ basis wherever possible, which records the regions that benefited from the spending or whom the spending was for, rather than simply the location where the spending took place (the ‘in’ basis). Where it is not possible to allocate spending to regions on a ‘for’ basis, the ‘in’ basis is used instead. For most spending, the ‘for’ and the ‘in’ bases would in practice offer the same result.
A number of issues can be identified that limit the ability to offer a complete picture of ‘who benefits?’:
- practical difficulties: for example, schools are not used solely by the residents of the region in which they are located. Definitional and border problems become increasingly significant the smaller the geographical unit considered;
- conceptual problems: for example, agricultural support is treated as benefiting the farmers who receive subsidies, rather than the final consumers of food; and
- data collection issues: departments are encouraged, but not required, to allocate spending on the basis of ‘who benefits?’. If spending is not significant (less than £20 million annually on capital or current) or relevant information for allocating it to regions is not available, departments may use some statistical proxy instead. This might include using straight population shares, or the same allocation proportions as other related spending. It is neither considered practical nor cost-effective to collect local government spending data on the basis of ‘who benefits?’. Instead, local government spending is assumed to benefit the area of the spending authority.
Data on public expenditure
The tables in this release present the spending attributed to the English regions alongside that attributed to Scotland, Wales and Northern Ireland. Although the figures are comparable, care is still needed when making cross-national comparisons because of the different scope of public sector activities in different countries. For example, water supply is a public sector function in Scotland and Northern Ireland, but is in the private sector in England and Wales.
The data cover central government, local government and public corporations. Data inconsistencies between the CRA and spending tables in the July 2022 Public Spending Statistics publication reflect further updates that have been made by departments and local authorities since the CRA data collection exercise.
Information on local government spending in the CRA is based on data supplied by the Department for Levelling Up, Housing and Communities (DLUHC) and the Department for Work and Pensions (DWP), as well as the devolved administrations. English local government spending is attributed to regions by the Treasury using information supplied by DLUHC.
Methodology
Accompanying this release is a spreadsheet which sets out the methods which have been used to assign spending to Scotland, Wales, Northern Ireland and the English regions. All segments with expenditure (or income) of £10 million or more in 2021-22 have been included. This covers over 99% of identifiable expenditure in that year. This should increase transparency for users and provide a basis going forward for departments and HM Treasury to monitor and improve the methodologies being used.
Where mention is made of allocations carried out by HM Treasury “using statistical methodologies”, this largely refers to:
- allocating segments with smaller amounts of spending using the regional splits of larger spending segments already submitted by departments. For this process, smaller segments are matched to larger segments with similar attributes (CAP/CUR and subfunction).
- where appropriate, smaller segments are also split using mid-year population estimates
Data quality
The CRA is intended to give a broad picture of relative spending for the benefit of different regions. Small differences in regional spending should not be treated as significant.
A number of users have expressed a desire for lower-level geographical data in our releases (at the local authority level, or even at the postcode level). However, government bodies do not generally monitor or control their spending on a geographical basis. This is especially the case for central government expenditure. As a result, publication of spending at a lower level of detail using central systems is not currently possible. In order not to overstate the accuracy of the figures provided, numbers in the CRA are rounded to the nearest £1 million. The CRA will be subject to imprecision because:
- the concept of ‘who benefits?’ is open to interpretation;
- simplifying assumptions are made in order to reduce the reporting burden for government bodies;
- the robustness of allocation methods varies according to the availability of data. Public service pension spending can be allocated on the basis of the postcodes of recipients, giving a very accurate regional allocation. Other apportionments require a higher degree of estimation;
- the Treasury asks the largest departments to allocate their spending to Scotland, Wales, Northern Ireland and the English regions, whereas spending for the remaining departments (de minimis) are pro-rated using the total expenditure of the larger departments.
Some of the steps that departments and the Treasury undertake to ensure that data are of sufficient quality to be used in the CRA include:
- the issuance of clear guidance by the Treasury to departments in order to obtain consistency where possible;
- meetings between departments and the Treasury to discuss methods of allocation; and
- considerable resources devoted by departments to the work, including the involvement of statisticians in preparing their returns to the Treasury. The return is signed off by a statistics Head of Profession, finance director, or a senior accountant in the department as being produced in accordance with the CRA guidance, and where applicable accompanied by a statement on data quality (see below).
In their accompanying statements on data quality some departments have identified areas of their CRA return where the methods used have changed from previous years, are provisional, or do not fully meet the methodology set out in the CRA guidance. Specific comments made by departments on data quality for CRA 2022 are:
Business, Energy and Industrial Strategy (BEIS)
- In past CRA exercises the segment: S084A222-RENEWABLE HEAT INCENTIVE which amounted to around £0.9bn in 2021-22, had been classified in subfunction: 4.8 R&D economic affairs. After reviewing this segment with BEIS, it has now been reclassified to subfunction: 4.3 Fuel and energy for all five years of outturn. *UK research and Innovation (UKRI) is an umbrella body for several research councils as well as for Innovate UK and for Research England. In recent years UKRI have started publishing country and region splits of their expenditure. For this year’s CRA these published splits have been used to produce country and regional breakdowns for Innovate UK (£1.0bn in 2021/22) and for Research England (£2.6bn in 2021-22).
Work and Pensions (DWP)
- In 2021-22 the Kickstart scheme came into the CRA amounting to around £0.9bn. As a source for a regional breakdown DWP have pointed us to country and regional analysis of number of jobs started under Kickstart, that was attached to a written ministerial answer from earlier in the year. This was used to produce a breakdown of Kickstart.
HM Revenue and Customs (HMRC)
- There are two HMRC segments relating to corporations’ R&D tax credits. S041A023-SMALL COMPANIES R&D and S041A032-R&D TAX CREDITS: ABOVE THE LINE amounting to a combined £10.7bn in 2021-22. In prior years these have been apportioned using regional GDP, however this year, the apportionment has been produced using published HMRC country and regional data on R&D tax credits.
Non-identifiable
Non-identifiable expenditure, which is deemed to be incurred on behalf of the United Kingdom as a whole, makes up around 14 per cent of total public sector expenditure on services. The main elements are:
- Public sector debt interest payments;
- Defence spending by the Ministry of Defence (MoD) and the Security and Intelligence Agencies. Expenditure by the MoD which is not classed as part of the defence function (e.g. war pension benefits and military museums) is included within identifiable expenditure;
- Receipts from the European Union (see page 8 above for treatment of spending financed by EU receipts);
- Expenditure by the BBC (classified as part of the Central Government sector by the Office for National Statistics);
- Expenditure on tax collection by HM Revenue & Customs;
- Home Office expenditure on UK border and migration policy and the Passport Office; and
- Expenditure by the Foreign and Commonwealth Office (FCO) on UK representation overseas
In CRA 2022 no new significant areas of spend have been classified as non-identifiable. Historically, spending on the 2012 London Olympics were treated as mix of identifiable and non-identifiable expenditure:
- prior to the 2012 edition of the CRA all expenditure on the Olympics was classified as non-identifiable and was entirely within the ‘Recreation, Culture and Religion’ function;
- from 2012, following detailed analysis of available data, infrastructure related spending was treated as identifiable and was allocated to London. In addition, some expenditure was reclassified to other functions such as economic affairs, transport and housing as appropriate. Olympic spending which was not on infrastructure (e.g. running costs) continued to be treated as non-identifiable.
Spending related to the 2022 Commonwealth Games, that was held in Birmingham is being treated as identifiable spend assigned to the West Midlands. We will keep the treatment under review and update future releases if there are any changes.
Funding of public spending
This release focusses on Public Sector spending however more information on the regional breakdown of public sector receipts can be found in the ONS’s Country and Regional Public Sector Finances release as well as the local government publications released by DLUHC and the devolved governments. Links to these can be found at the end of this guidance. These releases will give information on various Central Government taxes, such as income tax or VAT and also local government level receipts such as council tax and non-domestic rates.
We welcome any further feedback or comments on the release which can be sent in by emailing pesa@HMTreasury.gov.uk.
Related financial data
The July Public Spending Statistics (PSS) release is the main source of comprehensive outturn and historical spending data in the UK. A link to the July 2022 PSS covering outturn periods 2017-18 to 2021-22 can be found here: https://www.gov.uk/government/statistics/public-spending-statistics-release-july-2022
The July PSS dataset is updated periodically through the year; firstly in November and then in the following year, in February and finally in May. A full list of PSS publications can be found here: https://www.gov.uk/government/collections/national-statistics-release
There are a number of related government data releases and publications which draw on the same sources used to produce the PSS. These include:
- Public sector finances (PSF) are produced each month, based partly on the in-year spending data submitted by departments on OSCAR.
- Country and Regional Public Sector Finances provide a breakdown of public sector revenue, expenditure and net fiscal balance on a country and regional basis. The expenditure breakdown is based on data from the CRA.
- The National Accounts public spending data in the National Accounts are sourced from OSCAR, including the functional breakdown of spending maintained by Treasury.
- Government expenditure and revenue in Scotland (GERS) provides a set of public sector accounts for Scotland through detailed analysis of official UK and Scottish Government finance statistics. One of the primary sources for GERS is the country and regional analyses produced by HM Treasury.
- The Main supply estimates and supplementary estimates refer to the various points throughout the financial year where departments need to submit estimates of their spending for the coming year to parliament for approval. Data are sourced from OSCAR and published online.
- The Whole of Government Accounts (WGA) are a full, consolidated set of accounts for the whole of the public sector. Details of the underlying data used to produce the WGA are published as part of the OSCAR transparency releases.
- The Block grant transparency is a breakdown that sets out how the block grants for the Scottish Government, Welsh Government and Northern Ireland Executive are calculated.
Local government data
Local government expenditure shown in PESA and PSS is based on revenue (current) and capital data collections completed by local authorities and sent to the Department for Levelling Up, Housing and Communities (DLUHC) and the devolved administrations.
England – Department for Levelling Up, Housing and Communities
- https://www.gov.uk/government/collections/local-authority-revenue-expenditure-and-financing
- https://www.gov.uk/government/collections/local-authority-capital-expenditure-receipts-and-financing
Scotland – Scottish Government
Wales – Welsh Government
Other statistics publications
A number of other departments publish analyses of their spending which may provide different levels of detail on spending programmes and geographies. A number of examples are shown below, but the list is not intended to be comprehensive:
- Department for Education (DfE) Statistics: local authority and school finance
- Department for Environment, Food and Rural Affairs (DEFRA) Flooding and Coastal Erosion Risk Management (FCERM). Please see the ‘Sources and other relevant publications’ section for further information and additional data.
- Department for Transport (DfT) Transport Statistics Great Britain
- Department for Work and Pensions (DWP) Benefit expenditure and caseload tables
- Ministry of Defence (MOD) regional expenditure with UK industry and supported employment
- NHS Digital - NHS Payments to General Practice