Council Tax: stock of properties statistical commentary
Updated 22 May 2026
Applies to England and Wales

© Crown copyright 2026
This publication is licensed under the terms of the Open Government Licence v3.0 except where otherwise stated. To view this licence, visit nationalarchives.gov.uk/doc/open-government-licence/version/3 or write to the Information Policy Team, The National Archives, Kew, London TW9 4DU, or email: psi@nationalarchives.gov.uk.
Where we have identified any third party copyright information you will need to obtain permission from the copyright holders concerned.
This publication is available at https://www.gov.uk/government/statistics/council-tax-stock-of-properties-2025/council-tax-stock-of-properties-statistical-commentary
This release includes statistics on the stock of domestic properties by Council Tax Band and property attributes in England and Wales as at 31 March 2025.
The release was first published in September 2025, containing key headline stock figures broken down by band for each Local Authority and Parliamentary Constituency. The release was updated in May 2026 to include further breakdowns by property attributes. Due to a minor methodological change, there are slight differences in the figures within those tables published in September 2025 and those published in May 2026. For more details on the updates in this release, please refer to the background information.
Responsible Statistician
Anna McReady
Statistical enquiries
Date of next publication
Summer 2026
1. Headline facts and figures – 1 April 2024 to 31 March 2025
- There were 27.2 million properties on the Council Tax list as at 31 March 2025, up from 27.0 million as at 31 March 2024.
- In England, the most frequent council tax band was Band A: 6.1 million properties, or 23.7% of all properties, are Band A.
- In Wales, the most frequent council tax band was Band C: 0.3 million properties, or 21.8% of all properties, are Band C.
2. About these statistics
The statistics in this publication relate to England and Wales only. Property valuations are not carried out by the Valuation Office in Scotland and Northern Ireland, where the valuation law and practice differ from England and Wales.
The statistics are available at national, regional and billing authority level. Some tables are also available at Westminster Parliamentary Constituency level, middle layer super output area (MSOA), lower layer super output area level (LSOA) and local authority level.
This publication is released in support of bringing greater transparency to Valuation Office functions. The data are also used to inform government policy and conduct analyses to support the operations of the Valuation Office.
3. Distribution of Council Tax bands
3.1 Properties by Council Tax band and country, 31 March 2025
Figure 1.1: The number of properties by Council Tax band in England, 31 March 2025
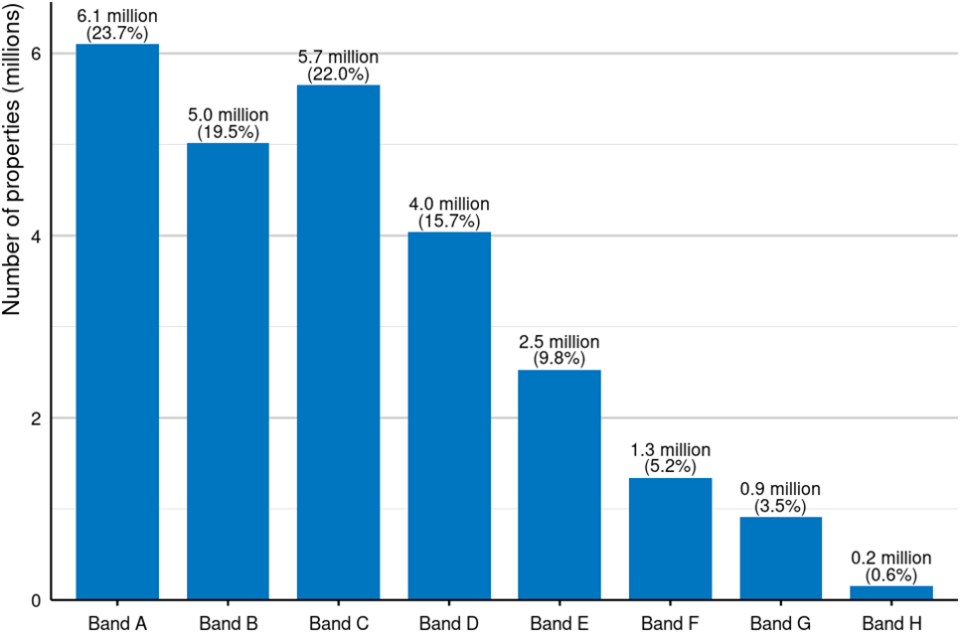
Source: Table CTSOP1.0
Figure notes: Counts are rounded to the nearest hundred thousand. Percentages are rounded to one decimal place.
Figure 1.2: The number of properties by Council Tax band in Wales, 31 March 2025
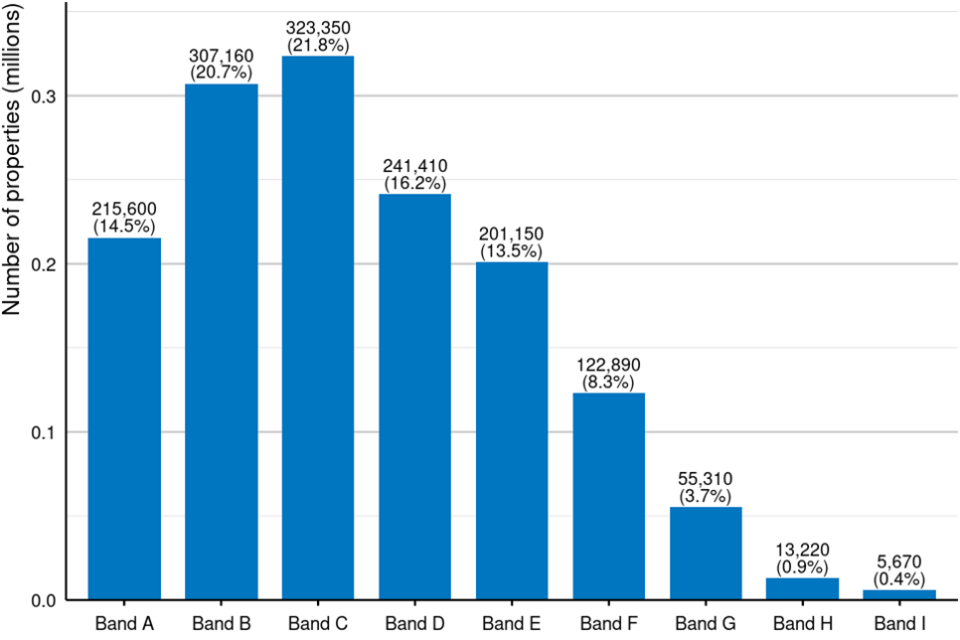
Source: Table CTSOP1.0
Figure notes: Counts are rounded to the nearest ten. Percentages are rounded to one decimal place. Note that Council Tax policy is devolved in Wales and the banding systems are different in England and Wales. For example, band I is only used in Wales and the valuation bands and valuation dates are different. For details please see the background information.
Figures 1.1 and 1.2 show the number of properties by Council Tax band in England and Wales as at 31 March 2025:
- in England, the highest number of properties were in Council Tax band A (6.1 million properties, or 23.7% of the total stock in England), followed by band C (5.7 million, 22.0%)
- in Wales, the highest number of properties were in Council Tax band C (323,360 properties, or 21.8% of the total stock in Wales), followed by band B (307,160, 20.7%)
- in both countries, the highest band had the fewest properties, with 0.2 million (0.6%) properties in band H in England and 5,670 (0.4%) properties in band I in Wales
3.2 Properties by country and region, 31 March 2025
Figure 2: The number of properties by region in England and Wales, 31 March 2025
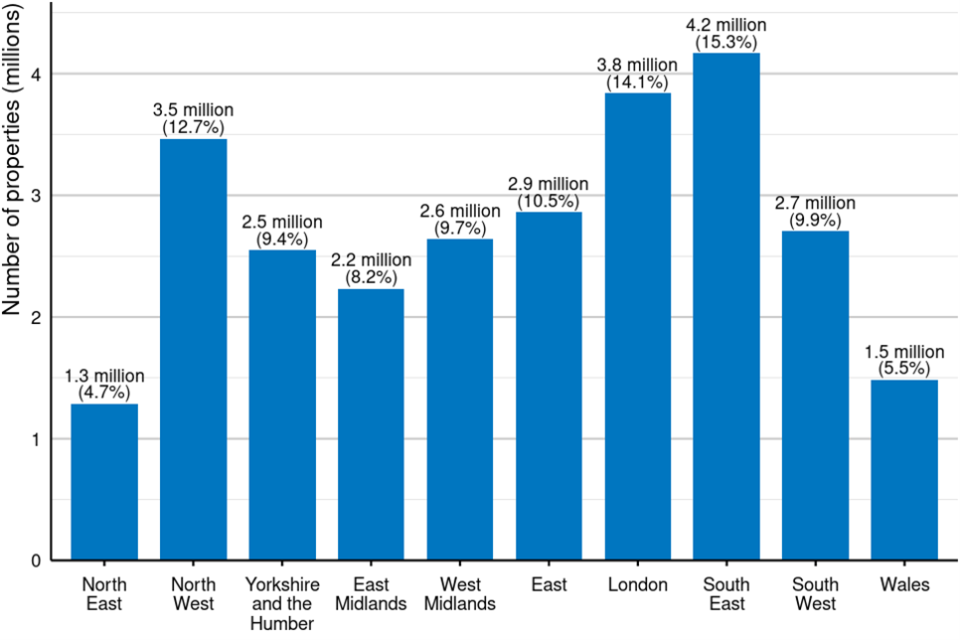
Source: Table CTSOP1.0
Figure notes: Counts are rounded to the nearest hundred thousand. Percentages are rounded to one decimal place.
Figure 2 shows the number of properties in each region of England and in Wales as at 31 March 2025:
- the South East had the highest number of properties (4.2 million properties, or 15.3% of the total stock), followed by London (3.8 million, 14.1%) and the North West (3.5 million, 12.7%)
- Wales (1.5 million, 5.5%) and the North East (1.3 million, 4.7%) had the fewest properties
3.3 Properties by Council Tax band, country and region, 31 March 2025
Figure 3: Properties by Council Tax band and region in England and Wales, 31 March 2025
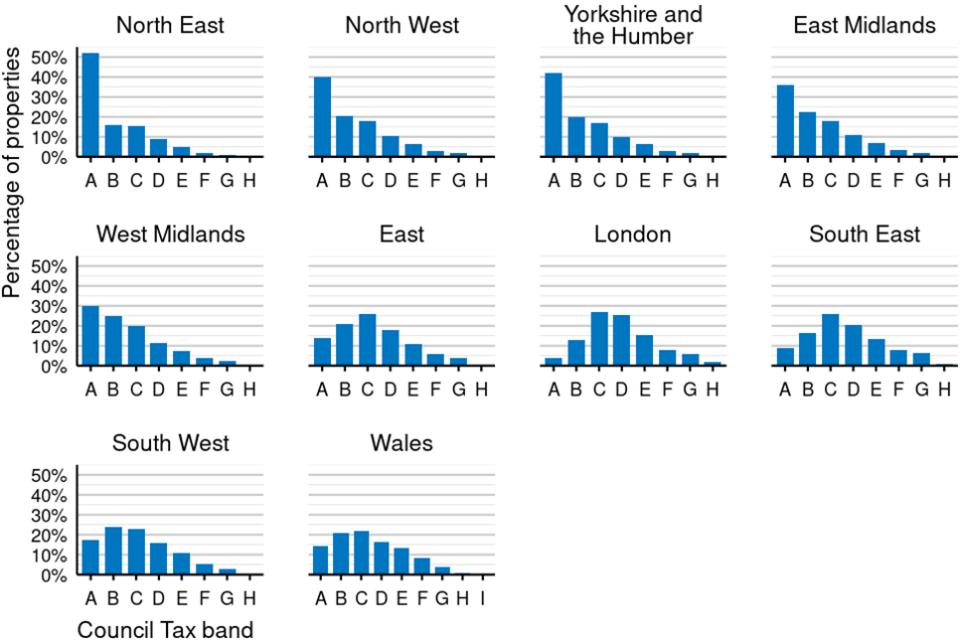
Source: Table CTSOP1.0
Figure note: Note that Council Tax policy is devolved in Wales and the banding systems are different in England and Wales. For example, band I is only used in Wales and the valuation bands and valuation dates are different. For details please see the background information.
Figure 3 shows the percentage of properties by Council Tax band in each region of England and in Wales as at 31 March 2025:
- in the North East, the North West, Yorkshire and the Humber, the East Midlands and the West Midlands, band A was the most frequent Council Tax band, containing between 30% and 52% of all properties
- in the South West, band B was the most frequent band, containing 24% of all properties
- in the East, London and the South East, band C was the most frequent band, containing between 26% and 27% of all properties
- in Wales, band C was the most frequent band, containing 22% of all properties
- in every region, the percentages of properties in each band gets smaller, the further that band is from the most frequent band
4. Distribution of property types and number of bedrooms
4.1 Properties by property type, 31 March 2025
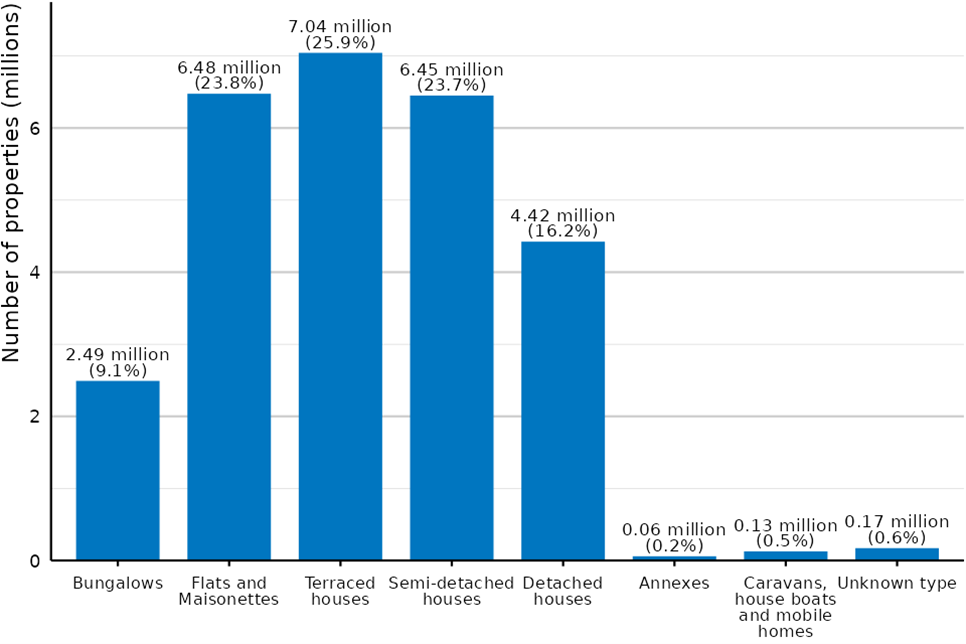
Figure 4: The number of properties by property type in England and Wales, 31 March 2025
Source: Table CTSOP3.0
Figure notes: Counts are rounded to the nearest ten thousand. Percentages are rounded to one decimal place.
Figure 4 shows the number of properties by property type in England and Wales at 31 March 2025:
- the most frequent property type was terraced houses (7.04 million properties, or 25.9% of the total stock), followed by flats/maisonettes (6.48 million, 23.8%) and semi-detached houses (6.45 million, 23.7%)
- the least frequent property type were caravans/house boats/mobile homes (0.13 million, 0.5%) and annexes (0.06 million, 0.2%)
- there were also 0.17 million (0.6%) properties where the property type was unknown
4.2 Properties by property type, country and region, 31 March 2025
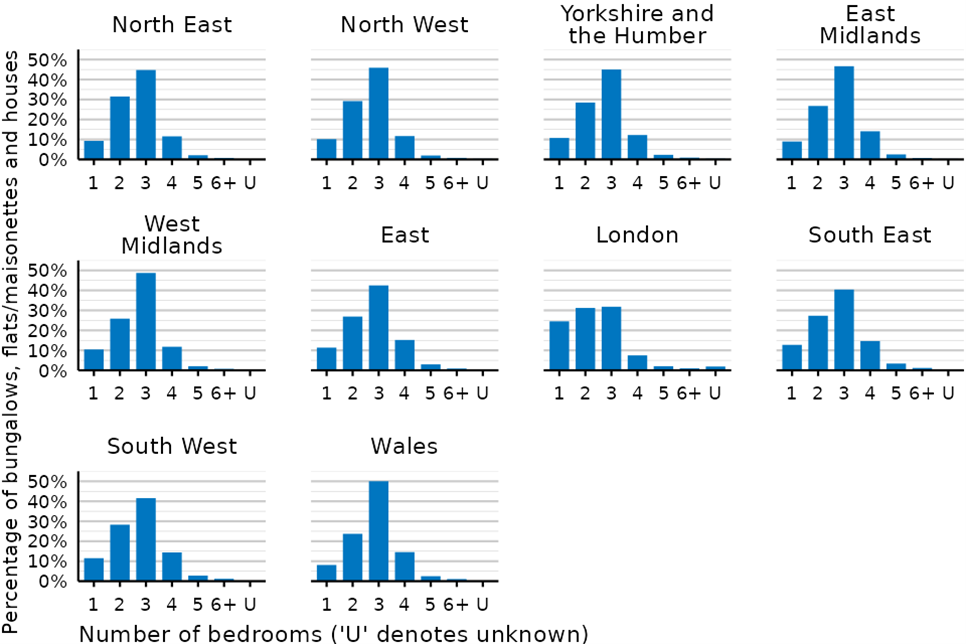
Figure 5.1: Bungalows, flats/maisonettes and houses by region and property type in England and Wales, 31 March 2025
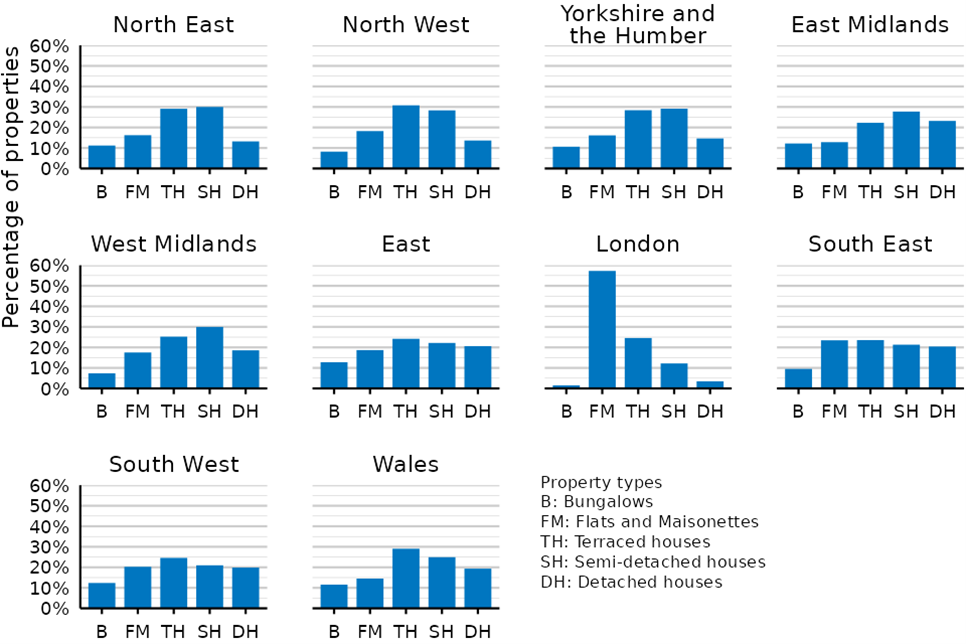
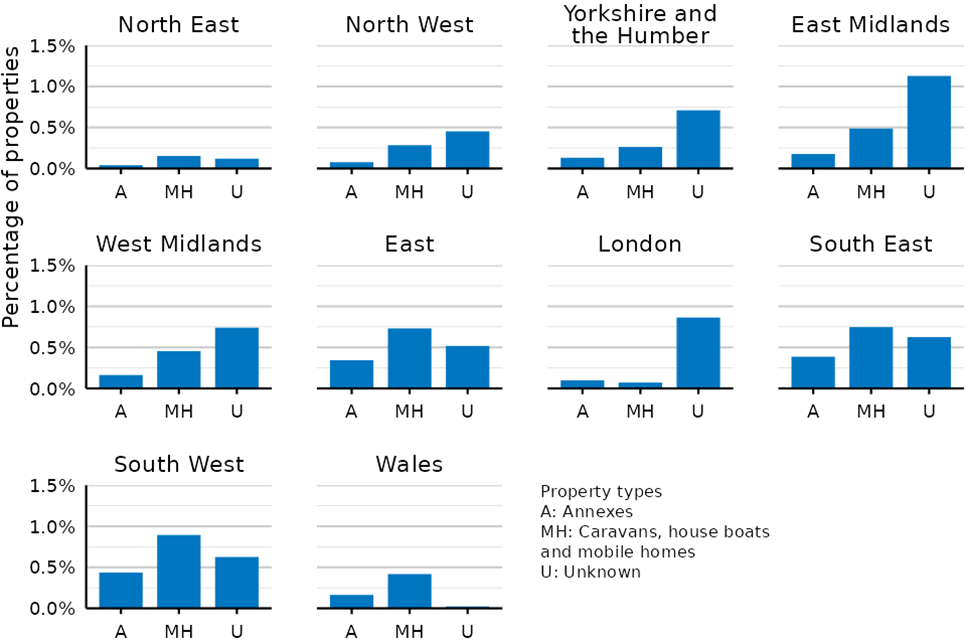
Figure 5.2: Annexes, caravans/house boats/mobile homes and properties with an unknown property type by region in England and Wales, 31 March 2025
Source: Table CTSOP3.0
Figures 5.1 and 5.2 show the percentage of properties by property type and region in England and Wales at 31 March 2025:
- in the North East, most of the properties were semi-detached houses (30%) or terraced houses (29%)
- in the North West, most of the properties were terraced houses (31%) or semi-detached houses (28%)
- in Yorkshire and the Humber, most of the properties were semi-detached houses (29%) or terraced houses (28%)
- in the East Midlands, most of the properties were semi-detached houses (28%) or detached houses (23%)
- in the West Midlands, most of the properties were semi-detached houses (30%) or terraced houses (25%)
- in the East, most of the properties were terraced houses (24%), semi-detached houses (22%) or detached houses (21%)
- in London, most of the properties were flats/maisonettes (57%)
- in the South East, most of the properties were terraced houses (24%), flats/maisonettes (23%) or semi-detached houses (21%)
- in the South West, most of the properties were terraced houses (25%), semi-detached houses (21%) or flats/maisonettes (20%)
- in Wales, most of the properties were terraced houses (29%) or semi-detached houses (25%)
- in all areas, annexes, caravans/house boats/mobile homes and properties with an unknown property type each made up between 0.02% and 1.13% of the total properties
4.3 Properties by property type and Council Tax band, 31 March 2025
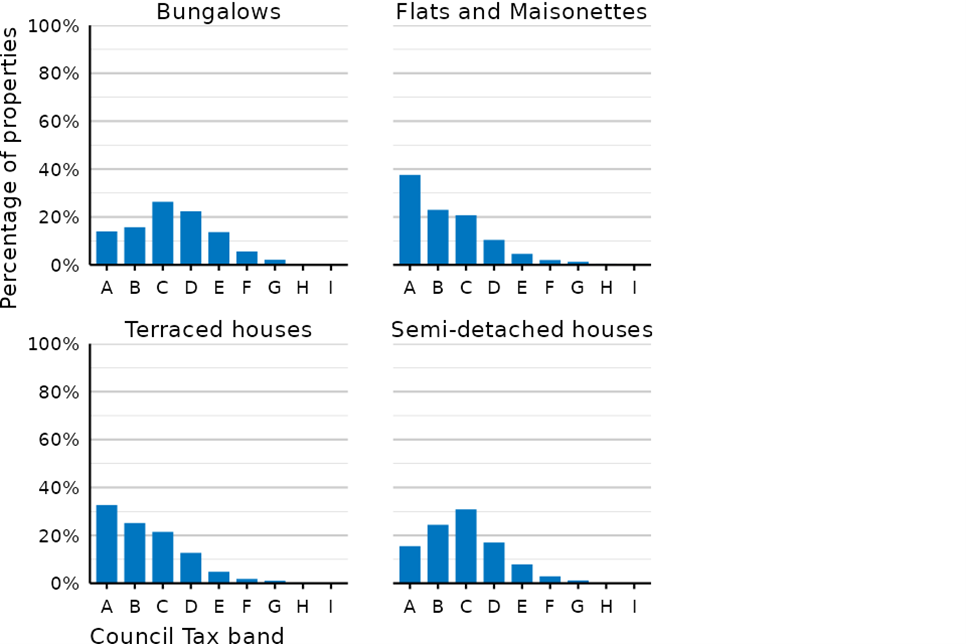
Figure 6: Properties by property type and Council Tax band in England and Wales, 31 March 2025
Source: Table CTSOP3.0
Figure note: Note that Council Tax policy is devolved in Wales and the banding systems are different in England and Wales. For example, band I is only used in Wales and the valuation bands and valuation dates are different. For details please see the background information.
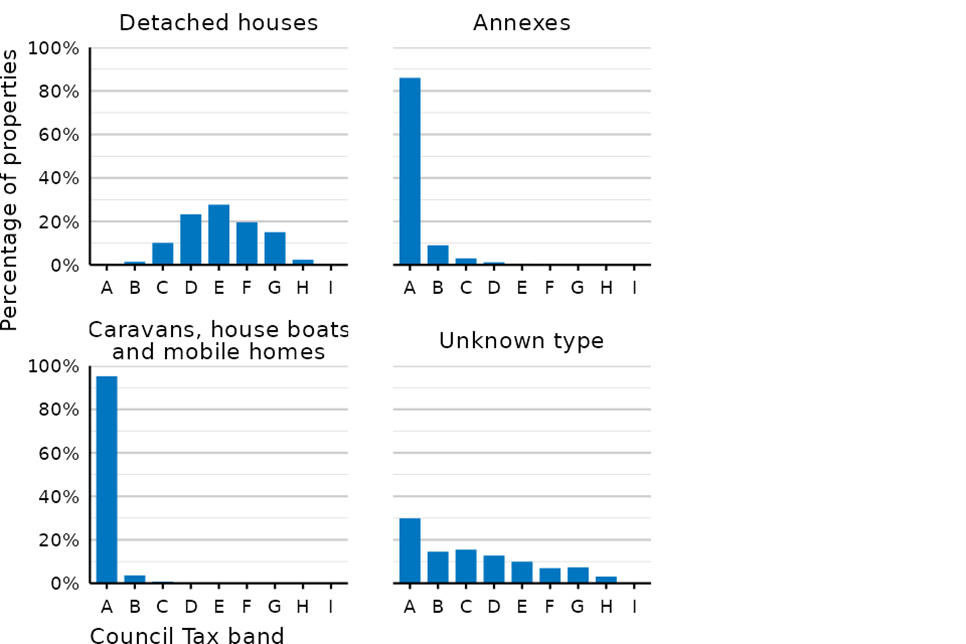
Figure 6 shows the percentage of properties by property type and Council Tax band in England and Wales at 31 March 2025:
- Band C was the most frequent Council Tax band for bungalows (26% of all properties), and semi-detached houses (31%)
- Band A was the most frequent Council Tax band for flats/maisonettes (38%), terraced houses (33%), annexes (86%) and caravans/house boats/mobile homes (95%)
- Band E was the most frequent Council Tax band for detached houses (28%)
- Of the properties with an unknown property type, band A was the most frequent Council Tax band (30%)
- For all known property types, the percentage of properties in each band decreases as the band moves further from the most frequent band
4.4 Properties by number of bedrooms, 31 March 2025
In this release, the number of bedrooms in a property is only shown for some property types. These property types total 26.9 million and include:
- bungalows (2.5 million properties)
- flats and maisonettes (6.5 million properties)
- terraced houses (7.0 million properties)
- semi-detached houses (6.5 million properties)
- detached houses (4.4 million properties)
All information about the number of bedrooms in a property excludes annexes, caravans, house boats and mobile homes, and properties with an unknown property type. Together these total 0.4 million properties.
Figure 7: The number of bungalows, flats/maisonettes and houses by number of bedrooms in England and Wales, 31 March 2025
Source: Table CTSOP3.0
Figure note: Counts are rounded to the nearest hundred thousand.
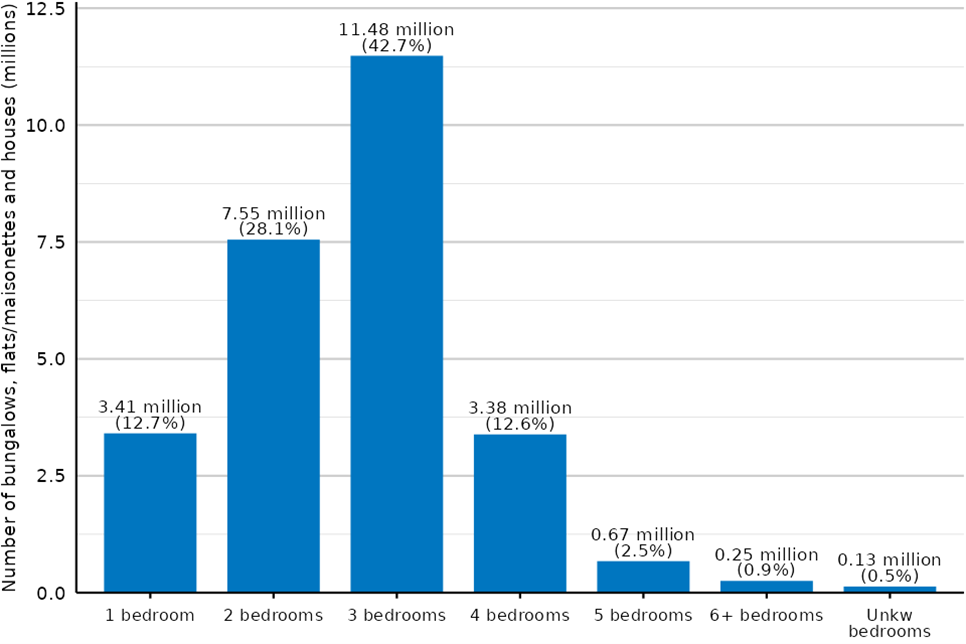
Figure 7 shows the number of bungalows, flats/maisonettes and houses in England and Wales by number of bedrooms at 31 March 2025. Of the 26.9 million bungalows, flats/maisonettes and houses:
- most had three bedrooms (11.48 million, 42.7%) or two bedrooms (7.55 million, 28.1%)
- the fewest had six or more bedrooms (0.25 million, 0.9%)
- there were 0.13 million (0.5%) which had an unknown number of bedrooms
4.5 Properties by property type and number of bedrooms, 31 March 2025
Figure 8: Bungalows, flats/maisonettes and houses by property type and number of bedrooms in England and Wales, 31 March 2025
Source: Table CTSOP3.0
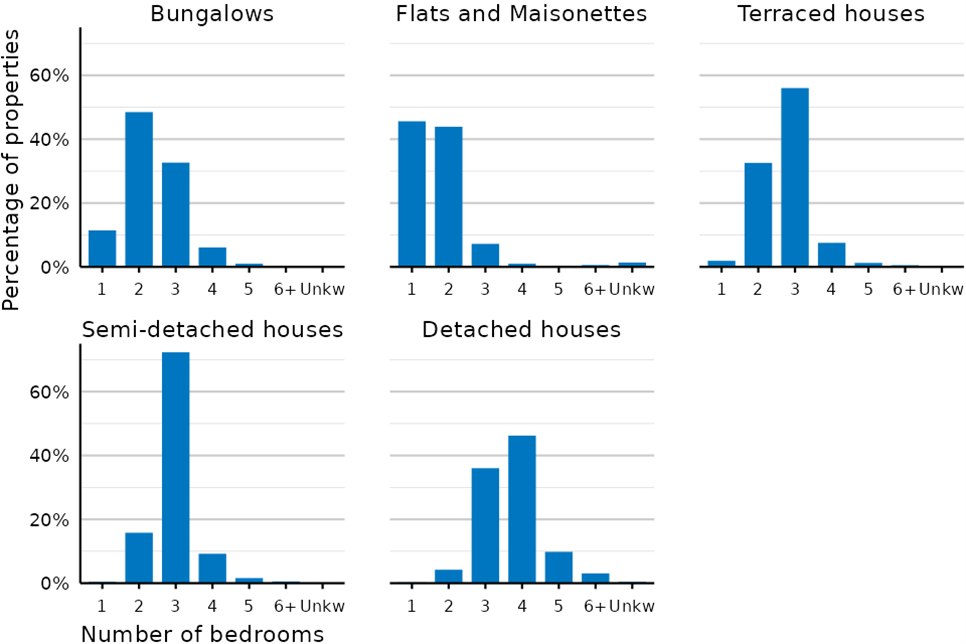
Figure 8 shows the percentage of bungalows, flats/maisonettes and houses by property type and number of bedrooms in England and Wales at 31 March 2025:
- bungalows most frequently contained two bedrooms (48%) or three bedrooms (33%)
- flats/maisonettes most frequently contained one bedroom (46%) or two bedrooms (44%)
- terraced houses most frequently contained three bedrooms (56%) or two bedrooms (33%)
- semi-detached houses most frequently contained three bedrooms (72%)
- detached houses most frequently contained four bedrooms (46%) or three bedrooms (36%)
4.6 Properties by number of bedrooms and Council Tax band, 31 March 2025
Figure 9: The number of bungalows, flats/maisonettes and houses by number of bedrooms and Council Tax band in England and Wales, 31 March 2025
Source: Table CTSOP3.0
Figure note: Note that Council Tax policy is devolved in Wales and the banding systems are different in England and Wales. For example, band I is only used in Wales and the valuation bands and valuation dates are different. For details please see the background information.
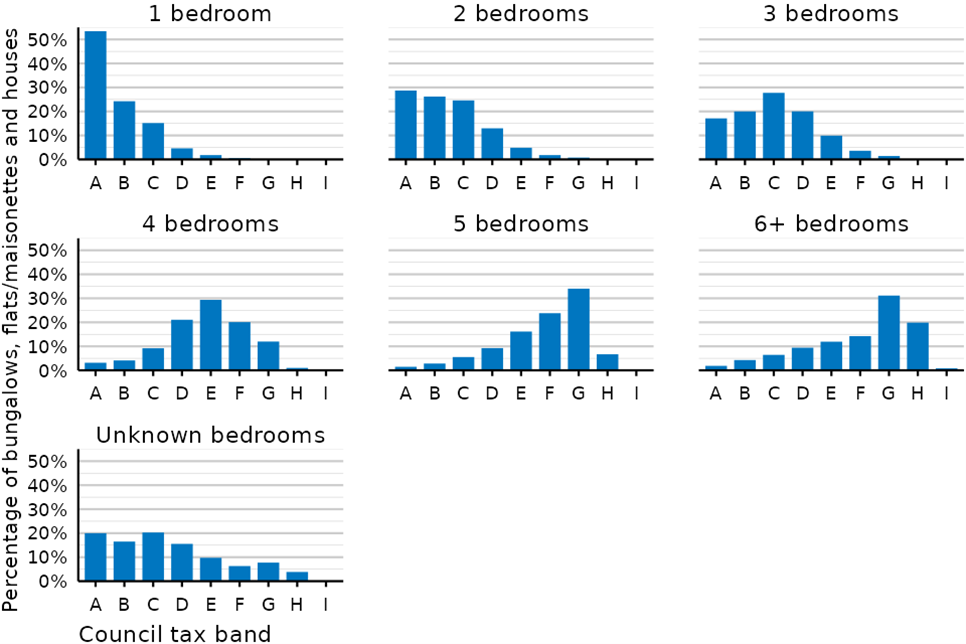
Figure 9 shows the percentage of bungalows, flats/maisonettes and houses by number of bedrooms and Council Tax band in England and Wales at 31 March 2025:
- the most frequent band was band A for one-bedroom properties (53% of one-bedroom properties) and two-bedroom properties (29% of two-bedroom properties)
- three-bedroom properties were most frequently in band C (28%)
- four-bedroom properties were most frequently in band E (29%)
- band G was the most frequent band for five-bedroom properties (34%) and properties with six bedrooms or more (31%)
- of the properties where the number of bedrooms was unknown, the bands were distributed in a similar pattern to the total number of properties in each band in England (Figure 1.1)
- for each number of bedrooms, the distribution of council tax bands had a single peak; bands further from that peak contained a progressively smaller proportion of properties
4.7 Properties by number of bedrooms, country and region, 31 March 2025
Figure 10: Bungalows, flats/maisonettes and houses by region and number of bedrooms in England and Wales, 31 March 2025
Source: Table CTSOP3.0
Figure 10 shows the percentage of bungalows, flats/maisonettes and houses by number of bedrooms and region in England and Wales at 31 March 2025:
- in all areas, most properties had three bedrooms; this ranged from 32% of the properties in London to 50% of the properties in Wales
- in London, 25% of properties had one bedroom; in all other areas this figure ranged from 8% to 13%
5. Properties by build period
For properties built prior to 2009, the Valuation Office records the ‘build period’ of properties rather than the exact year built. Properties built between 2022 and 2024 were previously grouped together in the same ‘build period’; they have now been separated out according to individual build years. Statistics on properties by build period have been created for comparison purposes only and are not a representation of the number of properties built in a year; therefore, these figures should not be compared with the housing supply statistics that are published by MHCLG.
The number of properties in the list with a build period prior to the 2024 to 2025 financial year has increased for some build periods. This can happen for a number of reasons. For example:
- a non-domestic property, such as a pub or a barn, may have been renovated into a house; if the reconstruction work was not extensive, then the original build date of the property is used for the build period of the new house
- a house may have been converted into flats; where the style of the property has not changed, the build period of the old house will be used for the new flats
In addition, the Valuation Office is continually working to improve the accuracy of the Council Tax Valuation Lists, therefore, a property which was previously recorded as having an unknown build period may have had this information added between 1 April 2024 and 31 March 2025.
The number of properties in the list with a build period prior to the 2024 to 2025 financial year has decreased for some build periods. This may happen for a number of reasons. For example:
- if a property is completely rebuilt, or is converted in such a way that the style of the property has changed, the old property will be deleted from the list and a new property will be added; the build period will be derived from the date at which the work on the new property was completed
- a property will be deleted from the lists if it has been demolished
- if works are being carried out on the property, it may be temporarily removed from the lists due to being in a state of disrepair
- a property may have been converted into a business, such as a shop or a holiday home; in this case, it will be transferred to the non-domestic rating list
5.1 Properties by build period and Council Tax band, 31 March 2025
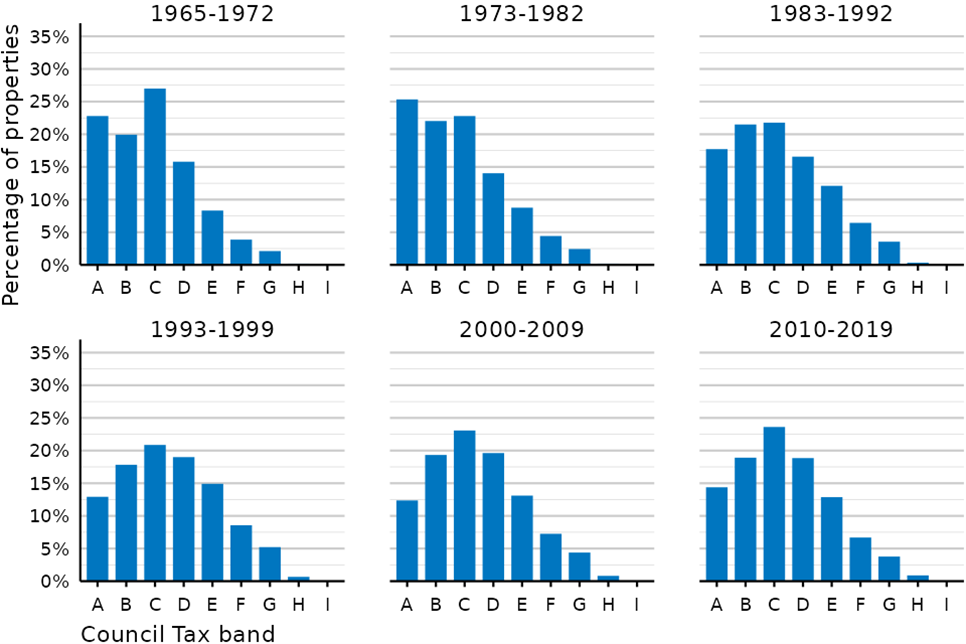
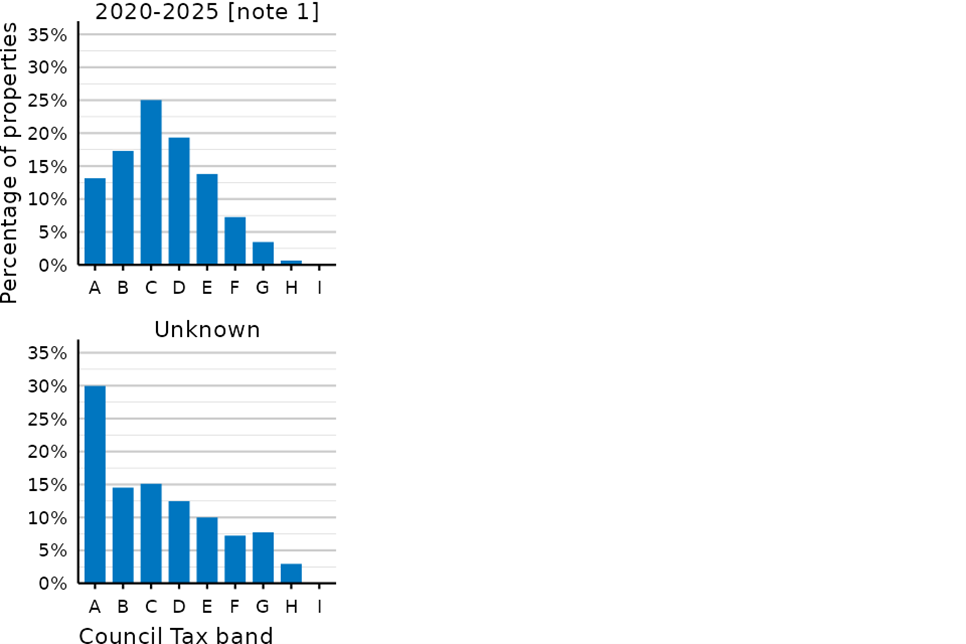
Figure 11: Properties by build period and Council Tax band in England and Wales, 31 March 2025
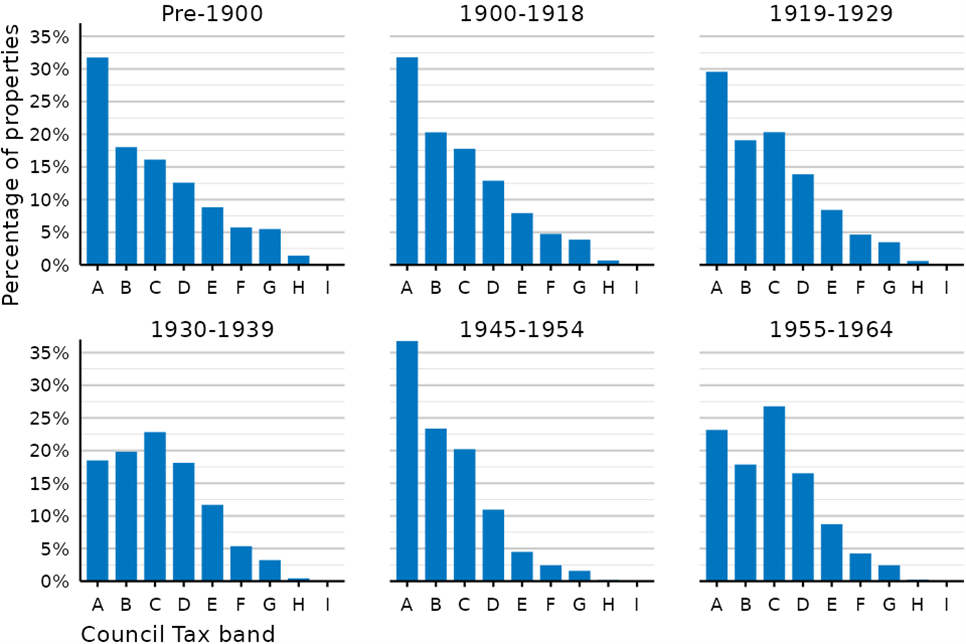
Source: Table CTSOP4.0
Figure notes: Note that Council Tax policy is devolved in Wales and the banding systems are different in England and Wales. For example, band I is only used in Wales and the valuation bands and valuation dates are different. For details please see the background information.
Note 1: These statistics only include properties in the Council Tax Valuation Lists as at 31 March 2025.
Figure 11 shows the percentage of properties by build period and Council Tax band in England and Wales at 31 March 2025:
- for properties with a build period of pre-1900, 1900-1918, 1919-1929, 1945-1954 and 1973-1982, band A was the most frequent Council Tax band, containing between 25% and 37% of all properties; for all of these build periods the percentage in each band tended to decrease as the band increased
- for properties with all other build periods, band C was the most frequent band, containing between 21% and 27% of all properties, and the percentage in each band tended to decrease as the band got further from band C
- of the properties where the build period was unknown, band A was the most frequent band, containing 30% of all properties, and the percentage in each band tended to decrease as the band increased
6. Further Information
Further information about the data and methodology presented in this commentary can be found in the background information.
As part of our improvement programme, if you’re interested in participating in user research about this statistical release, please contact us at statisticsvo@hmrc.gov.uk.
GOV.UK has more information on:
- how properties are assessed for Council Tax bands
- how to check your Council Tax band
- how to challenge your Council Tax band
Timings of future releases are regularly placed on the HMRC research and statistics calendar.
For further information on the geographical information used in this release please refer to the ONS Administrative Geography Guidance.
6.1 Housing statistics from other government departments
Office for National Statistics
Department for Levelling Up, Housing and Communities and Homes England (England)
Welsh Government (Wales)
Department for Communities (Northern Ireland)
Housing and Social Justice Directorate (Scotland)