Council Tax: stock of properties statistical commentary
Updated 21 September 2023

© Crown copyright 2023
This publication is licensed under the terms of the Open Government Licence v3.0 except where otherwise stated. To view this licence, visit nationalarchives.gov.uk/doc/open-government-licence/version/3 or write to the Information Policy Team, The National Archives, Kew, London TW9 4DU, or email: psi@nationalarchives.gov.uk.
Where we have identified any third party copyright information you will need to obtain permission from the copyright holders concerned.
This publication is available at https://www.gov.uk/government/statistics/council-tax-stock-of-properties-2023/council-tax-stock-of-properties-statistical-commentary
This release includes statistics on the stock of domestic properties by Council Tax Band and property attributes in England and Wales between 1 April 1993 and 31 March 2023.
Responsible Statistician
Sarah Windass
Statistical enquiries
Date of next publication
Spring 2024
1. Headline facts and figures – 1 April 2022 to 31 March 2023
1.1 The number of properties in England and Wales with a Council Tax band as at 31 March 2023:
The stock of properties at 31 March 2023 was
26.8 million
Up from 26.6 million at 31 March 2022
The largest group of properties by band
In England: 23.9% are Band A
Making up 6.1 million properties
The largest group of properties by band
In Wales: 21.8% are Band C
Making up 0.3 million properties
1.2 Properties inserted into and deleted from the Council Tax Valuation Lists in England and Wales between 1 April 2022 and 31 March 2023:
There were
291,710 properties inserted
into the Council Tax Valuation Lists in England and Wales, up from 284,900 in 2021 to 2022.
There were
44,400 properties deleted
from the Council Tax Valuation Lists in England and Wales, down from 44,500 in 2021 to 2022
2. About these statistics
The statistics in this publication relate to England and Wales only. Property valuations are not carried out by the Valuation Office Agency (VOA) in Scotland and Northern Ireland, where the valuation law and practice differ from England and Wales.
The statistics are available at national, regional and billing authority level. Some tables are also available at Westminster Parliamentary Constituency level, middle layer super output area (MSOA), lower layer super output area level (LSOA) and local authority level.
This publication is released in support of bringing greater transparency to VOA functions. The data are also used to inform government policy and conduct analyses to support the operations of the VOA.
3. Distribution of Council Tax bands
3.1 Properties by Council Tax band and country, 31 March 2023
Figure 1.1: The number of properties by Council Tax band in England, 31 March 2023
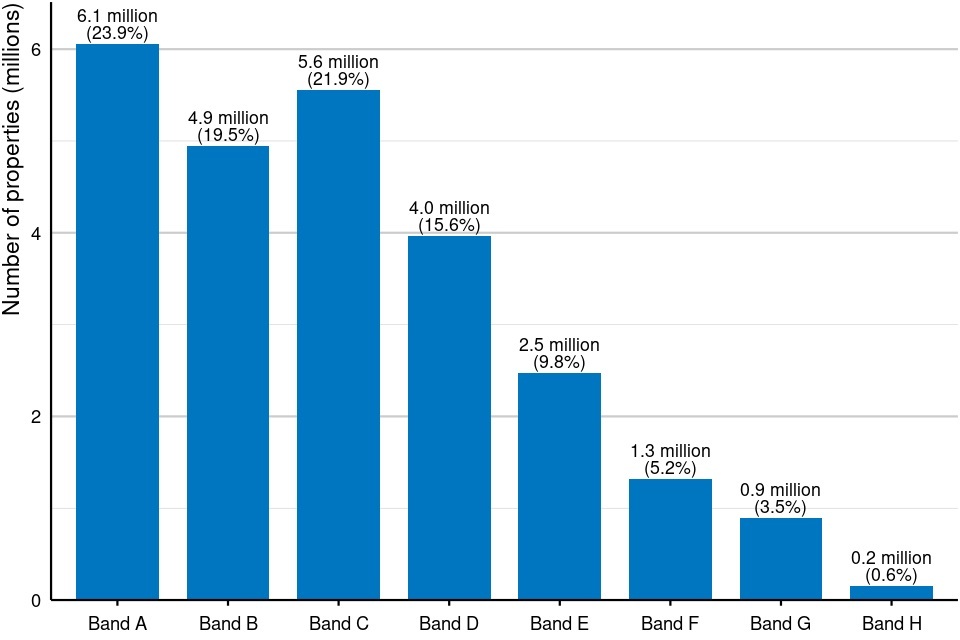
Source: Table CTSOP1.0
Figure notes: Counts are rounded to the nearest hundred thousand. Percentages are rounded to one decimal place.
Figure 1.2: The number of properties by Council Tax band in Wales, 31 March 2023
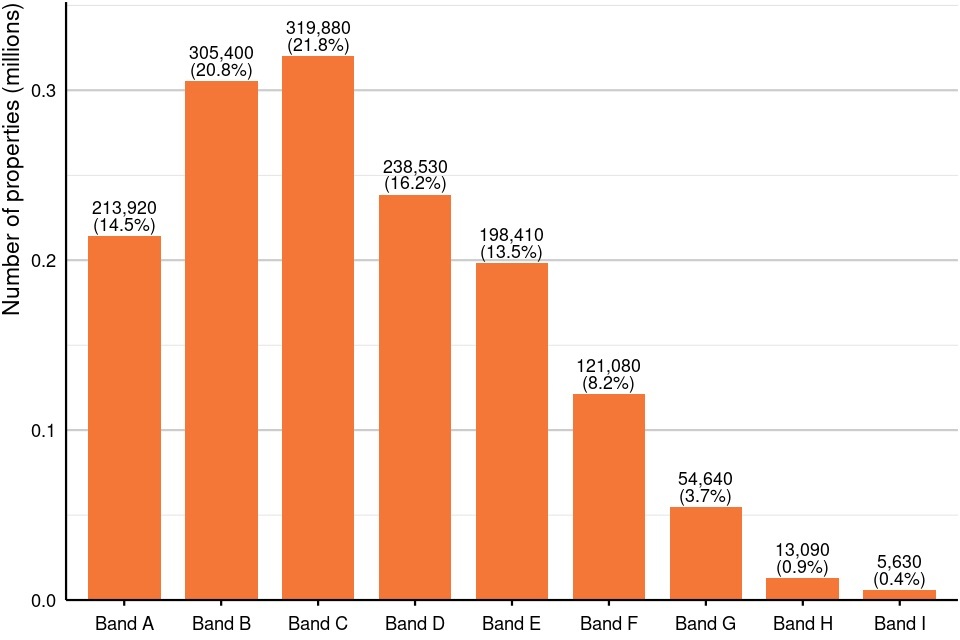
Source: Table CTSOP1.0
Figure notes: Counts are rounded to the nearest ten. Percentages are rounded to one decimal place.
Note that Council Tax policy is devolved in Wales and the banding systems are different in England and Wales. For example, band I is only used in Wales and the valuation bands and valuation dates are different. For details please see the background information.
Figures 1.1 and 1.2 show the number of properties by Council Tax band in England and Wales at 31 March 2023:
-
in England, the highest number of properties were in Council Tax band A (6.1 million properties, or 23.9% of the total stock in England), followed by band C (5.6 million, 21.9%)
-
in Wales, the highest number of properties were in Council Tax band C (319,880 properties, or 21.8% of the total stock in Wales), followed by band B (305,400, 20.8%)
-
in both countries, the highest band had the fewest properties, with 0.2 million (0.6%) properties in band H in England and 5,630 (0.4%) properties in band I in Wales
3.2 Properties by country and region, 31 March 2023
Figure 2: The number of properties by region in England and Wales, 31 March 2023
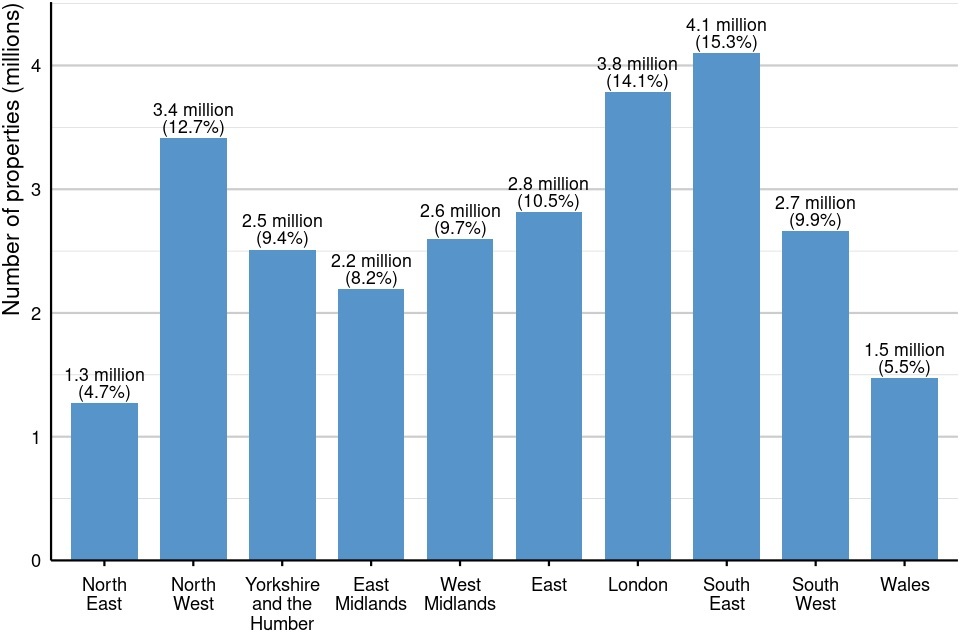
Source: Table CTSOP1.0
Figure notes: Counts are rounded to the nearest hundred thousand. Percentages are rounded to one decimal place.
Figure 2 shows the number of properties in each region of England and in Wales at 31 March 2023:
- the South East had the highest number of properties (4.1 million properties, or 15.3% of the total stock), followed by London (3.8 million, 14.1%) and the North West (3.4 million, 12.7%)
- Wales (1.5 million, 5.5%) and the North East (1.3 million, 4.7%) had the fewest properties
3.3 Properties by Council Tax band, country and region, 31 March 2023
Figure 3: Properties by Council Tax band and region in England and Wales, 31 March 2023
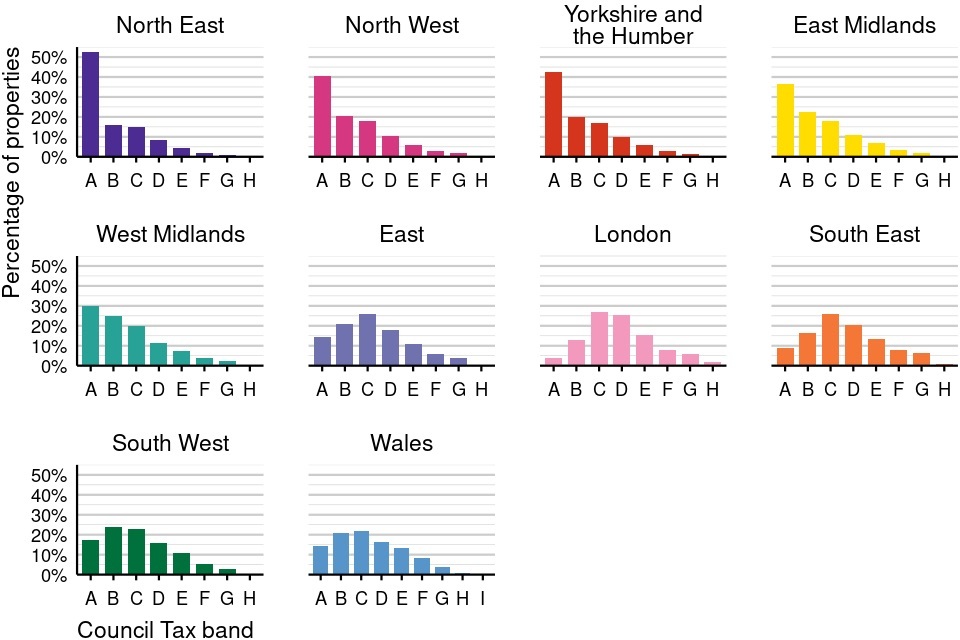
Source: Table CTSOP1.0
Figure note: Note that Council Tax policy is devolved in Wales and the banding systems are different in England and Wales. For example, band I is only used in Wales and the valuation bands and valuation dates are different. For details please see the background information.
Figure 3 shows the percentage of properties by Council Tax band in each region of England and in Wales at 31 March 2023:
- in the North East, the North West, Yorkshire and the Humber, the East Midlands and the West Midlands, most properties (between 30% and 52%) were in Council Tax band A, with the percentage of properties in each band decreasing as the band increased
- in the South West, most properties (24%) were in band B, with the percentage of properties in each band decreasing as the band got further from band B
- in the East, London and the South East, most properties (between 26% and 27%) were in band C, with the percentage of properties in each band decreasing as the band got further from band C
- in Wales, most properties (22%) were in band C, with the percentage of properties in each band decreasing as the band got further from band C
3.4 Properties by Council Tax band and country, 1 April 1993 to 31 March 2023
Figure 4.1: The number of properties by Council Tax band in England, 1 April 1993 to 31 March 2023

Source: Table CTSOP1.0
Figure note: Counts are rounded to the nearest hundred thousand.
Figure 4.1 shows the change over time in the number of properties in each Council Tax band in England since 1 April 1993. Between 1 April 1993 and 31 March 2023, the total number of properties in England increased from 20.1 million to 25.4 million.
Table 1: The number of properties by Council Tax band in England, 31 March 2022 and 31 March 2023
| Band | 31 March 2022 | 31 March 2023 | Difference | Percentage change |
|---|---|---|---|---|
| A | 6,024,400 | 6,058,380 | 33,980 | 0.6% |
| B | 4,905,580 | 4,945,460 | 39,880 | 0.8% |
| C | 5,495,720 | 5,552,210 | 56,490 | 1.0% |
| D | 3,914,680 | 3,961,510 | 46,840 | 1.2% |
| E | 2,442,270 | 2,473,900 | 31,630 | 1.3% |
| F | 1,296,480 | 1,314,530 | 18,060 | 1.4% |
| G | 885,860 | 896,300 | 10,440 | 1.2% |
| H | 149,160 | 151,230 | 2,060 | 1.4% |
| Total | 25,114,150 | 25,353,530 | 239,380 | 1.0% |
Source: Table CTSOP1.0
Table notes: Counts are rounded to the nearest ten. Percentages are rounded to one decimal place. Totals may not sum due to rounding.
Table 1 shows the change in the number of properties in each band in England between 31 March 2022 and 31 March 2023:
- the total number of properties in England increased by 1.0% between 31 March 2022 and 31 March 2023
-
the bands with the largest percentage change overall were band F, with a 1.4% increase in the number of properties, band H (1.4% increase) and band E (1.3% increase)
- the bands with the smallest percentage change were band B (0.8% increase) and band A (0.6% increase)
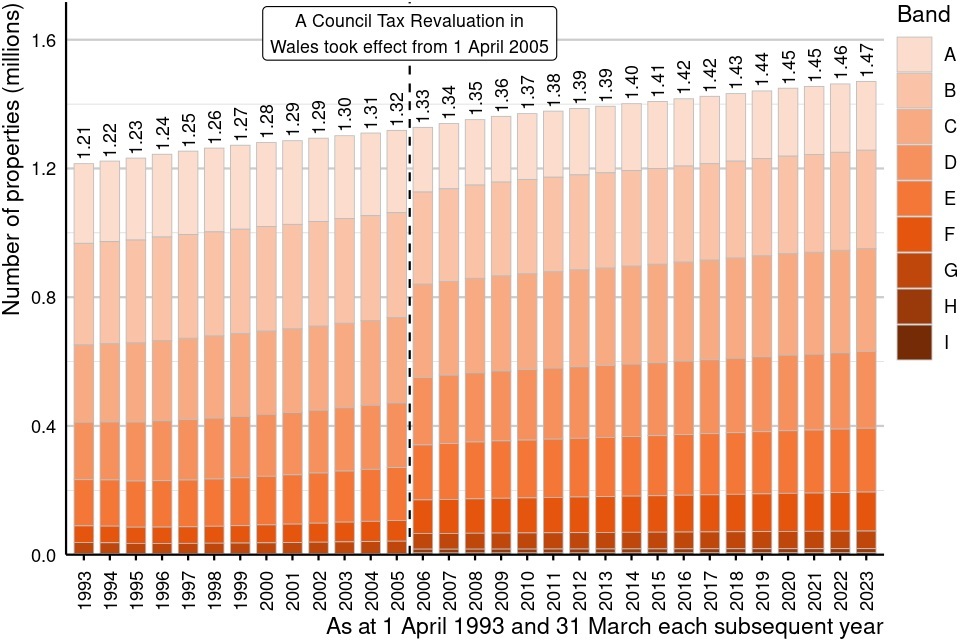
Figure 4.2: The number of properties by Council Tax band in Wales, 1 April 1993 to 31 March 2023
Source: Table CTSOP1.0
Figure notes: Counts are rounded to the nearest ten thousand. The number of properties in each band before and after 1 April 2005 should not be compared because the banding system in Wales was changed on this date. Band I was introduced on 1 April 2005. For details please see the background information.
Figure 4.2 shows the change over time in the number of properties in each Council Tax band in Wales from the first financial year of the list. Between 1 April 1993 and 31 March 2023, the total number of properties in Wales increased from 1.21 million to 1.47 million.
Table 2: The number of properties by Council Tax band in Wales, 31 March 2022 and 31 March 2023
| Band | 31 March 2022 | 31 March 2023 | Difference | Percentage change |
|---|---|---|---|---|
| A | 212,430 | 213,920 | 1,490 | 0.7% |
| B | 304,660 | 305,400 | 740 | 0.2% |
| C | 318,300 | 319,880 | 1,580 | 0.5% |
| D | 237,010 | 238,530 | 1,520 | 0.6% |
| E | 197,220 | 198,410 | 1,190 | 0.6% |
| F | 120,070 | 121,080 | 1,010 | 0.8% |
| G | 54,340 | 54,640 | 310 | 0.6% |
| H | 13,010 | 13,090 | 90 | 0.7% |
| I | 5,620 | 5,630 | – | 0.1% |
| Total | 1,462,660 | 1,470,580 | 7,930 | 0.5% |
Source: Table CTSOP1.0
Table notes: Counts are rounded to the nearest ten. Percentages are rounded to one decimal place. Totals may not sum due to rounding.
Table 2 shows the change in the number of properties in each band in Wales between 31 March 2022 and 31 March 2023:
- the total number of properties in Wales increased by 0.5% between 31 March 2022 and 31 March 2023
-
the bands with the largest percentage change overall were band F, with a 0.8% increase in the number of properties, band A (0.7% increase) and band H (0.7% increase)
- the bands with the smallest percentage change were band B (0.2% increase) and band I (0.1% increase)
4. Distribution of property types and number of bedrooms
4.1 Properties by property type, 31 March 2023
Figure 5: The number of properties by property type in England and Wales, 31 March 2023

Source: Table CTSOP3.0
Figure notes: Counts are rounded to the nearest ten thousand. Percentages are rounded to one decimal place.
Figure 5 shows the number of properties by property type in England and Wales at 31 March 2023:
- the most frequent property type was terraced houses (6.99 million properties, or 26.0% of the total stock), followed by semi-detached houses (6.36 million, 23.7%) and flats/maisonettes (6.31 million, 23.5%)
-
the fewest properties were caravans/house boats/mobile homes (0.12 million, 0.5%) and annexes (0.05 million, 0.2%)
- there were also 0.19 million (0.7%) properties where the property type was unknown
4.2 Properties by property type, country and region, 31 March 2023
Figure 6.1: Bungalows, flats/maisonettes and houses by region and property type in England and Wales, 31 March 2023

Figure 6.2: Annexes, caravans/house boats/mobile homes and properties with an unknown property type by region in England and Wales, 31 March 2023

Source: Table CTSOP3.0
Figures 6.1 and 6.2 show the percentage of properties by property type and region in England and Wales at 31 March 2023:
- in the North East, most of the properties were semi-detached houses (30%) or terraced houses (29%)
-
in the North West, most of the properties were terraced houses (31%) or semi-detached houses (28%)
- in Yorkshire and the Humber, most of the properties were semi-detached houses (29%) or terraced houses (29%)
- in the East Midlands, most of the properties were semi-detached houses (28%) or detached houses (23%)
- in the West Midlands, most of the properties were semi-detached houses (30%) or terraced houses (25%)
- in the East, most of the properties were terraced houses (24%), semi-detached houses (22%) or detached houses (21%)
-
in London, most of the properties were flats/maisonettes (57%)
- in the South East, most of the properties were terraced houses (24%), flats/maisonettes (23%) or semi-detached houses (21%)
- in the South West, most of the properties were terraced houses (25%), semi-detached houses (21%) or flats/maisonettes (20%)
- in Wales, most of the properties were terraced houses (29%) or semi-detached houses (25%)
- in all areas, annexes, caravans/house boats/mobile homes and properties with an unknown property type each made up between 0.03% and 1.17% of the total properties
4.3 Properties by property type and Council Tax band, 31 March 2023
Figure 7: Properties by property type and Council Tax band in England and Wales, 31 March 2023


Source: Table CTSOP3.0
Figure note: Note that Council Tax policy is devolved in Wales and the banding systems are different in England and Wales. For example, band I is only used in Wales and the valuation bands and valuation dates are different. For details please see the background information.
Figure 7 shows the percentage of properties by property type and Council Tax band in England and Wales at 31 March 2023:
- band C constituted the highest percentage of properties for bungalows (26%) and semi-detached houses (31%), and the percentage in each band decreased as the band got further from band C
- most flats/maisonettes (38%) and terraced houses (33%) were in band A, with the percentage in each band decreasing as the band increased
- most detached houses (28%) were in band E and the percentage in each band decreased as the band got further from band E
-
most annexes (87%) were in band A, as were most caravans/house boats/mobile homes (95%)
- of the properties with an unknown property type, 29% were in band A, with the percentage of properties in each band tending to decrease as the band increased
4.4 Properties by number of bedrooms, 31 March 2023
In this release, the number of bedrooms in a property is only shown for some property types. These property types total 26.5 million and include:
- bungalows (2.5 million properties)
-
flats and maisonettes (6.3 million properties)
- terraced houses (7.0 million properties)
- semi-detached houses (6.4 million properties)
- detached houses (4.3 million properties)
All information about the number of bedrooms in a property excludes annexes, caravans, house boats and mobile homes, and properties with an unknown property type. Together these total 0.4 million properties.
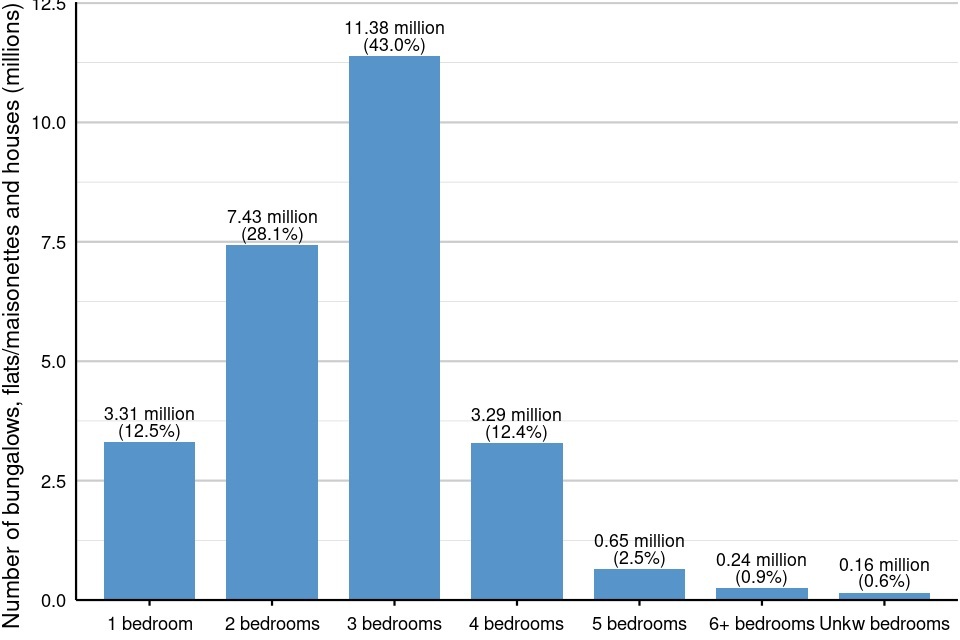
Figure 8: The number of bungalows, flats/maisonettes and houses by number of bedrooms in England and Wales, 31 March 2023
Source: Table CTSOP3.0
Figure note: Counts are rounded to the nearest hundred thousand.
Figure 8 shows the number of bungalows, flats/maisonettes and houses in England and Wales by number of bedrooms at 31 March 2023. Of the 26.5 million bungalows, flats/maisonettes and houses:
-
most had three bedrooms (11.38 million, 43.0%) or two bedrooms (7.43 million, 28.1%)
- the fewest had six or more bedrooms (0.24 million, 0.9%)
- there were 0.16 million (0.6%) which had an unknown number of bedrooms
4.5 Properties by property type and number of bedrooms, 31 March 2023
Figure 9: Bungalows, flats/maisonettes and houses by property type and number of bedrooms in England and Wales, 31 March 2023

Source: Table CTSOP3.0
Figure 9 shows the percentage of bungalows, flats/maisonettes and houses by property type and number of bedrooms in England and Wales at 31 March 2023:
- most bungalows had two bedrooms (49%) or three bedrooms (33%)
- flats/maisonettes mostly had one bedroom (45%) or two bedrooms (44%)
-
most terraced houses had three bedrooms (56%) or two bedrooms (33%)
- semi-detached houses mostly had three bedrooms (73%)
- most detached houses had four bedrooms (46%) or three bedrooms (36%)
4.6 Properties by number of bedrooms and Council Tax band, 31 March 2023
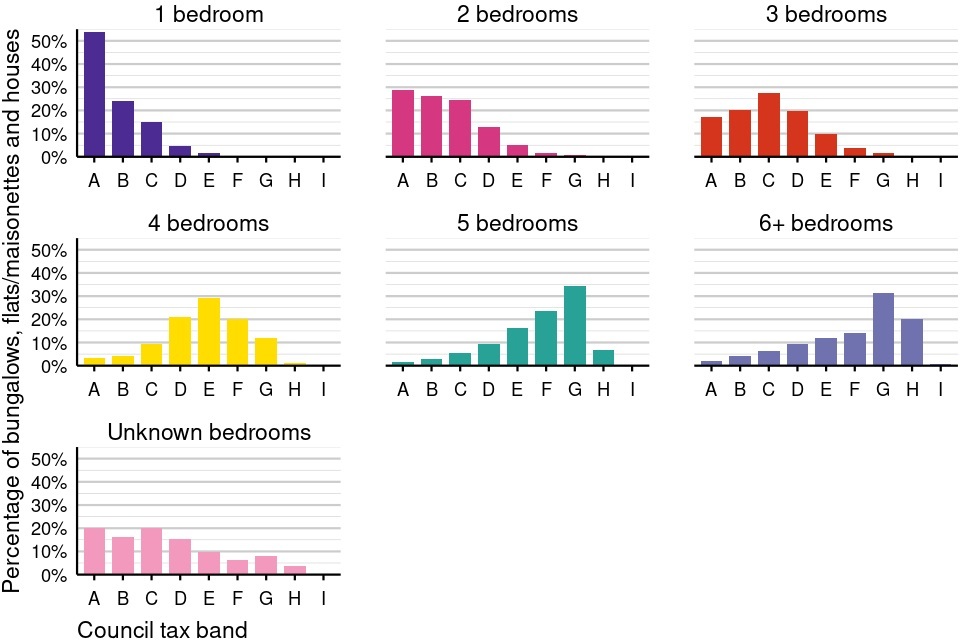
Figure 10: The number of bungalows, flats/maisonettes and houses by number of bedrooms and Council Tax band in England and Wales, 31 March 2023
Source: Table CTSOP3.0
Figure note: Note that Council Tax policy is devolved in Wales and the banding systems are different in England and Wales. For example, band I is only used in Wales and the valuation bands and valuation dates are different. For details please see the background information.
Figure 10 shows the percentage of bungalows, flats/maisonettes and houses by number of bedrooms and Council Tax band in England and Wales at 31 March 2023:
- 54% of the properties with one bedroom and 29% of the properties with two bedrooms were in band A; for both types of property, the percentage in each band decreased as the band increased
-
28% of the properties with three bedrooms were in band C, with the percentage in each band decreasing as the band got further from band C
- 29% of the properties with four bedrooms were in band E, with the percentage in each band decreasing as the band got further from band E
- 34% of the properties with five bedrooms and 31% of the properties with six or more bedrooms were in band G; for both types of property, the percentage in each band decreased as the band got further from band G
- of the properties where the number of bedrooms was unknown, the bands were distributed in a similar pattern to the total number of properties in each band (figure 1)
4.7 Properties by number of bedrooms, country and region, 31 March 2023
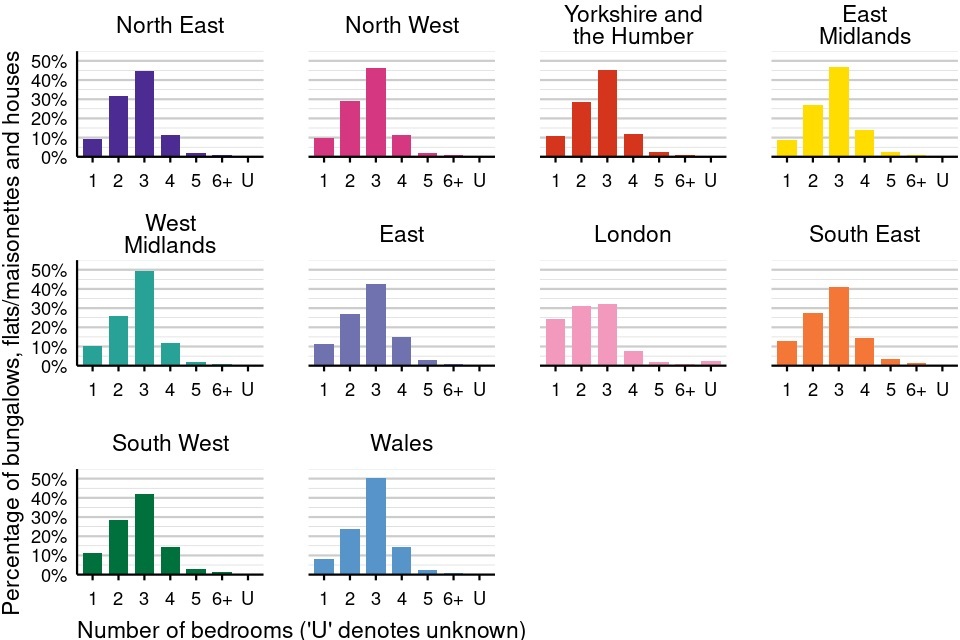
Figure 11: Bungalows, flats/maisonettes and houses by region and number of bedrooms in England and Wales, 31 March 2023
Source: Table CTSOP3.0
Figure 11 shows the percentage of bungalows, flats/maisonettes and houses by number of bedrooms and region in England and Wales at 31 March 2023:
- in all areas, most properties had three bedrooms; this ranged from 32% of the properties in London to 51% of the properties in Wales
- in London, 24% of properties had one bedroom; in all other areas this figure ranged from 8% to 13%
4.8 Properties by property type, 1 April 1993 to 31 March 2023
Figure 12: The number of properties by property type in England and Wales, 1 April 1993 to 31 March 2023

Source: Table CTSOP3.0
Figure note: The total number of properties is rounded to the nearest hundred thousand.
Figure 12 shows the number of properties of each property type from 1 April 1993 to 31 March 2023. At the introduction of the 1993 Council Tax Valuation List, most records were held in paper format. The VOA has been continually working to update and improve the accuracy of the Council Tax Valuation Lists and, by 31 March 2004, were able to record the property type of most of these properties electronically in the VOA’s administrative database. There were 7.4 million properties with an unknown property type at 1 April 1993. This number has been consistently decreasing each year, and at 31 March 2023 this number had reduced to 0.2 million properties.
Table 3: The difference in the number of properties by property type in England and Wales, 31 March 2022 to 31 March 2023
| Property type | 31 March 2022 | 31 March 2023 | Difference | Percentage change |
|---|---|---|---|---|
| Bungalows | 2.47 million | 2.48 million | 5,710 | 0.2% |
| Flats and Maisonettes | 6.20 million | 6.31 million | 104,670 | 1.7% |
| Terraced houses | 6.96 million | 6.99 million | 27,530 | 0.4% |
| Semi-detached houses | 6.31 million | 6.36 million | 49,840 | 0.8% |
| Detached houses | 4.27 million | 4.33 million | 56,340 | 1.3% |
| Annexes | 0.05 million | 0.05 million | 2,630 | 5.3% |
| Caravans, house boats and mobile homes | 0.12 million | 0.12 million | 1,710 | 1.4% |
| Unknown type | 0.19 million | 0.19 million | -1,110 | -0.6% |
| Total | 26.58 million | 26.82 million | 247,310 | 0.9% |
Source: Table CTSOP3.0
Table notes: Property counts are rounded to the nearest ten thousand. Count differences are rounded to the nearest ten. Totals may not sum due to rounding. Percentages are rounded to one decimal place.
Table 3 shows the change in the number of properties by property type between 31 March 2022 and 31 March 2023:
- the property type with the largest percentage change overall was annexes, with a 5.3% increase in the number of properties, followed by flats/maisonettes (1.7% increase) and caravans/house boats/mobile homes (1.4% increase)
-
the property types with the smallest percentage change were terraced houses (0.4% increase) and bungalows (0.2% increase)
- the number of properties with an unknown property type decreased by 0.6%
4.9 Properties by number of bedrooms, 1 April 1993 to 31 March 2023
Only properties which were recorded in the VOA database as a bungalow, flat, maisonette, terraced house, semi-detached house or detached house are included in these statistics.
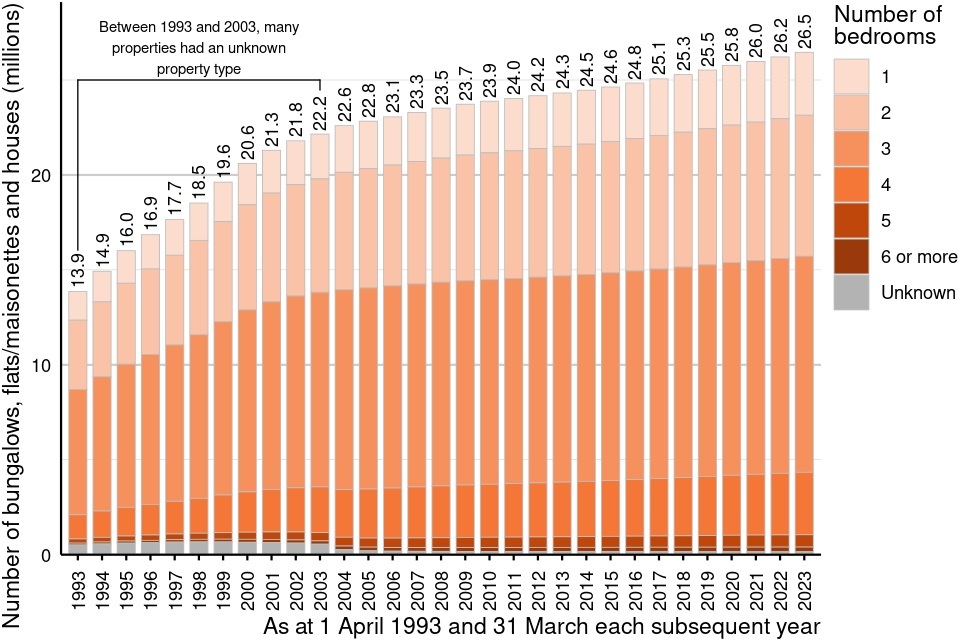
Figure 13: The number of bungalows, flats/maisonettes and houses by number of bedrooms in England and Wales, 1 April 1993 to 31 March 2023
Source: Table CTSOP3.0
Figure note: Counts are rounded to the nearest hundred thousand.
Between 1993 and 2003, many properties had an unknown property type (figure 12). As such, they are excluded from the statistics in figure 13, because this figure only includes information from properties which were recorded at the end of each financial year as either a bungalow, a flat/maisonette or a house. At the introduction of the 1993 Council Tax Valuation List, most records were held in paper format. The VOA has been continually working to update and improve the accuracy of the Council Tax Valuation Lists and, by 31 March 2004, were able to record the property type of most of these properties electronically in the VOA’s administrative database. This is reflected in the year-on-year increases in the total number of bungalows, flats/maisonettes and houses.
Figure 13 shows the number of bedrooms in bungalows, flats/maisonettes and houses in England and Wales from 1 April 1993 to 31 March 2023:
-
at 1 April 1993, there were 0.5 million bungalows, flats/maisonettes and houses with an unknown number of bedrooms
-
at 31 March 2023, there were 0.2 million bungalows, flats/maisonettes and houses with an unknown number of bedrooms
Table 4: The number of bedrooms in bungalows, flats/maisonettes and houses in England and Wales, 31 March 2022 and 31 March 2023
| Number of bedrooms | 31 March 2022 | 31 March 2023 | Difference | Percentage change |
|---|---|---|---|---|
| 1 | 3.25 million | 3.31 million | 60,440 | 1.9% |
| 2 | 7.36 million | 7.43 million | 68,050 | 0.9% |
| 3 | 11.32 million | 11.38 million | 63,520 | 0.6% |
| 4 | 3.24 million | 3.29 million | 43,610 | 1.3% |
| 5 | 0.64 million | 0.65 million | 7,550 | 1.2% |
| 6 or more | 0.24 million | 0.24 million | 1,550 | 0.6% |
| Unknown | 0.16 million | 0.16 million | -630 | -0.4% |
| Total | 26.22 million | 26.46 million | 244,080 | 0.9% |
Source: Table CTSOP3.0
Table notes: Property counts are rounded to the nearest ten thousand. Count differences are rounded to the nearest ten. Totals may not sum due to rounding. Percentages are rounded to one decimal place.
Table 4 shows the change in the number of bedrooms in bungalows, flats/maisonettes and houses between 31 March 2022 and 31 March 2023:
- the number of bungalows, flats/maisonettes and houses with an unknown number of bedrooms decreased by 0.4%
-
the largest percentage change was in properties with one bedroom, which increased by 1.9%, followed by properties with four bedrooms, which increased by 1.3%
- the smallest percentage change was in properties with six or more bedrooms, which increased by 0.6%
5. Distribution of build period
For properties built prior to 2009, the VOA records the ‘build period’ of properties rather than the exact year built. Properties built in 2022 and 2023 have been grouped together in the same ‘build period’. The build periods are not equal in terms of the number of years they cover. Therefore, also shown is the stock of properties in terms of ‘average properties per year of build period’; this allows the figures for different build periods to be compared. Note that this has been done for comparison purposes only and it is not a representation of the number of properties built in a year; therefore, the figures in table 5 should not be compared with the housing supply statistics that are published by DLUHC. The ‘average properties per year of build period’ figure is shown as ‘not applicable’ for properties with a build period of pre-1900 and properties where the build period is unknown.
The number of properties in the list with a build period prior to the 2022 to 2023 financial year has increased for some build periods. This can happen for a number of reasons. For example:
-
a non-domestic property, such as a pub or a barn, may have been renovated into a house; if the reconstruction work was not extensive, then the original build date of the property is used for the build period of the new house
-
a house may have been converted into flats; where the style of the property has not changed, the build period of the old house will be used for the new flats
In addition, the VOA is continually working to improve the accuracy of the Council Tax Valuation Lists, therefore, a property which was previously recorded as having an unknown build period may have had this information added between 1 April 2022 and 31 March 2023.
The number of properties in the list with a build period prior to the 2022 to 2023 financial year has decreased for some build periods. This may happen for a number of reasons. For example:
- if a property is completely rebuilt, or is converted in such a way that the style of the property has changed, the old property will be deleted from the list and a new property will be added; the build period will be derived from the date at which the work on the new property was completed
-
a property will be deleted from the lists if it has been demolished
- if works are being carried out on the property, it may be temporarily removed from the lists due to being in a state of disrepair
- a property may have been converted into a business, such as a shop or a holiday home; in this case, it will be transferred to the non-domestic rating list
5.1 Properties by build period, 31 March 2023
Table 5: The number of properties by build period in England and Wales, 31 March 2023
| Build period | Years in build period | Total stock | Average properties per year of build period |
|---|---|---|---|
| Pre-1900 | – | 4.18 million | – |
| 1900-1918 | 18 | 1.42 million | 78,650 |
| 1919-1929 | 10 | 1.30 million | 129,700 |
| 1930-1939 | 9 | 2.67 million | 296,180 |
| 1945-1954 | 9 | 1.74 million | 193,250 |
| 1955-1964 | 9 | 2.66 million | 295,290 |
| 1965-1972 | 7 | 2.54 million | 363,440 |
| 1973-1982 | 9 | 2.40 million | 266,350 |
| 1983-1992 | 9 | 1.86 million | 207,130 |
| 1993-1999 | 6 | 1.36 million | 226,670 |
| 2000-2008 | 8 | 1.72 million | 214,660 |
| 2009 | 1 | 0.18 million | 180,110 |
| 2010 | 1 | 0.13 million | 128,110 |
| 2011 | 1 | 0.15 million | 146,630 |
| 2012 | 1 | 0.15 million | 147,990 |
| 2013 | 1 | 0.15 million | 153,510 |
| 2014 | 1 | 0.17 million | 166,170 |
| 2015 | 1 | 0.22 million | 215,780 |
| 2016 | 1 | 0.21 million | 212,950 |
| 2017 | 1 | 0.23 million | 227,080 |
| 2018 | 1 | 0.23 million | 230,080 |
| 2019 | 1 | 0.24 million | 244,500 |
| 2020 | 1 | 0.21 million | 208,400 |
| 2021 | 1 | 0.25 million | 249,080 |
| 2022-2023 | 1 | 0.25 million | 246,810 |
| Unknown | – | 0.23 million | – |
Source: Table CTSOP4.0
Table notes: Total stock is rounded to the nearest ten thousand. Average properties per year of build period is rounded to the nearest ten and is calculated by dividing the total stock in the build period by the number of years in the build period. ‘–’ is used to denote ‘not applicable’.
Note 1: These statistics only include properties in the Council Tax Valuation Lists as at 31 March 2023.
Table 5 shows the number of properties by build period in England and Wales at 31 March 2023:
- 246,810 of the properties had a build period of 2022 to 2023 (i.e. were built between 1 January 2022 and 31 March 2023). Properties built in 2022 and 2023 have been grouped together in the same Age code. This will be reviewed in future publications.
5.3 Properties by build period and Council Tax band, 31 March 2023
The following charts show the number of properties by build period and Council Tax band in England and Wales for properties that were on the Council Tax Valuation Lists as at 31 March 2023.
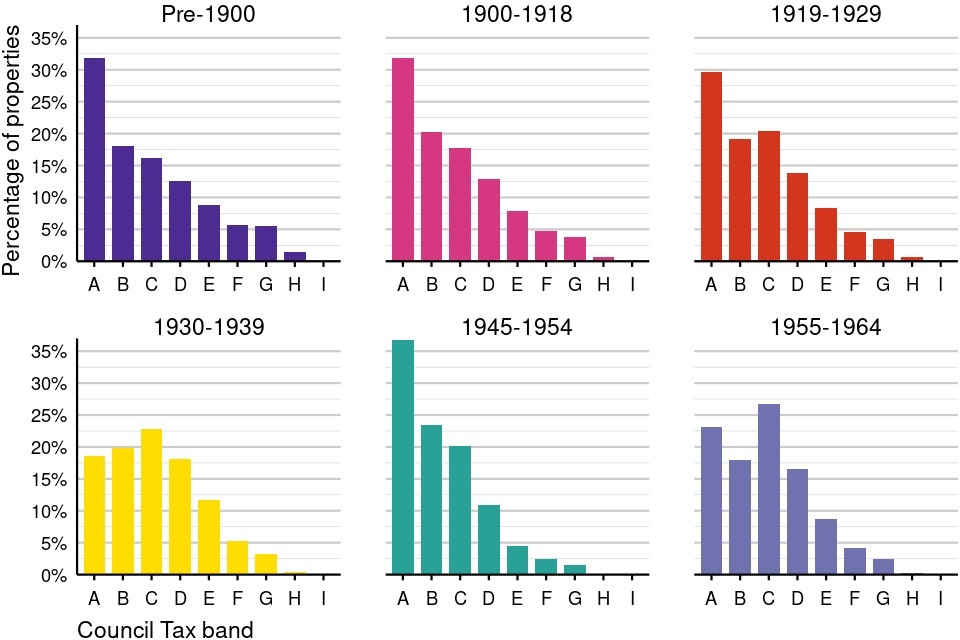
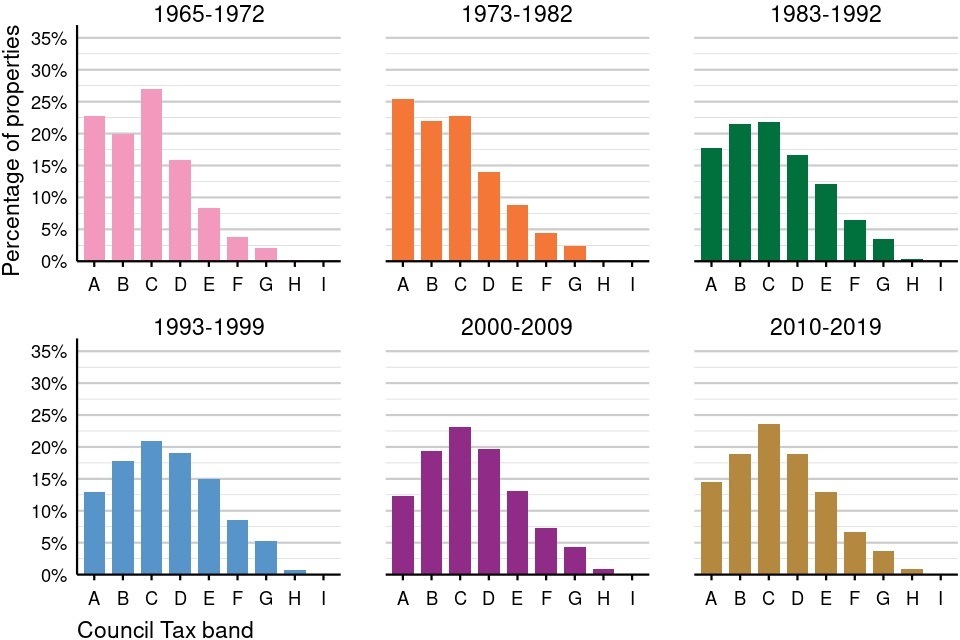
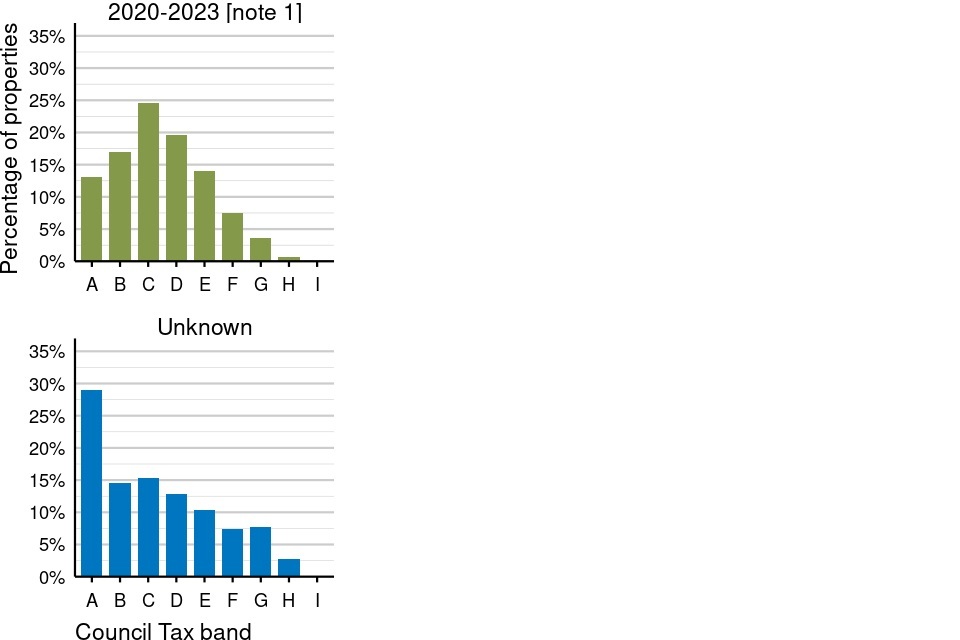
Figure 14: Properties by build period and Council Tax band in England and Wales, 31 March 2023
Source: Table CTSOP4.0
Figure note: Note that Council Tax policy is devolved in Wales and the banding systems are different in England and Wales. For example, band I is only used in Wales and the valuation bands and valuation dates are different. For details please see the background information.
Note 1: These statistics only include properties in the Council Tax Valuation Lists as at 31 March 2023.
Figure 14 shows the percentage of properties by build period and Council Tax band in England and Wales at 31 March 2023:
- for properties with a build period of pre-1900, 1900-1918, 1919-1929, 1945-1954 and 1973-1982, most (between 25% and 37%) were in band A; for all of these build periods the percentage in each band tended to decrease as the band increased
- for properties with all other build periods, most (between 21% and 27%) were in band C and the percentage in each band tended to decrease as the band got further from band C
- of the properties where the build period was unknown, 29% were in band A and the percentage in each band tended to decrease as the band increased
5.4 Properties by build period, 1 April 1993 to 31 March 2023
Figure 15: The number of properties by build period in England and Wales, 1 April 1993 to 31 March 2023
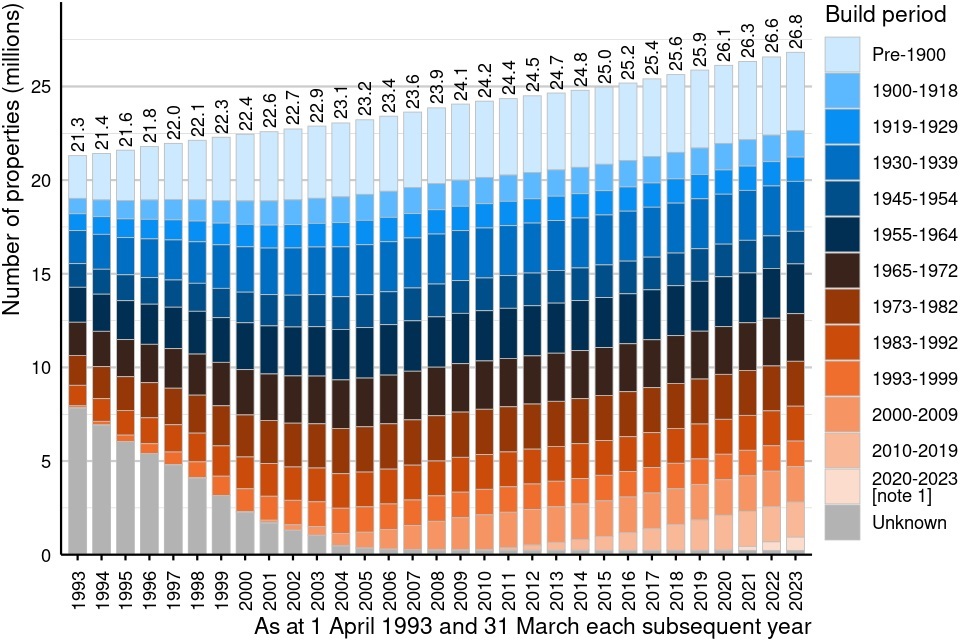
Source: Table CTSOP4.0
Note 1: These statistics only include properties in the Council Tax Valuation Lists as at 31 March 2023.
Figure 15 shows the number of properties by build period from 1 April 1993 to 31 March 2023. Between 1993 and 2003, many properties had an unknown property type (figure 12). At the introduction of the 1993 Council Tax Valuation List, most records were held in paper format. The VOA has been continually working to update and improve the accuracy of the Council Tax Valuation Lists and, by 31 March 2004, were able to record the property type of most of these properties electronically in the VOA’s administrative database. The reducing number of properties with an unknown property type in each year closely matches the reducing number of properties with an unknown build period:
-
at 1 April 1993, there were 7.40 million properties with an unknown property type and 7.83 million properties with an unknown build period
-
at 31 March 2023, there were 0.19 million properties with an unknown property type and 0.23 million properties with an unknown build period
Table 6: The number of properties by build period in England and Wales, 31 March 2022 and 31 March 2023
| Build period | 31 March 2022 | 31 March 2023 | Difference | Percentage change |
|---|---|---|---|---|
| Pre-1900 | 4.18 million | 4.18 million | 3,260 | 0.08% |
| 1900-1918 | 1.42 million | 1.42 million | 620 | 0.04% |
| 1919-1929 | 1.30 million | 1.30 million | 20 | 0.00% |
| 1930-1939 | 2.67 million | 2.67 million | -60 | -0.00% |
| 1945-1954 | 1.74 million | 1.74 million | 0 | -0.00% |
| 1955-1964 | 2.66 million | 2.66 million | -1,370 | -0.05% |
| 1965-1972 | 2.55 million | 2.54 million | -2,300 | -0.09% |
| 1973-1982 | 2.40 million | 2.40 million | -1,010 | -0.04% |
| 1983-1992 | 1.86 million | 1.86 million | -200 | -0.01% |
| 1993-1999 | 1.36 million | 1.36 million | -240 | -0.02% |
| 2000-2009 | 1.90 million | 1.90 million | -380 | -0.02% |
| 2010-2019 | 1.87 million | 1.87 million | 80 | 0.00% |
| 2020-2023 [note 1] | 0.45 million | 0.70 million | 250,240 | – |
| Unknown | 0.23 million | 0.23 million | -1,350 | -0.58% |
| Total | 26.58 million | 26.82 million | 247,310 | 0.93% |
Source: Table CTSOP4.0
Table notes: Property counts are rounded to the nearest ten thousand. Count differences are rounded to the nearest ten. Totals may not sum due to rounding. Percentages are rounded to two decimal places. ‘–’ is used to denote ‘not applicable’.
Note 1: The statistics as at 31 March 2022 will only include properties with a Council Tax band that were built from 1 January 2020 to 31 March 2022. The statistics as at 31 March 2023 will only include properties with a Council Tax band that were built from 1 January 2020 to 31 March 2023. Therefore, it is not appropriate to calculate the percentage change for this build period.
Table 6 shows the change in the number of properties in each build period between 31 March 2022 and 31 March 2023:
-
the number of properties with a build period of 2020-2023 increased by 250,240, from 0.45 million to 0.70 million, this will mostly be properties with a Council Tax band that were built from 1 April 2022 to 31 March 2023
-
the number of properties with an unknown build period decreased by 0.58%
6. Insertions to and deletions from the Council Tax Valuation Lists
6.1 Net change
Figure 16: The number of properties inserted into and deleted from the Council Tax Valuation Lists in England and Wales, 1 April 1993 to 31 March 2023
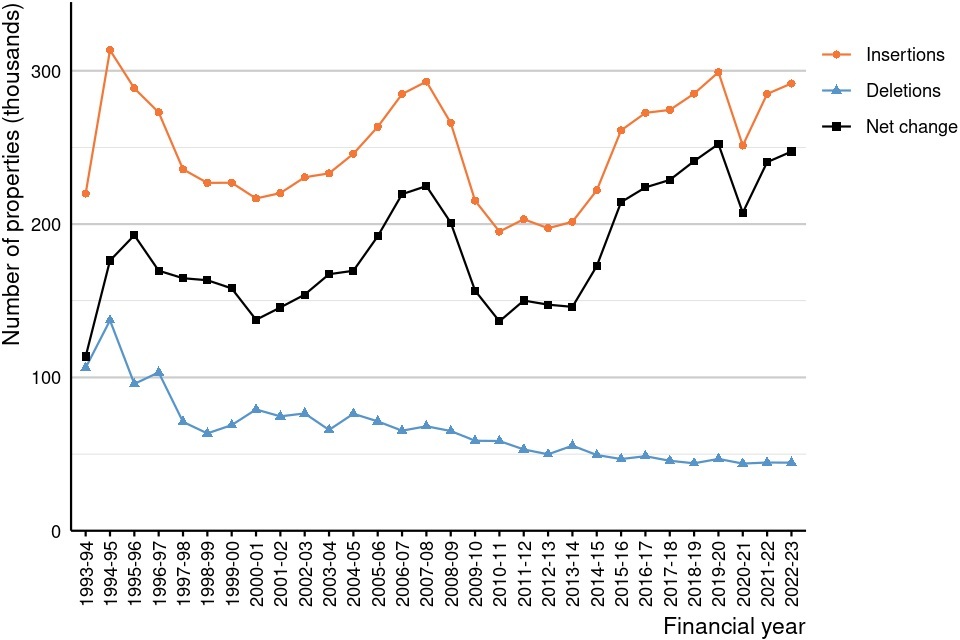
Source: Tables CTSOP5.0 and CTSOP6.0
Figure note: Net change is calculated as the difference between the total number of properties inserted into the lists and the total number of properties deleted from the lists in a financial year.
Figure 16 shows the number of properties inserted to and deleted from the Council Tax Valuation Lists from 1993-94 to 2022-23. The number of properties inserted and deleted increased in 1994 to 1995. This occurred as a result of boundary changes; when changes to the boundaries of local authorities result in a large number of properties moving from one billing authority to another, the VOA processes these changes by removing these properties from the Council Tax Valuation Lists. The properties are then reinserted into the list with the property’s new billing authority. For further information on these changes, please see the ONS web page on local government restructuring.
Generally, the number of properties deleted has tended to decrease over the years:
-
in 1993 to 1994 there were 106,300 properties deleted
-
in 2022 to 2023 there were 44,400 properties deleted
The pattern of properties inserted does not follow the same trend as the pattern of properties deleted:
- from the 2000 to 2001 financial year, the number of properties inserted into the lists each year began to increase
- in 2007 to 2008 there was a dramatic decline in the number of properties being inserted; this reflects the effects of the global financial crisis that happened in 2007 to 2008
-
the number of properties inserted plateaued between 1 April 2010 and 1 April 2013
- since 1 April 2013, the number of properties inserted has increased each year; this could be attributable to policies that were introduced around this time which were designed to encourage house building, such as the New Homes Bonus (introduced 1 April 2011) and the Help to Buy scheme (introduced 1 April 2013)
- the Covid-19 pandemic and the associated UK government lockdown measures affecting the construction industry likely had an impact on the number of properties inserted; 47,820 (16%) fewer properties were inserted in the 2020 to 2021 financial year than in 2019 to 2020
- the impact of the Covid-19 pandemic appears to be less pronounced in 2021 to 2022; 33,660 (13%) more properties were inserted in the 2021 to 2022 financial year than in 2020 to 2021, and the 2021 to 2022 figure is similar to the number of properties inserted in the 2018 to 2019 financial year
6.2 Insertions
Figure 17: The number of properties inserted into the Council Tax Valuation Lists in England and Wales, 1 April 2022 to 31 March 2023
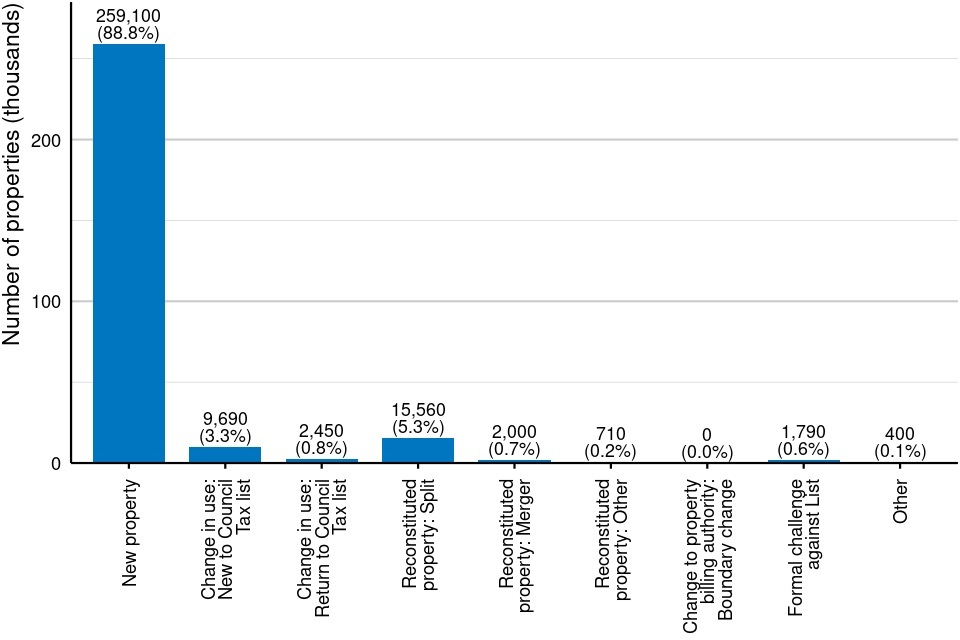
Source: Table CTSOP5.0
Figure notes: Counts are rounded to the nearest ten. Percentages are rounded to one decimal place. ‘New property’ means a new entry not previously in the Council Tax list; this may not necessarily indicate new build properties, but those that are inserted as a result of a report with this category in the Valuation Office Agency’s administrative database. In most cases the report type is provided by the billing authority.
Figure 17 shows the reasons that properties were inserted into the Council Tax Valuation Lists between 1 April 2022 and 31 March 2023. The main reason that properties were inserted into the lists was new properties being added to the list, which made up 88.8% of all insertions.
Figure 18: The number of properties inserted into the Council Tax Valuation Lists in England and Wales, 1 April 1993 to 31 March 2023
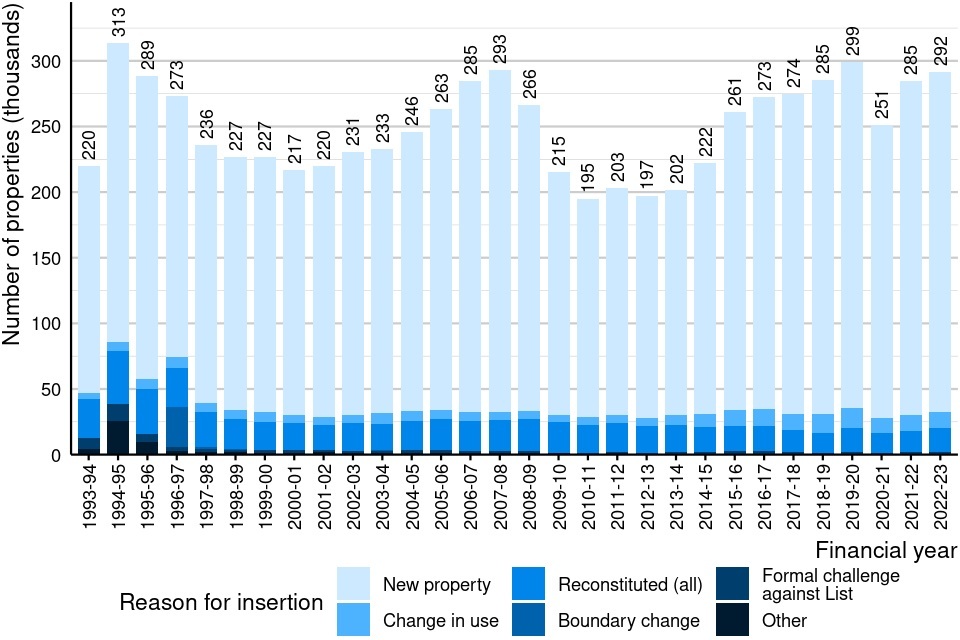
Source: Table CTSOP5.0
Figure notes: Counts are rounded to the nearest thousand. ‘New property’ means a new entry not previously in the Council Tax list; this may not necessarily indicate new build properties, but those that are inserted as a result of a report with this category in the Valuation Office Agency’s administrative database. In most cases the report type is provided by the billing authority.
Figure 18 shows a time series of the number of properties inserted into the Council Tax Valuation Lists in England and Wales. To make the chart clearer, some of the categories from figure 17 have been grouped together.
In every financial year, the main reason that properties were inserted was new properties being added to the list. In most years, the second most frequent reason was properties being reconstituted; that is, a property being split up into two or more properties, properties being merged into a single property, or another kind of reconstitution. However, in 1996 to 1997, the second most frequent reason was properties inserted as a result of boundary changes (see section 6.1 Net change).
6.3 Deletions
Figure 19: The number of properties deleted from the Council Tax Valuation Lists in England and Wales, 1 April 2022 to 31 March 2023
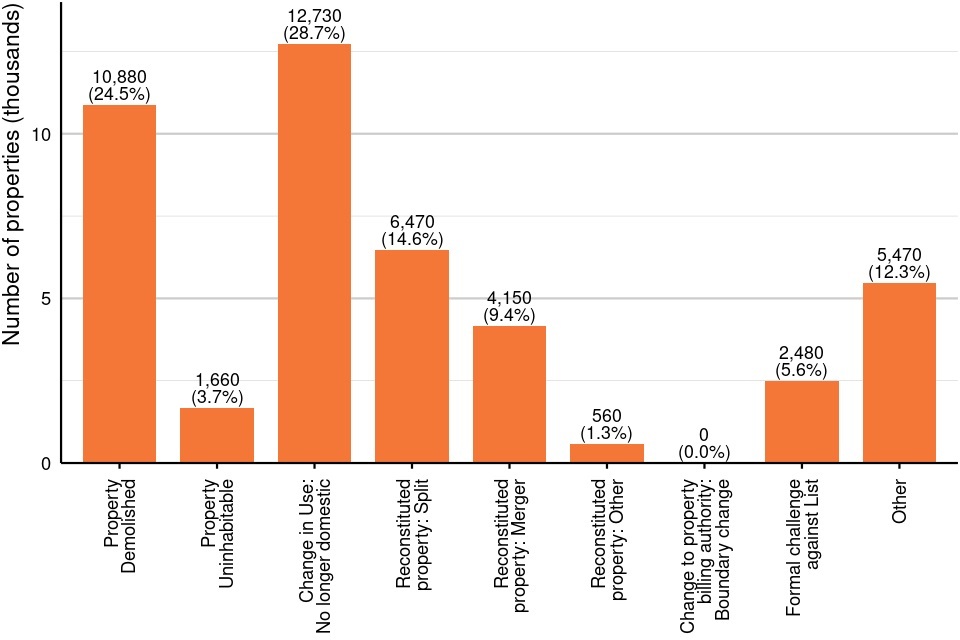
Source: Table CTSOP6.0
Figure notes: Counts are rounded to the nearest ten. Percentages are rounded to one decimal place.
Figure 19 shows the reasons that properties were deleted from the Council Tax Valuation Lists between 1 April 2022 and 31 March 2023. The main reasons for properties to be deleted from the lists were properties moving from domestic to commercial use, which made up 28.7% of all deletions, and properties being demolished (24.5% of deletions).
Figure 20: The number of properties deleted from the Council Tax Valuation Lists in England and Wales, 1 April 1993 to 31 March 2023
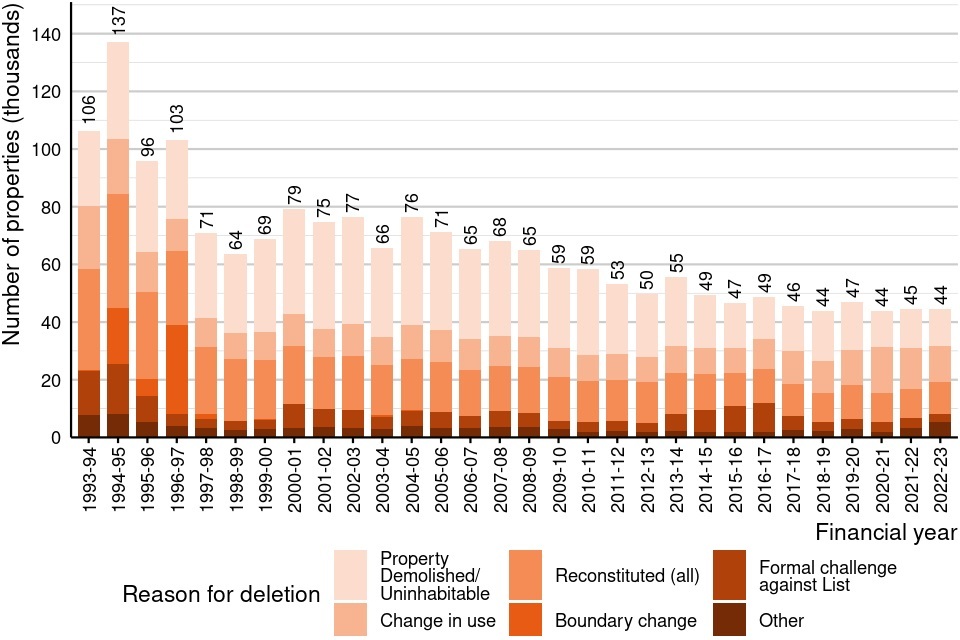
Source: Table CTSOP6.0
Figure note: Counts are rounded to the nearest thousand.
Figure 20 shows a time series of the number of properties deleted from the Council Tax Valuation Lists in England and Wales. To make the chart clearer, some of the categories from figure 19 have been grouped together.
In most financial years, the main reasons that properties were deleted were properties being demolished or deemed uninhabitable, properties being reconstituted and properties moving from domestic to commercial use. From 1994-95 to 1997-98, a large number of properties were deleted as a result of boundary changes (see section 6.1 Net change).
Further Information
Further information about the data and methodology presented in this commentary can be found in the Background Information.
As part of our improvement programme, if you’re interested in participating in user research about this statistical release, please contact us at statistics@voa.gov.uk.
GOV.UK has more information on:
- how properties are assessed for Council Tax bands
- how to check your Council Tax band
- how to challenge your Council Tax band
Timings of future releases are regularly placed on the VOA research and statistics calendar.
For further information on the geographical information used in this release please refer to the ONS Administrative Geography Guidance.
Housing statistics from other government departments
Office for National Statistics
Department for Levelling Up, Housing and Communities and Homes England (England)
Welsh Government (Wales)
Department for Communities (Northern Ireland)
Housing and Social Justice Directorate (Scotland)