Commentary - Company Insolvency Statistics July 2026
Published 18 August 2026

© Crown copyright 2026
This publication is licensed under the terms of the Open Government Licence v3.0 except where otherwise stated. To view this licence, visit nationalarchives.gov.uk/doc/open-government-licence/version/3 or write to the Information Policy Team, The National Archives, Kew, London TW9 4DU, or email: psi@nationalarchives.gov.uk.
Where we have identified any third party copyright information you will need to obtain permission from the copyright holders concerned.
This publication is available at https://www.gov.uk/government/statistics/company-insolvencies-july-2026/commentary-company-insolvency-statistics-july-2026
Released
18 August 2026
Next release
18 September 2026
Media enquiries
press.office@insolvency.gov.uk
+44 (0)30 3003 1743
Statistical enquiries
Christopher Bendle (author)
David Webster (responsible statistician)
This publication relates to company insolvency only. Statistics relating to individual insolvency can be found on the individual insolvency releases page.
1. Main messages for England and Wales
-
The number of registered company insolvencies in England and Wales was 1,931 in July 2026, 5% higher than in June 2026 (1,847) but 5% lower than the same month in the previous year (2,031 in July 2025).
-
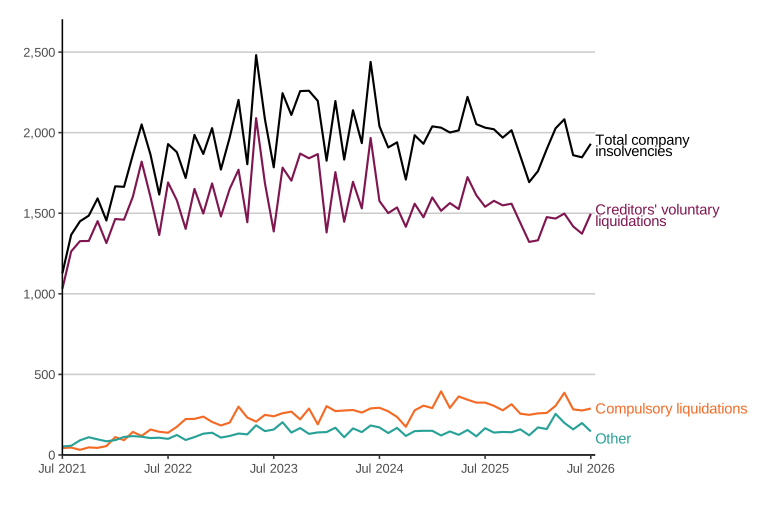
Company insolvencies in July 2026 consisted of 288 compulsory liquidations, 1,497 creditors’ voluntary liquidations (CVLs), 124 administrations and 22 company voluntary arrangements (CVAs). There were no receivership appointments. Numbers of CVLs and compulsory liquidations were higher than in June 2026, but lower than in July 2025. Administrations were 33% lower than in June 2026, when approximately 60 connected companies in the real estate sector entered administration, and 19% lower than in July 2025.
-
One in 199 companies (at a rate of 50.3 per 10,000 companies) entered insolvency between 1 August 2025 and 31 July 2026. This was a decrease from the 52.5 per 10,000 companies that entered insolvency in the 12 months ending 31 July 2025. Insolvency rates are calculated on a 12-month rolling basis as a proportion of the total number of companies on the effective register. The 12-month rolling rates show longer term trends and reduce the volatility associated with estimates based on single months.
-
While the insolvency rate has increased since the lows seen in 2020 and 2021, it remains much lower than the peak of 113.1 per 10,000 companies seen during the 2008-09 recession. This is because the number of companies on the effective register has more than doubled over this period.
Figure 1: The total number of company insolvencies in July 2026 was higher than in June 2026, driven by an increase in CVLs.
Monthly company insolvencies by type, England and Wales, July 2021 to July 2026, seasonally adjusted
Source: Insolvency Service
Monthly numbers back to January 2023 and annual numbers back to 2016 can be found in Table 1a of the tables accompanying this release. The monthly series back to January 2000, as well as record-level data back to 2016, can be found in the accompanying comma-separated values (CSV) file at the same link.
Quarterly data prior to 2000 can be found in the long-run company insolvencies CSV file or back to 1960 (where available) on the National Archives website.
1.1 Things you need to know about this release
This statistics release contains the latest data on company insolvency in the United Kingdom. It presents the numbers of companies that have entered a formal insolvency procedure after being unable to pay their debts. Information is presented separately for England and Wales, Scotland and Northern Ireland.
Solvent company closures such as members’ voluntary liquidations and dissolutions are not included in these statistics. Information on business closures in general can be found in the Office for National Statistics (ONS) Business demography publication.
Statistics relating to company demographics are presented in the Business Insolvency Demography publication, which contains information about numbers and rates of insolvency by location, industry sector, age, number of employees and turnover.
Underlying data for these monthly statistics for England and Wales were adjusted using an autoregressive integrated moving average (ARIMA) model where there was evidence of seasonality. Where applicable, seasonally adjusted numbers are used and referred to throughout this commentary. The removal of systematic calendar-related variation enables comparisons to be made between months and the underlying trend in insolvency numbers to be determined. In accordance with the outcome of the April 2026 Seasonal Adjustment Review, compulsory liquidations, CVLs and administrations were all seasonally adjusted. CVAs, moratoriums, restructuring plans and receivership appointments were not seasonally adjusted due to low volumes. Similarly, all data for Scotland and Northern Ireland were not seasonally adjusted. For the series which have been seasonally adjusted, the underlying (non-seasonally adjusted) numbers can be found in Tables 1b and 1d of the accompanying tables.
All figures presented within this release are provisional and subject to review. Further detail can be found in the accompanying Company Statistics Methodology and Quality document.
1.2 Designation as accredited official statistics
These accredited official statistics were independently reviewed by the Office for Statistics Regulation (OSR) in July 2024. They comply with the standards of trustworthiness, quality and value in the Code of Practice for Statistics and are labelled ‘accredited official statistics’.
Further details of the OSR’s review of these statistics can be found in their published Compliance Check. You are welcome to contact us directly with any comments about how we meet these standards. Alternatively, you can contact OSR by emailing regulation@statistics.gov.uk or via the OSR website.
2. Company insolvency in England and Wales
2.1 Numbers of company insolvencies
Latest Month
There were 1,931 company insolvencies in July 2026, 5% higher than in June 2026 but 5% lower than in July 2025. July 2026 saw higher numbers of CVLs and compulsory liquidations than June 2026. The change of 5% compared to June 2026 is less than the average absolute change of 8% between consecutive months over the past three years.
Long-term trends
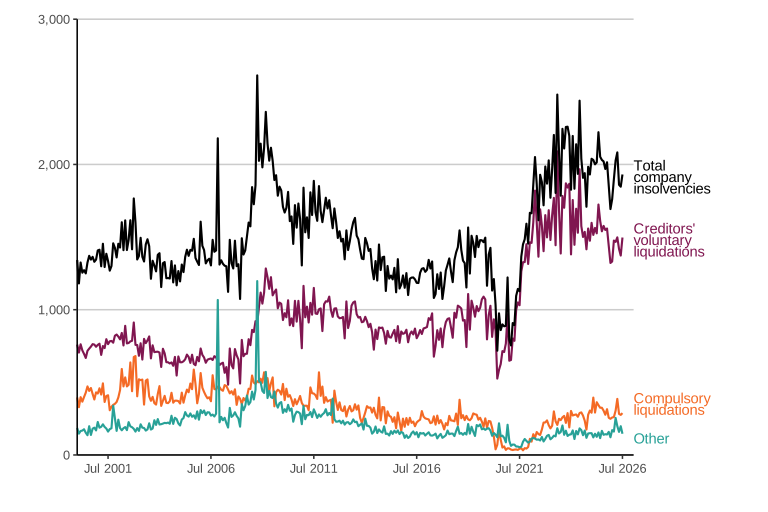
Company insolvencies peaked during the 2008-09 recession, following the gradual decline seen over the early 2000s. Volumes rose during 2018 and 2019, before falling to the lowest monthly volumes on record during the COVID-19 pandemic in 2020 and 2021, when government support measures were in place. CVL numbers then increased in 2022, exceeding pre-pandemic levels while compulsory liquidations and administration numbers remained low. Insolvency numbers increased further in 2023 to a 30-year high, with CVLs at a record high and compulsory liquidations at levels similar to 2016-19. The 2025 total was slightly higher than 2024, as an increase in compulsory liquidations outweighed decreases in other insolvency types.
Monthly numbers of company insolvencies in July 2026 were similar to the average of the past 12 months. Despite higher numbers in March and April 2026, on average volumes of insolvencies in 2026 have been 6% lower than the monthly average of the preceding three years. This has been driven by lower numbers of CVLs.
Figure 2 shows the historical trend of company insolvencies since January 2000.
Figure 2: Company insolvencies since the second half of 2022 have been at levels last seen during the 2008-09 recession.
Monthly company insolvencies by type, England and Wales, January 2000 to July 2026, seasonally adjusted
Source: Insolvency Service
Single-month peaks in ‘Other insolvencies’ in November 2006 and October 2008 are due to large numbers of connected managed service companies entering administration on the same day in these months.
Monthly numbers back to January 2023 and annual numbers back to 2016 can be found in Table 1a of the tables accompanying this release. The monthly series back to January 2000, as well as record-level data back to 2016, can be found in the accompanying CSV file at the same link.
Quarterly data prior to 2000 can be found in the long-run company insolvencies CSV file or back to 1960 (where available) on the National Archives website.
CVLs
In July 2026, CVLs accounted for 78% of all company insolvencies. The number of CVLs was 9% higher than in June 2026, and 3% lower than in July 2025. The average monthly number of CVLs in the first seven months of 2026 was 7% lower than the average monthly number in 2025.
In 2025 CVL volumes slightly decreased by 2% from 2024 and by 10% from the record-high number registered in 2023. The past four years have seen the highest four numbers of CVLs since the time series began in 1960. Between 2017 and 2019, CVLs had been rising at approximately 10% per year, but during the COVID-19 pandemic, they fell to their lowest levels since 2007.
Compulsory liquidations
The number of compulsory liquidations in July 2026 was 4% higher than in June 2026 and 11% lower than in July 2025. The average monthly number of compulsory liquidations in the first seven months of 2026 was 6% lower than the 2025 monthly average.
In 2025, compulsory liquidations were at the highest levels since 2012, having increased by 15% compared to 2024 volumes. This continued an increase from record low levels seen in 2020 and 2021, while restrictions applied to the use of statutory demands and certain winding-up petitions (leading to compulsory liquidations).
Administrations
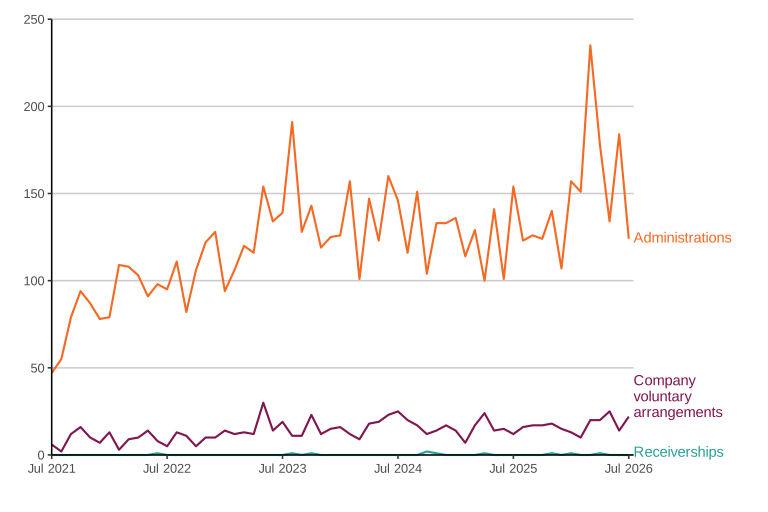
The number of administrations in July 2026 was 33% lower than in June 2026 when approximately 60 connected companies in the real estate sector entered administration, and 19% lower than in July 2025. The average monthly number of administrations in the first seven months of 2026 was 33% higher than the 2025 monthly average. This was driven by higher numbers in March, April and June 2026, when approximately 260 connected companies in the real estate sector entered administration.
In 2025, the number of administrations decreased by 8% from 2024. This followed a sustained increase between 2022 and 2024 after the 18-year annual low seen during the COVID-19 pandemic in 2021.
Figure 3: The number of administrations in July 2026 was lower than in both June 2026 and July 2025.
Monthly company insolvencies by type, England and Wales, July 2021 to July 2026, seasonally adjusted
Source: Insolvency Service
Monthly numbers back to January 2023 and annual numbers back to 2016 can be found in Table 1a of the tables accompanying this release. The monthly series back to January 2000, as well as record-level data back to 2016, can be found in the accompanying CSV file at the same link.
Quarterly data prior to 2000 can be found in the long-run company insolvencies CSV file or back to 1960 (where available) on the National Archives website.
CVAs
There were 22 CVAs in July 2026, this was 57% higher than in June 2026 and 83% higher than in July 2025. Numbers remain low compared to historical levels. CVAs are not seasonally adjusted due to low volumes.
Receivership appointments
There were no receivership appointments in July 2026. Receivership appointments are now rare, with only three being registered in the past 12 months ending July 2026 (see Glossary for further information).
Table 1: Company insolvencies in July 2026 were 5% higher than in June 2026 but 5% lower than in July 2025.
Company insolvencies, England and Wales, July 2025 to July 2026, seasonally adjusted
| Period | Total Company Insolvencies | Compulsory liquidations | Creditors’ voluntary liquidations | Administrations | Company voluntary arrangements | Receivership appointments |
|---|---|---|---|---|---|---|
| Jul 2025 | 2,031 | 325 | 1,540 | 154 | 12 | 0 |
| Apr 2026 | 2,083 | 386 | 1,498 | 178 | 20 | 1 |
| May 2026 | 1,860 | 283 | 1,418 | 134 | 25 | 0 |
| Jun 2026 | 1,847 | 276 | 1,373 | 184 | 14 | 0 |
| Jul 2026 | 1,931 | 288 | 1,497 | 124 | 22 | 0 |
| Percentage change, latest month compared to: | ||||||
| vs Jul 2025 | -5% | -11% | -3% | -19% | 83% | [z] |
| vs Jun 2026 | 5% | 4% | 9% | -33% | 57% | [z] |
Sources: Insolvency Service (compulsory liquidations only); Companies House (all other insolvency procedures)
[z] indicates percentage change is not applicable as it has not been calculated where both numbers are less than five.
Monthly numbers back to January 2023 and annual numbers back to 2016 can be found in Table 1a of the tables accompanying this release. The monthly series back to January 2000, as well as record-level data back to 2016, can be found in the accompanying CSV file at the same link.
Quarterly data prior to 2000 can be found in the long-run company insolvencies CSV file or back to 1960 (where available) on the National Archives website.
2.2 Moratoriums and restructuring plans
There were five moratoriums and two restructuring plans registered at Companies House in July 2026. Between 26 June 2020 and 31 July 2026, 83 companies obtained a moratorium and 62 companies had a restructuring plan registered at Companies House. The two procedures were created by the Corporate Insolvency and Governance Act 2020. Monthly numbers back to January 2023 and annual numbers back to 2020 can be found in Table 1e of the tables accompanying this release.
2.3 Insolvency rates per 10,000 companies on the effective register
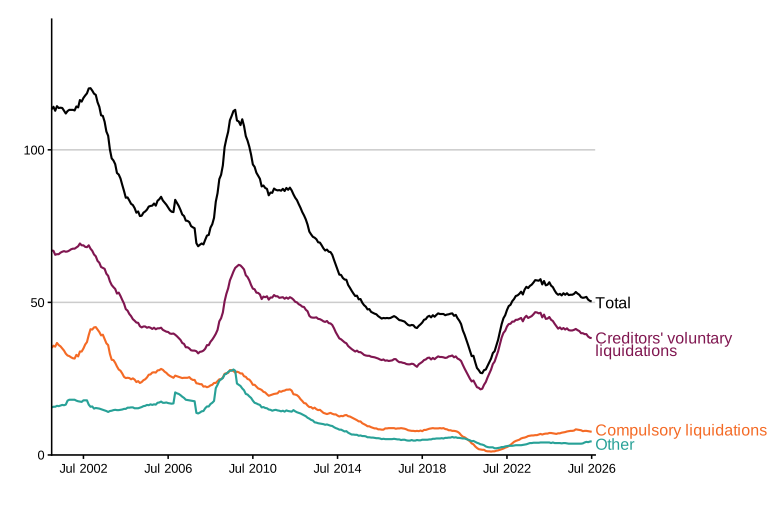
The company insolvency rate in the last 12 months was 50.3 per 10,000 companies on the effective register in England and Wales, as shown in Table 2 and Figure 4 below. This corresponds to one in 199 companies entering insolvency.
Insolvency rates are calculated as a proportion of the total number of companies on the effective register and are more comparable over longer time periods than the absolute numbers.
A 12-month rolling rate is presented to reduce the volatility associated with estimates based on single months. The July 2026 rates, for example, were calculated using data covering the period 1 August 2025 to 31 July 2026.
Table 2: The rate of company insolvency in the 12 months to July 2026 was lower than in the 12-month period ending July 2025.
Company insolvencies, 12-month rolling insolvency rate per 10,000 companies on the effective register, England and Wales
| Period | Total Company Insolvencies | Compulsory liquidations | Creditors’ voluntary liquidations | Administrations | Company voluntary arrangements | Receivership appointments |
|---|---|---|---|---|---|---|
| Jul 2025 | 52.5 | 7.9 | 40.8 | 3.3 | 0.4 | 0.0 |
| Apr 2026 | 51.8 | 7.9 | 39.6 | 3.9 | 0.4 | 0.0 |
| May 2026 | 50.9 | 7.8 | 38.8 | 3.8 | 0.4 | 0.0 |
| Jun 2026 | 50.5 | 7.7 | 38.4 | 4.0 | 0.4 | 0.0 |
| Jul 2026 | 50.3 | 7.6 | 38.3 | 4.0 | 0.5 | 0.0 |
| Change in rate, latest month compared to: | ||||||
| vs Jul 2025 | -2.2 | -0.3 | -2.5 | 0.7 | 0.1 | 0.0 |
Source: Insolvency Service (compulsory liquidations only); Companies House (all other insolvency procedures)
Please note that total values may not equal the sum of their components due to rounding.
Monthly numbers back to January 2023 and annual numbers back to 2016 can be found in Table 3 of the tables accompanying this release. The monthly series back to January 2000, as well as record-level data back to 2016, can be found in the accompanying CSV file at the same link.
Quarterly data prior to 2000 can be found in the long-run company insolvencies CSV file or back to 1960 (where available) on the National Archives website.
Figure 4: The insolvency rate in the 12 months ending July 2026 was lower than in the 12 months ending July 2025.
12-month rolling insolvency rate per 10,000 companies on the effective register, England and Wales, January 2001 to July 2026
Source: Insolvency Service
Monthly numbers back to January 2023 and annual numbers back to 2016 can be found in Table 3 of the tables accompanying this release. The monthly series back to January 2000, as well as record-level data back to 2016, can be found in the accompanying CSV file at the same link.
Quarterly data prior to 2000 can be found in the long-run company insolvencies CSV file or back to 1960 (where available) on the National Archives website.
Although company insolvency volumes over the past two years were at the highest levels seen since the 2008/09 recession, the number of companies on the Companies House register has increased over time. Therefore, recent insolvency rates have remained much lower than the peak rate of 113.1 insolvencies per 10,000 companies on the effective register during the 2008/09 recession. More information on the size of the Companies House register is available in Companies House Official Statistics publications.
2.4 Company insolvencies by industry (SIC 2007)
The following analysis excludes insolvencies involving non-trading and dormant companies as well as cases where the company industry was unknown (2% of the total number of insolvencies in the 12 months to July 2026, compared to 1% in the 12 months to July 2025). There are more unknowns in recent months as the recording of industry sector for compulsory liquidations is sometimes delayed. These numbers are likely to be revised in future editions of this publication, when the industry sectors of these cases become available.
Note that the numbers of insolvencies across industry sectors are likely to be partly driven by the number of companies on the effective register within each sector. Therefore, the insolvency volumes by industry presented here do not reflect the relative likelihood of companies in any given sector entering insolvency. Rates per 10,000 businesses experiencing company insolvency by industry sector can be found in the Business Insolvency Demography publication.
SIC codes are self-reported. For these statistics, the first recorded SIC code on the Companies House register has been used to determine the industry in which a company operates.
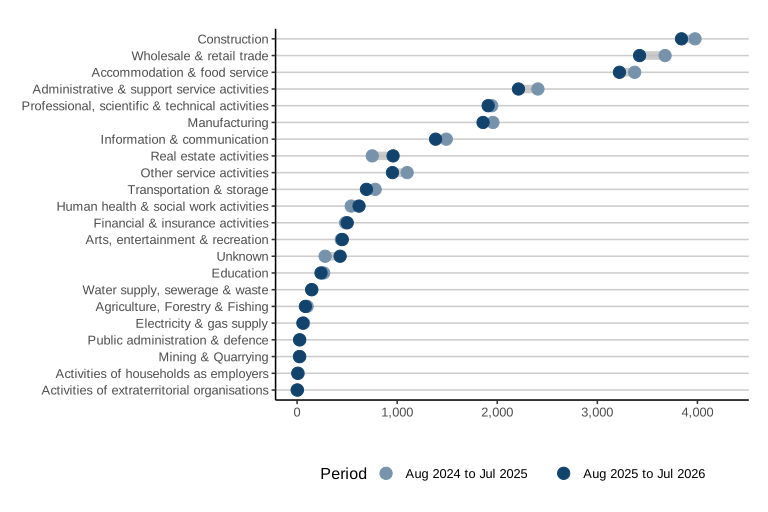
The six industries (in accordance with SIC 2007) that experienced the highest number of insolvencies in the 12 months to July 2026 were:
-
Construction (3,841, 17% of cases with industry captured),
-
Wholesale and retail trade; repair of motor vehicles and motorcycles (3,422, 15% of cases with industry captured),
-
Accommodation and food service activities (3,221, 14% of cases with industry captured),
-
Administrative and support service activities (2,212, 10% of cases with industry captured), and
-
Professional, scientific and technical activities (1,909, 8% of cases with industry captured).
-
Manufacturing (1,858, 8% of cases with industry captured).
Figure 5: For most sectors, the numbers of insolvencies in the 12 months to July 2026 were lower than those in the 12 months to July 2025.
Company insolvency by industry, England and Wales, August 2025 to July 2026 compared with August 2024 to July 2025
Source: Insolvency Service
Monthly numbers by 3-level Standard Industrial Classification back to January 2023 and annual numbers back to 2016 can be found in Table 1c of the tables accompanying this release. Record level data back to 2016 also accompanies the monthly release.
Quarterly data back to 1990 is on the National Archives website.
The numbers of insolvencies in the 12 months ending 31 July 2026 were lower than those in the preceding 12 months for most sectors. Larger industries, those that made up at least 8% of insolvencies in the 12-month period to 31 July 2026, all saw decreases, ranging from a 8% decrease in Administrative and support service activities to a 2% decrease in Professional, scientific and technical activities.
3. Company insolvency in Scotland
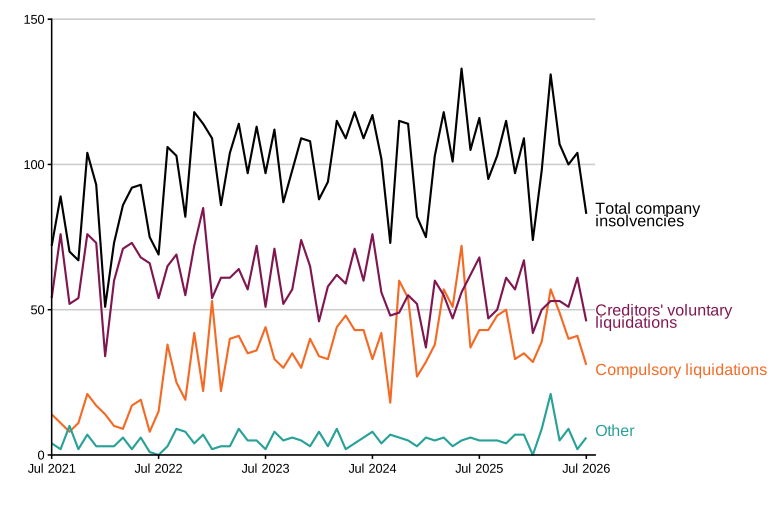
In July 2026, there were 83 company insolvencies registered in Scotland, 28% lower than the number in July 2025. The total number of company insolvencies was comprised of 46 CVLs, 31 compulsory liquidations and six administrations. There were no CVAs or receivership appointments.
Legislation relating to company insolvency in Scotland is partly devolved. Accountant in Bankruptcy (AiB), Scotland’s insolvency service, administers the Register of Insolvencies, a publicly accessible statutory register regarding the insolvency of individuals and businesses in Scotland. The Register includes company liquidations and receiverships.
This statistical release presents the numbers of compulsory liquidations, CVLs, administrations, CVAs and receivership appointments in Scotland based on their registration date at Companies House. Numbers therefore reflect company insolvency registrations rather than insolvency procedure start dates.
Historically, compulsory liquidations were the most common type of company insolvency in Scotland. However, since April 2020, numbers of CVLs have typically remained higher than numbers of compulsory liquidations.
Figure 6 shows the historical trend of company insolvencies in Scotland covering the past five years.
Figure 6: The total number of company insolvencies in Scotland was lower in July 2026 than in July 2025.
Monthly company insolvencies by type, Scotland, July 2021 to July 2026, not seasonally adjusted
Source: Insolvency Service
Monthly numbers back to January 2023 and annual numbers back to 2016 can be found in Table 4a of the tables accompanying this release. The monthly series back to January 2000, as well as record-level data back to 2016, can be found in the accompanying CSV file at the same link.
Quarterly data prior to 2000 can be found in the long-run company insolvencies CSV file.
Further breakdowns of company insolvencies by Standard Industrial Classification (SIC 2007) are also presented to three-digit level in Table 4b of the tables accompanying this release.
More statistics can be found in the AiB (Scotland’s insolvency service) statistical release.
Between 26 June 2020 and 31 July 2026, there were four restructuring plans and three moratoriums in Scotland. The two procedures were created by the Corporate Insolvency and Governance Act 2020.
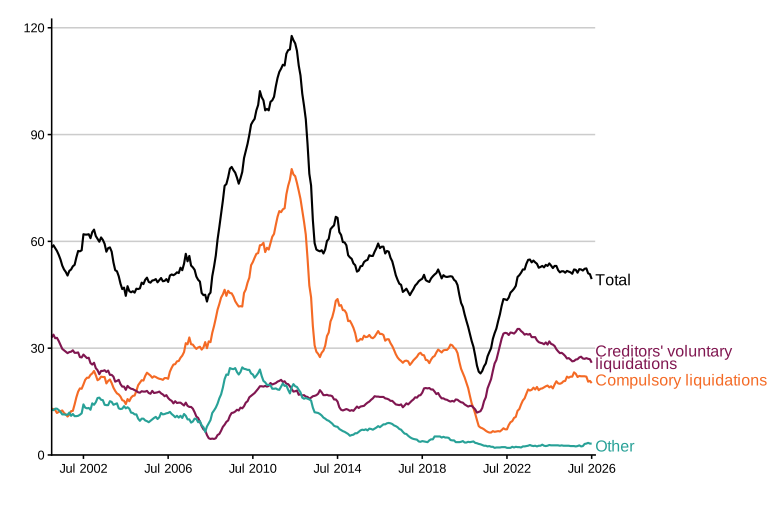
The total insolvency rate in Scotland in the 12 months to July 2026 was 49.4 per 10,000 companies on the effective register, as shown in Figure 7. This was down by 1.9 from the preceding 12 months ending July 2025.
Figure 7: The insolvency rate in Scotland was lower in the 12 months to July 2026 than the preceding 12 months.
12-month rolling insolvency rate per 10,000 companies on the effective register, January 2001 to July 2026, Scotland
Source: Accountant in Bankruptcy, Scotland
Monthly numbers back to January 2023 and annual numbers back to 2016 can be found in Table 5 of the tables accompanying this release. The monthly series back to January 2000, as well as record-level data back to 2016, can be found in the accompanying CSV file at the same link.
Quarterly data prior to 2000 can be found in the long-run company insolvencies CSV file.
More statistics can be found in the AiB (Scotland’s insolvency service) statistical release.
4. Company insolvency in Northern Ireland
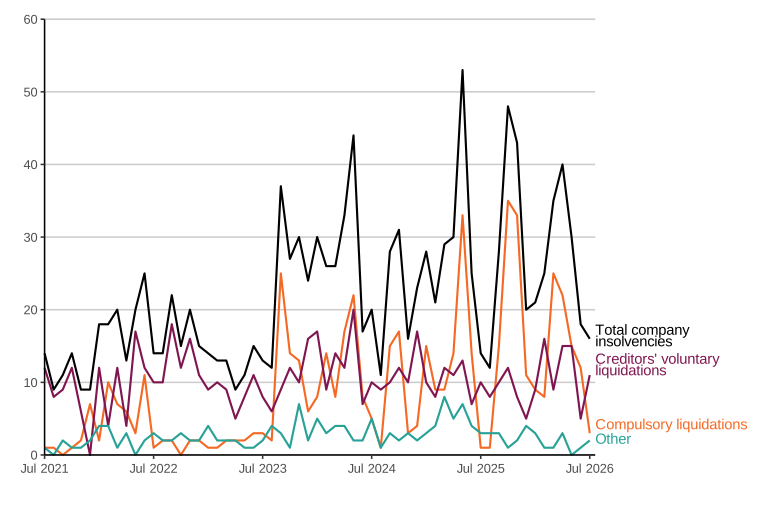
In July 2026 there were 16 company insolvencies registered in Northern Ireland, 14% higher than in July 2025. The total number of company insolvencies was comprised of three compulsory liquidations, 11 CVLs, one CVA and one administration. There were no receivership appointments.
This statistical release presents the numbers of CVLs, administrations, CVAs and receivership appointments based on their registration date at Companies House. Therefore, numbers reflect company insolvency registrations rather than insolvency procedure start dates.
Figure 8: The number of company insolvencies in Northern Ireland was 14% higher in July 2026 than in July 2025.
Monthly company insolvencies by type, Northern Ireland, July 2021 to July 2026, not seasonally adjusted
Source: Department for the Economy, Northern Ireland
Monthly numbers back to January 2023 and annual numbers back to 2019 can be found in Table 6 of the tables accompanying this release. The monthly series back to October 2009 (where available) can be found in the CSV file that also accompanies this release.
Between 26 June 2020 and 31 July 2026, there was one moratorium in Northern Ireland. There were no restructuring plans. The two procedures were created by the Corporate Insolvency and Governance Act 2020.
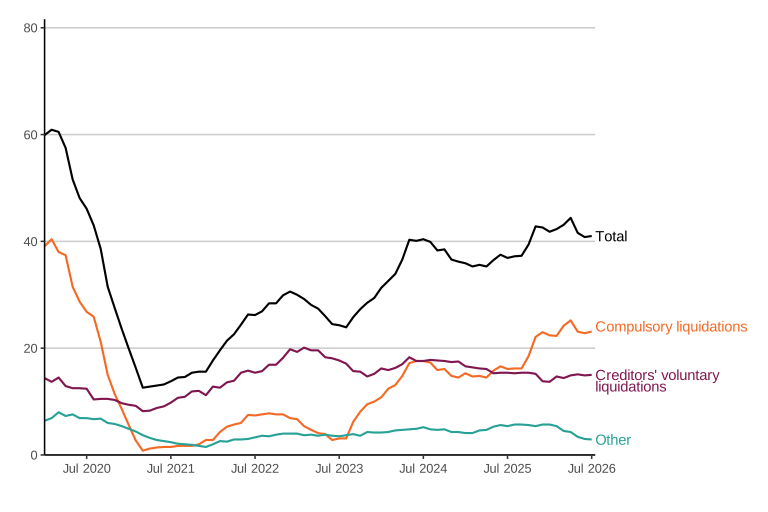
The total insolvency rate in the 12 months to July 2026 in Northern Ireland was 41.0 per 10,000 companies on the effective register, as shown in Figure 9. This is an increase of 4.1 from the 12 months to July 2025.
Figure 9: The insolvency rate in Northern Ireland was higher in the 12 months to July 2026 than in the preceding 12 months.
12-month rolling insolvency rate per 10,000 companies on the effective register, January 2020 to July 2026, Northern Ireland
Source: Insolvency Service
Monthly numbers back to January 2023 and annual numbers back to 2019 can be found in Table 7 of the tables accompanying this release. The monthly series back to October 2010 (where available) can be found in the CSV file that also accompanies this release.
5. Data and methodology
5.1 Data sources
Company insolvency data were sourced from Companies House, except for compulsory liquidation data for England and Wales, which were sourced from the Insolvency Service administrative systems, and compulsory liquidation data for Northern Ireland, which were sourced from the Department for the Economy in Northern Ireland.
To calculate insolvency rates, Companies House data were used to determine the number of companies on the effective register in each month. These data are separately published by Companies House on the Gov.uk website on a quarterly basis. Rates for intermediate months are based on the register size from Companies House management information, which is subject to revision.
More information on the administrative systems used to compile insolvency statistics can be found in the accompanying Methodology and Quality document.
5.2 Methodology and data quality
Detailed methodology and quality information for these statistics can be found in the accompanying Methodology and Quality document.
The main quality and coverage issues to note:
-
Numbers are provided at a national (England and Wales, Scotland and Northern Ireland) level only. Data on location is not provided, because address information held by the Insolvency Service relates to the address of the company on the Companies House register at the time of insolvency. This is often the address of an insolvency practitioner, a head office or a virtual office, which does not reflect the location at which the company traded before its insolvency.
-
It is a legal requirement that all formal insolvency procedures into which a company enters should be reported to the appropriate body. These statistics aim to be a complete record of registered company insolvencies. Solvent company closures such as members’ voluntary liquidations and dissolutions are not included in these statistics. Information on business closures in general can be found in the ONS Business demography publication.
-
Insolvency Service data for the most recent month were extracted approximately five working days after month end and may be revised in the future. In particular, some compulsory liquidations for the latest month may not yet have been entered onto the administrative system at the time of data extraction.
-
Bulk CVLs during the period 2016 to 2019 (see Glossary) have been removed from numbers presented in these statistics. Numbers with bulk CVLs included can be found in Table 1d of the accompanying tables.
Seasonal adjustment
Underlying data for these monthly statistics for England and Wales were adjusted using an ARIMA model where there was evidence of seasonality. The ARIMA model removes systematic calendar-related variation in the time series. This enables comparisons to be made between months and underlying trends in insolvency numbers to be determined. In accordance with the outcome of the April 2025 Seasonal Adjustment Review, compulsory liquidations, creditors’ voluntary liquidations (CVLs) and administrations were all seasonally adjusted.
Seasonal adjustment in this publication typically results in numbers being adjusted by up to 10%. There are a few cases where the adjustment is larger. For example, compulsory liquidation numbers tend to be 20-30% lower during April, which often contains Easter. Therefore, when Easter is in April, the process of seasonal adjustment increases the April compulsory liquidation numbers by approximately 20-30% to correspond to the underlying trend.
For Scotland and Northern Ireland, only the unadjusted series have been presented, as agreed with the appropriate officials in the devolved administrations.
Rates of insolvency
Insolvency rates were calculated for England and Wales, Scotland and Northern Ireland. The total number of companies entering insolvency in each location during the previous twelve months was divided by the mean average number of all companies on the effective Companies House register in that location in the same twelve-month period.
5.3 Revisions
These statistics are subject to revisions, as set out in the published Revisions Policy. Revisions tend to be made when data is entered into administrative systems after the cut-off date for data extraction to produce the statistics. In addition, as the ARIMA model used is updated with additional data each month, seasonally adjusted numbers are revised in subsequent publications. Revisions are noted in the accompanying data tables, except those resulting from changes to the seasonal adjustment model.
6. Glossary
6.1 Key terms used within this statistical bulletin
| Term | Definition |
|---|---|
| Administration | The objective of administration is to rescue the company as a going concern, or, if this is not possible, to obtain a better outcome for creditors than would be likely if the company were to be wound up. A licensed insolvency practitioner, ‘the administrator’, is appointed to manage a company’s affairs, business and property for the benefit of the creditors. |
| ARIMA model | Autoregressive integrated moving average, or ARIMA, is a model fitted to time-series data to understand the underlying trend or to forecast future data points. In this publication, ARIMA models with both non-seasonal and seasonal components are fit to insolvency data. The model removes the seasonal component of the data, including effects resulting from the time of year, as well as the varying number of trading days in different months. This allows month-to-month comparisons to be made. |
| Bulk creditors’ voluntary liquidation | IR35 rules are intended to prevent the avoidance of tax and National Insurance contributions using personal service companies and partnerships. Between April 2016 and early 2019, following changes to the IR35 rules and/or changes in VAT flat rate, some directors of personal service companies had cited these changes as the primary reason that their company’s activities had become unviable. This led to large numbers of creditors’ voluntary liquidations (CVLs) among these companies, a phenomenon referred to as “bulk insolvencies”. |
| Company voluntary arrangement (CVA) | Company voluntary arrangements (CVAs) are another mechanism for business rescue. They are a voluntary means of repaying creditors some or all of what they are owed. Once approved by 75% or more of creditors, the arrangement is binding on all creditors. CVAs are supervised by licensed insolvency practitioners. |
| Compulsory liquidation | A winding-up order obtained from the court by a creditor, shareholder or director. See ‘Liquidation’ for details on the process. |
| Creditors’ voluntary liquidation (CVL) | Shareholders of a company can themselves pass a resolution that the company be wound up voluntarily. See ‘Liquidation’ for details on the process. Administrations which result in a creditors’ voluntary liquidation (CVL) are recorded separately by Companies House and are excluded from CVL figures, as they do not represent a new company entering into an insolvency procedure for the first time. These cases are only ever recorded as administrations. |
| Liquidation | Liquidation is a legal process in which a liquidator is appointed to ‘wind up’ the affairs of a limited company. The purpose of liquidation is to sell the company’s assets and distribute the proceeds to its creditors. At the end of the process, the company is dissolved – it ceases to exist. Statistics on compulsory liquidations and creditors’ voluntary liquidations are presented in these statistics. A third type of winding up, members’ voluntary liquidation, does not involve insolvency. Therefore, members voluntary liquidations are not included here. |
| Moratorium | Moratoriums were introduced under the Corporate Insolvency and Governance Act 2020 to give struggling businesses formal breathing space in which to explore rescue and restructuring options, free from creditor or other legal action. Except in certain circumstances, no insolvency proceedings can be instigated against the company during the moratorium period. A moratorium also prevents legal action being taken against a company without permission from the court. |
| Receivership appointments | Administrative receivership occurs when a creditor with a floating charge (often a bank) appoints a licensed insolvency practitioner to recover the money owed to them. Before 2000, receivership appointments could also involve non-insolvency procedures, such as those under the Law of Property Act 1925. The use of this procedure is restricted to certain types of companies, or to floating charges, created before September 2003. |
| Restructuring plan | New restructuring measures were introduced under the Corporate Insolvency and Governance Act 2020 to support viable companies struggling with unmanageable debt obligations to restructure under a new procedure. They allow the court to sanction a plan that binds creditors to a restructuring plan if it is fair and equitable. Creditors vote on the plan, but the court can impose it on dissenting classes of creditors (‘cram down’) provided that the necessary conditions are met. |
| Standard Industrial Classification (SIC 2007) | Used in classifying business establishments and other statistical units by the type of economic activity in which they are engaged. Further information can be found on the ONS website. |