Companies register activities: 2020 to 2021
Published 24 June 2021

© Crown copyright 2021
This publication is licensed under the terms of the Open Government Licence v3.0 except where otherwise stated. To view this licence, visit nationalarchives.gov.uk/doc/open-government-licence/version/3 or write to the Information Policy Team, The National Archives, Kew, London TW9 4DU, or email: psi@nationalarchives.gov.uk.
Where we have identified any third party copyright information you will need to obtain permission from the copyright holders concerned.
This publication is available at https://www.gov.uk/government/statistics/companies-register-activities-statistical-release-2020-to-2021/companies-register-activities-2020-to-2021
1. Introduction
This release provides information about the population of companies and corporate bodies in the UK. Companies and corporate bodies are specific legal forms of business that are registered at Companies House. Companies form a subset of corporate bodies and are formed under the Companies Act 2006. Companies and corporate bodies are registered at Companies House regardless of whether they go on to trade actively. Full definitions of both companies covered by the Companies Act 2006 and corporate bodies are provided in the separate Companies House official statistics: definitions to accompany statistical releases document. This document also explains the incorporation, dissolution and restoration processes.
This release complements the quarterly Incorporated Companies in the UK release by providing information on both companies to which the Companies Act 2006 relates, and on wider corporate body types. Sections 2 to 4 of the release focus specifically on companies, while sections 5 and 6 cover all corporate body types. Some figures in this release may differ to those provided in the quarterly Incorporated Companies in the UK publications due to the timing of the analysis. Analyses for the figures in this release are undertaken later in the year, allowing more information to be processed and added to the register.
The statistics in this release include the total number of incorporated companies, newly incorporated companies, and the number of companies that were dissolved. The release focusses on the headline messages for the UK: figures for the constituent countries are contained in the supplementary tables that accompany the release.
Key points
-
The total register size at the end of March 2021 was 4,716,126, an increase of 8.4% when compared with the end of March 2020.
-
There were 810,316 company incorporations in 2020/21. This is an increase of 21.8% when compared with 2019 to 2020. 2020 to 2021 saw the highest number of incorporations on record. Throughout the year incorporations have observed fluctuations which coincided with government instigated lockdown measures and the subsequent easing of them in response to the coronavirus (COVID-19) pandemic.
-
In 2020 to 2021, there were 437,790 dissolutions in the UK, a year on year decrease of 18.5%. This is the lowest number of dissolutions since 2016 to 2017 and has been impacted by easements announced by Companies House in response to the coronavirus (COVID-19) outbreak and national lockdown measures.
-
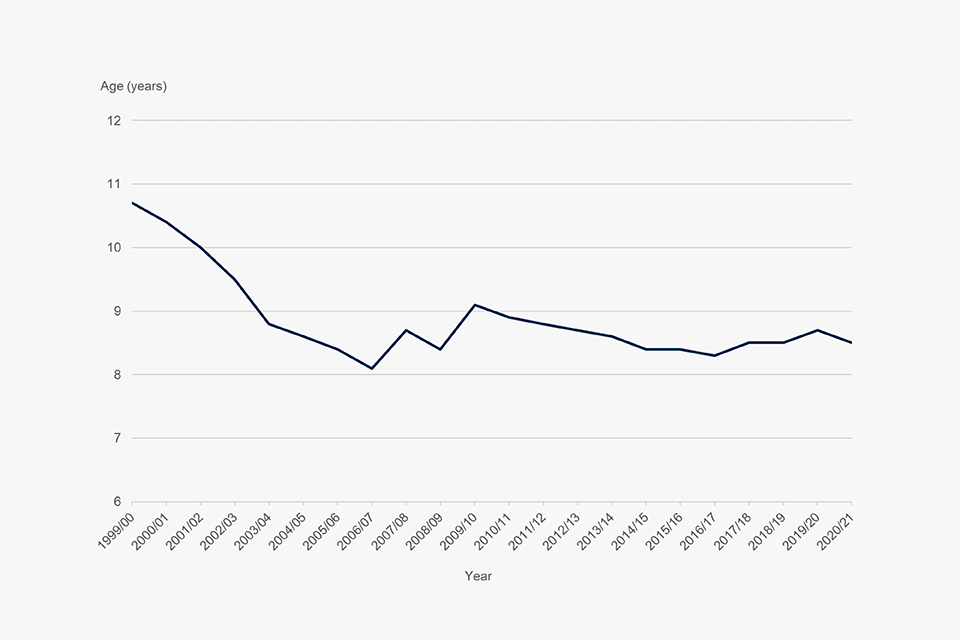
The average age of a company on the total register at the end of March 2021 was 8.5 years. Despite fluctuations in recent years, the average age of a company has gradually declined from 10.7 years at the end of March 2000.
-
Since 2004, private limited companies have consistently accounted for over 96% of all corporate body types. During this time, the three corporate body types accounting for the highest proportion of all corporate body types have remained unchanged. These are private limited companies, limited partnerships and limited liability partnerships.
-
At the end of March 2021, the number of overseas companies on the register with a physical presence in the UK increased reaching 12,475, when compared with 12,300 at the end of March 2020. The largest share of overseas corporate bodies on the register originated in the USA, which accounted for 20.6% of all overseas companies.
Key events
-
In response to the coronavirus (COVID-19) outbreak and national lockdown measures introduced in March 2020, a set of easements were announced by Companies House on 16 April 2020. They included the temporary pause of the strike off process (voluntary and compulsory) to give businesses affected by the coronavirus outbreak the time they needed to update their records filed with Companies House and help them avoid being struck off the register. The impact of this announcement was that compulsory dissolutions from 2 April 2020 onwards were temporarily paused, as was the final stage of voluntary dissolutions.
-
On 10 September 2020 the voluntary strike off process resumed via a phased release through the remainder of September and into October. This removed the majority of companies that applied to be struck off before July 2020 and included some companies that filed for dissolution before the first UK wide coronavirus (COVID-19) lockdown began in March 2020. The release of paused compulsory dissolutions began on 10 October 2020.
-
In response to the ongoing coronavirus (COVID-19) pandemic, there was a second pause of the voluntary and compulsory strike off processes between 21 January and 8 March 2021. Companies House temporarily paused the strike off processes so that companies and creditors would not be adversely affected by processing delays.
2. Incorporated companies
The total register size – including those in the process of dissolution and liquidation (305,890) – at the end of March 2021 was 4,716,126. This is an increase of 8.4% when compared with the end of March 2020. The effective register, which does not include those in the process of dissolution or liquidation, at the end of March 2021 was 4,410,236.
The total register increased in size across all constituent countries of the UK – England and Wales increased by 8.6%, Northern Ireland increased by 7.4% and Scotland increased by 5.6%.
Figure 1: The number of companies on the total register by region at the end of March 2021
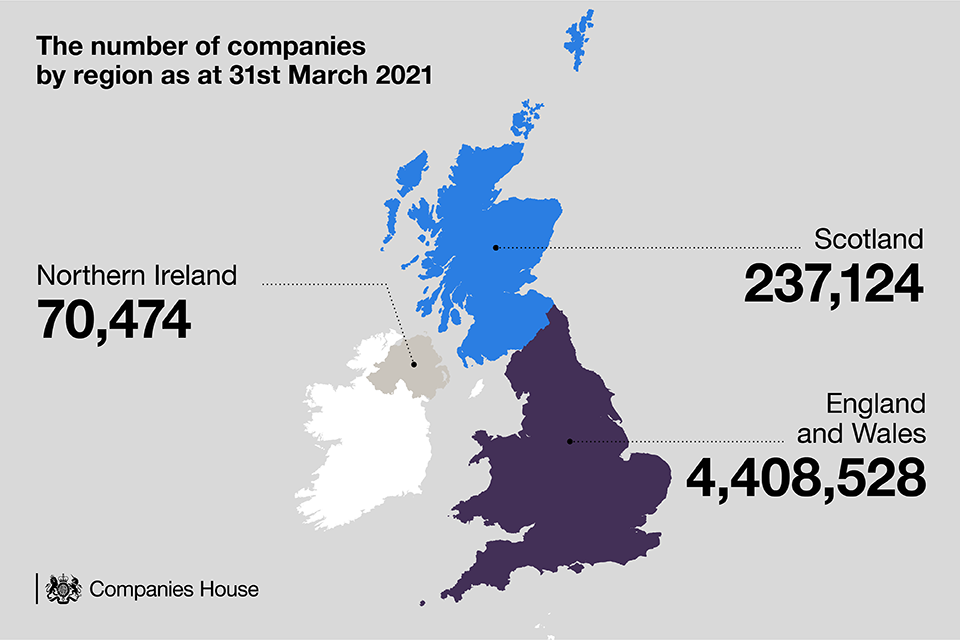
The number of companies by region as at 31 March 2021 - Scotland 237,124, Northern Ireland 70,474, England and Wales 4,408,528 [Source: Companies register activities 2020 to 2021, Companies House.]
During 2020 to 2021, there were 810,316 company incorporations, a year on year increase of 21.8%. 2020 to 2021 saw the highest number of incorporations on record. Throughout the year incorporations have fluctuated which coincided with government instigated lockdown measures and the subsequent easing of them in response to the coronavirus (COVID-19) pandemic.
In the same year, there were 437,790 dissolutions, a decrease of 18.5% compared with 2019 to 2020. This is the lowest number of dissolutions since 2016 to 2017 and has been impacted by multiple easements announced by Companies House in response to the coronavirus (COVID-19) outbreak and national lockdown measures.
The highest rate of decrease in the number of dissolutions in 2020 to 2021 were found in England and Wales (18.9%), followed by Northern Ireland (14.7%) and Scotland (10.1%).
Despite fluctuations, the number of incorporations and dissolutions over time have increased at a steady rate. There were 692,516 more incorporations in 2020 to 2021 compared with the number of incorporations in 1986 to 1987, when the reporting of financial-year data began. There were 353,590 more dissolutions in 2020 to 2021 when compared to 1986 to 1987.
Chart 1: UK incorporations and dissolutions from 1979 to 2021
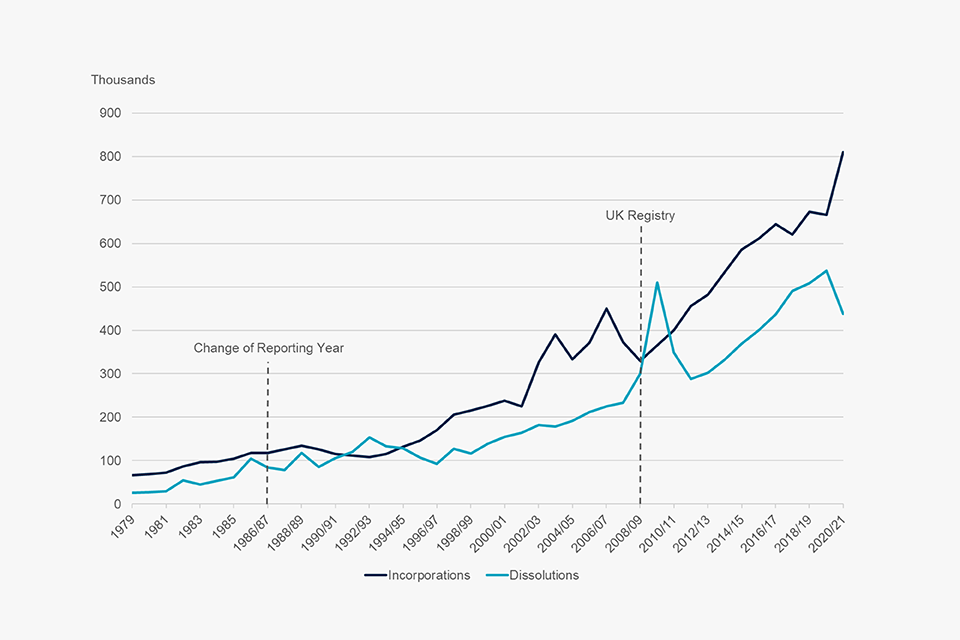
Source: Companies register activities 2020 to 2021, Companies House.
During 2020 to 2021 there were 10,438 compulsory liquidations, a year on year decrease of 36.6%. In the same year, there were 14,910 members’ voluntary liquidations, an increase of 29.7% compared with 2019 to 2020. These movements were observed in all constituent countries. There were 27,349 liquidations and other insolvency proceedings in total during 2020 to 2021, a decrease of 11.0% compared with 2019 to 2020.
For more information, see Company insolvency statistics releases.
A full breakdown of figures for England and Wales, Scotland, Northern Ireland and the UK as a whole is provided in Table A1 in the Excel workbook that accompanies this release. Figures are provided for the years 2012 to 2013 through to 2020 to 2021. Separate figures for private companies and public limited companies are provided in Tables A2 and A3, respectively. Liquidation figures are provided in Table A10.
3. The growth in the register size over time
Between 1979 and 2021, the total register has increased by 3.9 million companies, whilst the effective register has increased by 3.7 million companies[footnote 1][footnote 2].
During this time, the total register has seen 38 annual increases, whilst the effective register has increased 36 times over the same period. The most recent declines in the Great Britain effective register occurred in 2008 to 2009, with a decrease of 157,700 companies. The UK total register declined a year later in 2009 to 2010, with a decrease of 88,316 companies.
In the late 2000s, it was anticipated that the register size would increase due to the introduction of Northern Ireland companies to the UK register. However, this may have been offset by the global financial crisis during the same period leading to a slight decrease in the register size overall.
During the period 2009 to 2010 there were also several significant changes to the register:
- the Northern Ireland register was included to create a UK register, as mentioned above
- there was a change in the administrative system that forms the register
- there was a purge on the register to remove defunct companies that had spent an extended period in the process of dissolution or liquidation
- legislative changes were introduced under the Companies Act 2006, which reduced the time taken to dissolve companies and remove them from the register
These changes in combination are likely to have contributed to a sharp increase in the number of dissolutions between 2009 and 2010. This may in turn have had an impact on the sizes of the total and effective registers overall.
Since 2010 to 2011, both registers have continued to increase steadily in size.
Between 2012 to 2013 and 2020 to 2021, the average growth rate for the total and effective registers was 5.7% and 6.0%, respectively. During 2020 to 2021, the growth rates increased to 8.4% for the total register and 8.5% for the effective register.
Chart 2: UK total and effective register sizes from 1979 to 2021
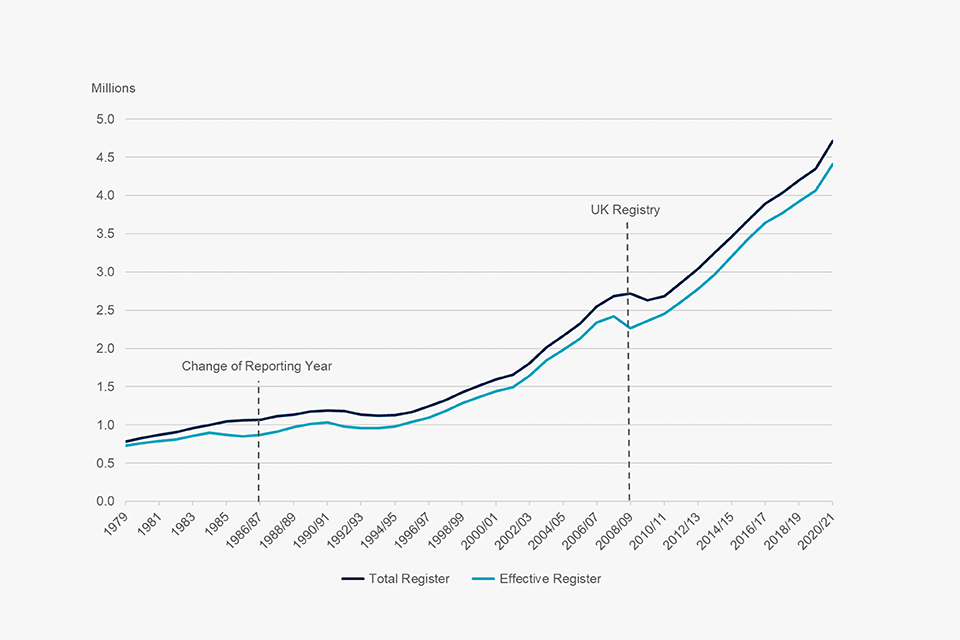
Source: Companies register activities 2020 to 2021, Companies House.
Table A8, in the workbook that accompanies this publication, shows the total and effective register sizes from 1939 to 2020 to 2021, as well as the annual number of incorporations, dissolutions and liquidations.
4. Age of companies on the register
The average age of UK companies on the total register in 2020 to 2021 was 8.5 years, a decrease compared with the previous year, which was 8.7 years. Within both the total and effective registers for 2020 to 2021, almost half of the companies were aged under 5 years (48.2% and 48.5% respectively).
Over two-thirds (71.1% for the total register and 71.1% for the effective register) were under 10 years, whilst just over one in ten companies were aged over 20 years on both the total and effective registers (10.4% and 10.2%, respectively).
Chart 3: Age profile of companies on the total UK register for 2021
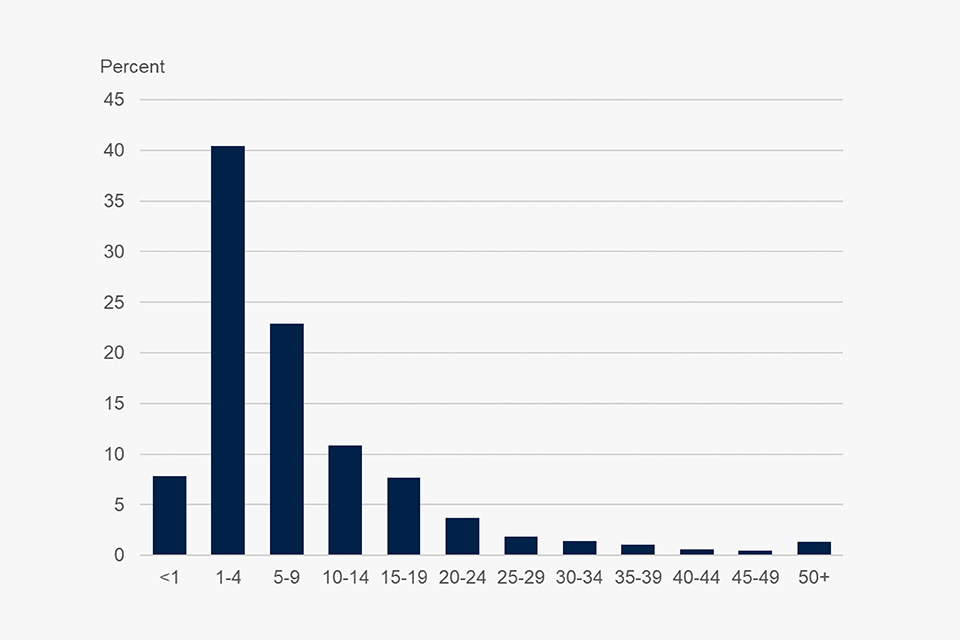
Source: Companies register activities 2020 to 2021, Companies House.
Historically, the average age of a company has always been relatively young. However, the average age has gradually declined from 10.7 years in 1999 to 2000 to 8.5 years in 2020 to 2021. Between 2008 to 2009 and 2010 to 2011, the average age of a company fluctuated. This corresponds with changes in the numbers of incorporations, dissolutions, and in the overall register size.
Since 1999 to 2000, the steady decline in the average age of a company could be due to the general increasing trend we have seen in the number of incorporations and dissolutions. It is likely that the increasing number of incorporations has led to a greater number of younger companies on the register, which has served to lower the average age of companies overall.
The average age of a dissolved or closed company has declined from 5.7 years in 2012 to 2013 to 5.3 years in 2020 to 2021.
Chart 4: Average age of a company on the UK total register from 2000 to 2021
Source: Companies register activities 2020 to 2021, Companies House.
Table A5, in the workbook that accompanies this release, shows the age profile of companies on the total and effective registers at 31 March 2021, as well as those in liquidation or the course of dissolution. The table also shows the average age of a company from 1999 to 2000 to 2020 to 2021. Table A11 shows the average age of dissolved and closed companies from 2012 to 2013 to 2020 to 2021, while Table C3 shows average ages at closure and dissolution across all corporate body types.
5. Types of corporate body on the register
There are 30 types of corporate body held on the register. These include a number of corporate body types in addition to those companies covered by the Companies Act 2006.
Each corporate body type has a distinct set of requirements, as outlined in various pieces of legislation and royal acts. This information is provided to Companies House. Further information on each company type can be found in the Companies House guidance.
Since 2004, private limited companies have consistently accounted for over 96% of all corporate body types. During this time, the 3 corporate body types accounting for the highest proportion of all corporate bodies have remained unchanged. These are private limited companies, limited partnerships and limited liability partnerships (LLPs).
These 3 corporate body types have consistently accounted for over 98% of all corporate body types.
Table 1: Breakdown of corporate body types on the UK total register for 2020 to 2021
| Corporate body type | Number | Percentage of all corporate bodies |
|---|---|---|
| Private Limited | 4,539,191 | 93.0 |
| Private Limited by Guarantee/No Share Capital | 125,478 | 2.6 |
| Limited Partnership | 54,604 | 1.1 |
| Limited Liability Partnership | 52,262 | 1.1 |
| Private Limited by Guarantee/No Share Capital/(Use of Limited Exemption) | 40,920 | 0.8 |
| Charitable Incorporated Organisation | 25,028 | 0.5 |
| Overseas Company | 12,910 | 0.3 |
| Registered Society | 11,984 | 0.2 |
| Public Limited Company | 6,103 | 0.1 |
| Other corporate body types | 12,607 | 0.3 |
| Total of corporate body types | 4,881,087 | 100.0 |
Although the composition of the register overall has remained stable, there have been some minor fluctuations within the individual company types:
- Charitable Incorporated Organisations (CIOs) were introduced in late 2017. The Charity Commission allowed charitable companies to convert to CIOs. This is an incorporated structure designed for charities and needs to be registered with the Charity Commission. For the financial year of 2020 to 2021, there were 25,028 CIOs in England, Wales and Northern Ireland (0.5% of all corporate bodies) and 4,950 Scottish CIOs (0.1% of all corporate bodies). Since 2017 to 2018, the number of CIOs has increased, with average annual growth rates in England, Wales and Northern Ireland being 22.4%, whilst Scotland has seen an average annual growth rate of 14.4%.
- Limited liability partnerships (LLPs) were introduced in 2001. These gradually increased in number to make up 1.8% of the register in the years 2012 to 2013 and 2013 to 2014. The proportion of LLPs has since gradually declined, and they now account for 1.1% of the register.
- Limited partnerships have grown from 0.5% of the register at the end of 2004 to 1.1% at the end of March 2021. This has been primarily due to large increases in the numbers of limited partnerships in Scotland between 2012 and 2013 and they continue to make up a large share of limited partnerships on the register.
- Public limited companies have been declining in number since 2008. They now make up only 0.1% of the register overall.
- Due to the UK’s exit from the European Union, the majority of Europeans EIGs and Europeans SEs became part of the UK Economic Interest Grouping and UK Societas.
Although these changes are small, they show the subtle ways in which the composition of the register is changing outside of private limited companies.
Table C1, in the workbook that accompanies this publication, displays numbers and percentages of all corporate body types on the register from 2004 to 2021. Further information on public limited companies, limited partnerships and limited liability partnerships is available in tables A3, B2 and B4, respectively.
6. Overseas corporate bodies with a physical presence in the UK
At the end of March 2021, there were 12,475 overseas corporate bodies on the total register.
Overseas corporate bodies are incorporated outside of the UK but have a physical presence in the UK (such as a place of business or branch) through which they carry out their business.
At the end of March 2021, the largest share of overseas corporate bodies on the register originated in the USA. This accounted for 2,574 (20.6%) of all overseas companies. The Republic of Ireland, the second highest originating country, accounted for 1,134 (9.1%).
The top 10 countries incorporating corporate bodies in the UK in 2020 to 2021 are consistent with those of the previous year. These countries accounted for 63.9% of all overseas corporate bodies on the total register at the end of March 2021.
Figure 2: Top 10 originating countries for overseas corporate bodies, 31 March 2021
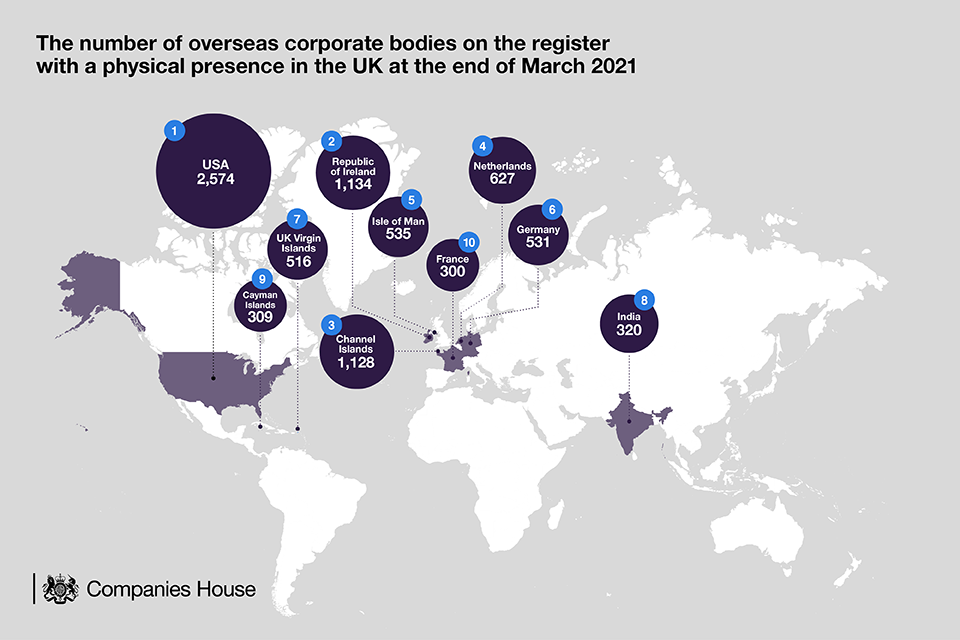
USA 2,574, Republic of Ireland 1,134, Channel Islands 1,128, Netherlands 627, Isle of Man 535, Germany 531, UK Virgin Islands 516, India 320, Cayman Islands 309, France 300. [Source: Companies register activities 2020 to 2021, Companies House.]
There were 793 new incorporations for overseas corporate bodies in 2020 to 2021. Of these, 154 (19.4%) originated in the Channel Islands, 88 (11.1%) in the Republic of Ireland, 82 in the UK Virgin Islands (10.3%), and 78 (9.8%) in the USA.
Table 2: Registrations of corporate bodies incorporated outside the UK in 2020 to 2021 for the top 10 originating countries
| Country of incorporation | New incorporations | Percentage of all incorporations |
|---|---|---|
| Channel Islands | 154 | 19.4 |
| Republic of Ireland | 88 | 11.1 |
| UK Virgin Islands | 82 | 10.3 |
| USA | 78 | 9.8 |
| Netherlands | 57 | 7.2 |
| Germany | 42 | 5.3 |
| Isle of Man | 23 | 2.9 |
| France | 21 | 2.6 |
| Italy | 18 | 2.3 |
| Australia | 17 | 2.1 |
| Total | 580 | 73.1 |
Full figures on registrations of corporate bodies incorporated outside the UK from 2013 to 2014 to 2020 to 2021, as well as numbers on the register at 31 March 2021, are provided in table B1.
7. Other statistics in this release
A range of other statistics are included in the tables that accompany this release, including:
- analysis of companies on the register by period of incorporation
- removals of companies from the register
- other corporate bodies administered at Companies House, including limited partnerships and limited liability partnerships
A range of management information tables are due to be published later in the summer, providing the following information:
- civil penalties for late filing of annual accounts
- disqualification orders notified to the Secretary of State in the UK
- prosecutions by the department under the Companies Act 2006
- number of documents filed at Companies House
- annual accounts registered at Companies House by accounts type
8. Background notes
This section provides a range of information designed to provide the user with more information about the statistics.
Definitions
A separate document is available providing definitions for the main terms used in Companies House official statistics publications.
Quality
Information relating to the quality of the statistics is provided in a separate quality document. This document provides information on the quality of Companies House’s official statistics, to enable users to judge whether or not the data are of sufficient quality for their intended use. The information is structured in terms of the quality dimensions of the European Statistical System. The document also provides information on how these statistics relate to selected other business statistics.
Coverage
This release provides information on the size of the company population and the changes that have occurred within the year. The release includes statistics for the UK, England and Wales, Northern Ireland, and Scotland. The statistics cover companies and corporate bodies, both of which are specific legal forms of businesses that are registered at Companies House. They do not include information on sole proprietorship businesses, partnerships, and charities.
Use and users
Companies House statistics are used extensively by government, the public, public bodies and businesses. For example, they are used by:
- government in understanding the likely impact of policy changes and monitoring the impact of economic changes on companies
- businesses in understanding their market share and planning marketing strategies
- banks in developing an understanding of their customer base
- foreign firms in making UK location decisions
- academics to inform research into businesses at local and national level
- a range of public bodies in decision making and evaluating business-related policies
Revisions to these statistics
Revisions to these statistics will be mainly due to changes in methodologies and source data. The statistics are derived from administrative data, and changes to the underlying methods will cause revisions. These include changes in statistical methods, definitions, classifications, and geographic coverage.
Although Companies House has robust procedures in place to minimise errors in the methods used to create these statistics, errors may occasionally occur. If errors are found after the publication, their impact will be assessed. If the changes are significant, a corrigendum will be issued as soon as possible. Minor corrections will be included in the next planned release.
Any misleading or incorrect figures will be amended, and a footnote added to indicate that the figures have been corrected. The nature and reason for the correction will be explained.
Date of next release
Statistics for the 12 months to March 2022 will be published 30 June 2022. The publication date will be announced on our release calendar.
-
Statistics for 1979 to 2008 are for Great Britain. In October 2009, the Northern Ireland register merged with the register for Great Britain to create a UK register. Figures from 2009 to 2010 onwards are for the UK as a whole. ↩
-
Figures for 1979 to 1986 are for the calendar year 1 January to 31 December. Those for 1986 to 1987 to 2019 to 2020 are for the financial year 1 April to 31 March. ↩