Community Life Survey 2021/22: Identity and social networks
Updated 3 May 2023
Applies to England

© Crown copyright 2023
This publication is licensed under the terms of the Open Government Licence v3.0 except where otherwise stated. To view this licence, visit nationalarchives.gov.uk/doc/open-government-licence/version/3 or write to the Information Policy Team, The National Archives, Kew, London TW9 4DU, or email: psi@nationalarchives.gov.uk.
Where we have identified any third party copyright information you will need to obtain permission from the copyright holders concerned.
This publication is available at https://www.gov.uk/government/statistics/community-life-survey-202122/community-life-survey-202122-identity-and-social-networks
The Community Life Survey is a household self-completion survey (online survey with a paper survey for those not digitally enabled) of adults aged 16+ in England. This chapter summarises results related to identity and social networks from the 2021/22 survey, which ran from October 2021 to September 2022.
Differences between groups are reported on in this publication only where they are statistically significant i.e. where we can be confident that the differences seen in our sampled respondents reflect the population.[footnote 1]
1. Social interactions
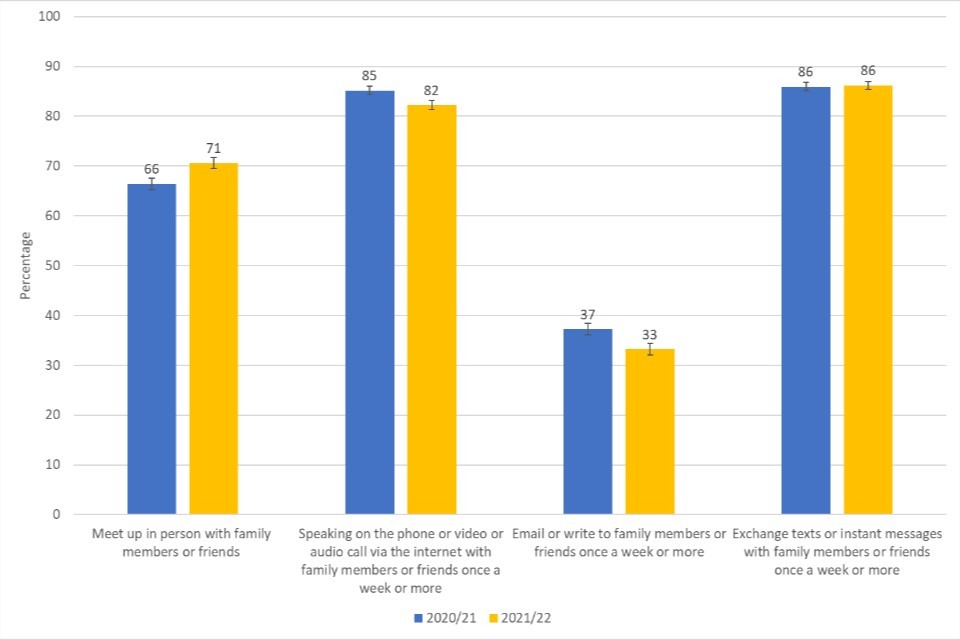
Respondents were asked how often they communicated with family members and friends via a range of methods. When looking at those who used different methods once a week or more:
86% exchanged texts or instant messages.
The percentage of respondents who exchange text or instant messages has remained consistent between 2020/21 and 2021/22 (86%), following a steady increase since 2013/14 (76%)
82% spoke on the phone/video call.
The percentage of respondents speaking on the phone/video calls with friends/family has decreased since 2020/21 (when it was the highest the CLS has measured) from 85% to 82%, however is in line with levels from 2013/14 to 2019/20 (81% in 2019/20)
71% met up in person.
71% of respondents met up in person with friends/family at least once a week, a statistically significant increase from 2020/21 where the figure was 66%, though still lower than levels in 2019/20 (74%).
33% emailed or wrote.
The percentage of respondents emailing/writing has significantly decreased from 37% in 2020/21 to 33% in 2021/22; the lowest level recorded by the CLS.
It is likely that the above measures have been affected by the COVID-19 pandemic, and the associated restrictions and guidance in place in the UK at the times of surveying. However, as the survey did not include questions directly relating to the pandemic, we can not be definitive that changes between the 2021/22 survey and recent years can be fully attributed to COVID-19.
Figure 1.1: Methods of communicating with family or friends, 2020/21 - 2021/22
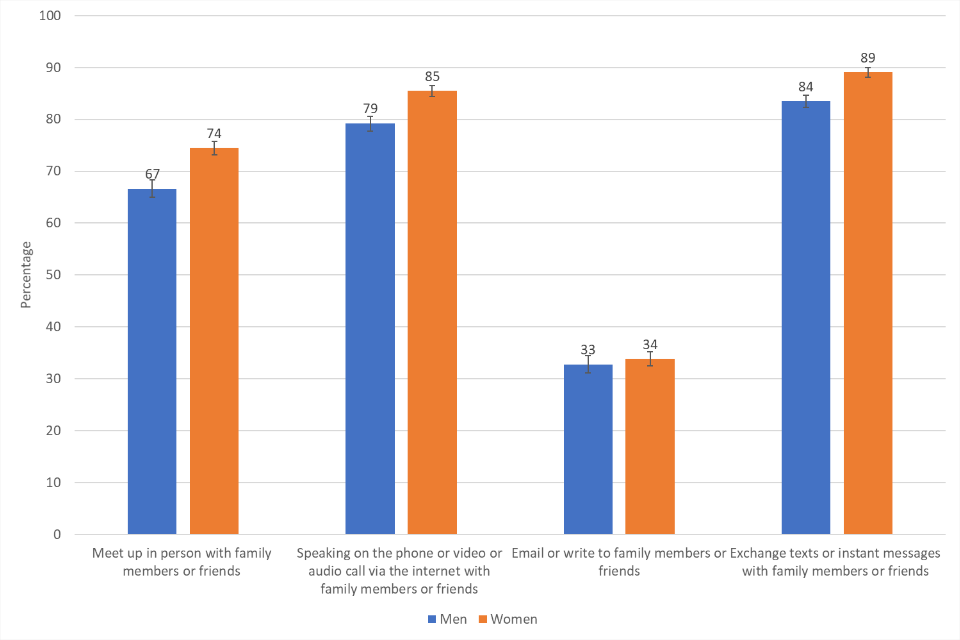
Respondents identifying as female were more likely than those identifying as male to communicate with friends/family by meeting up in person, speaking on the phone/video call or exchanging text or instant messages. The most notable difference was for meeting up in person, with 74% of females doing so at least once a week compared with 67% of males. No difference was seen between males and females for emailing and writing.
Figure 1.2: Methods of communicating with family or friends once a week or more by gender,[footnote 2] 2021/22
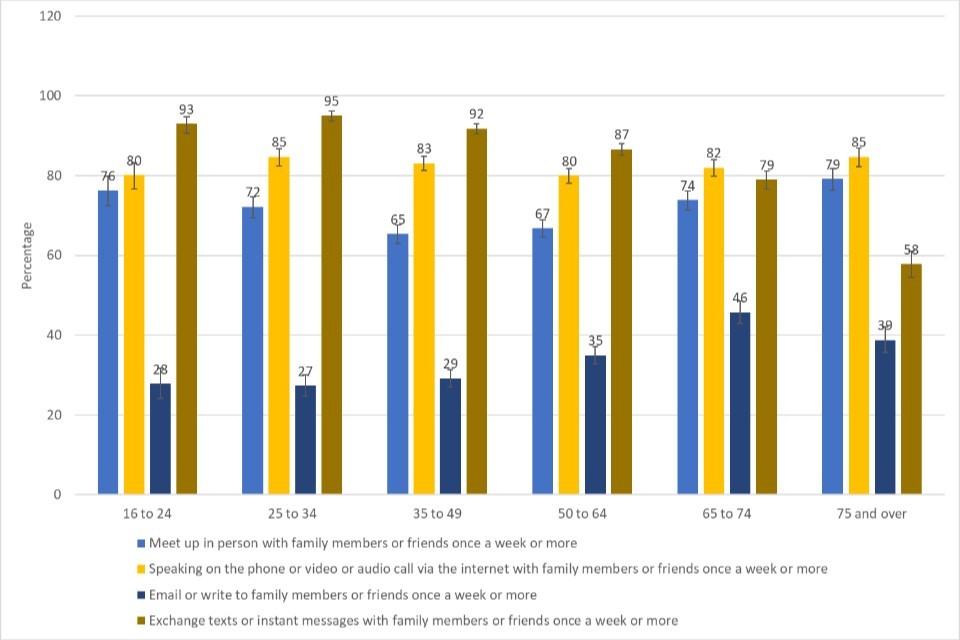
In terms of findings by age group:
Those in the age group 75+ were more likely to meet up in person with friends or family (79%) than respondents aged 25-34, 35-49 and 50-64 years old (72%, 65% and 67% respectively).
Those in the age group 50–64 were less likely to speak on the phone/video call (80%) than respondents aged 25-34 and 75+ (both 85%).
Those in age groups 16-24, 25-34 and 35-49 were more likely to exchange texts or instant messages with friends or family (92 to 95%) than those aged 50-64, 65-74 and 75+ (58 to 87%).
Those in age groups under 50 (16-24, 25-34 and 35-49) were less likely to email or write (26 to 29%) than those aged 50-64, 65-74 and 75+ (35 to 45%).
Figure 1.3: Methods of communicating with family or friends once a week or more by age, 2021/22
When looking at ethnic groups:
Respondents who identified as being from a white ethnic group were more likely to meet up with friends and family in person (72%) at least once a week than respondents identifying as from an Asian ethnic group or black ethnic group (62% and 58% respectively).
There were no differences observed between respondents identifying across different ethnic groups for speaking on the phone or video calling with family or friends at least once a week.
Respondents identifying as being from a black ethnic group were more likely to email or write to family members at least once a week (43%) than respondents identifying as being from a white ethnic group or Asian ethnic group (32% and 33%) respectively) - those identifying from other ethnic groups were also more likely to email or write to family members than those from white ethnic groups (45% vs 32% respectively).
Respondents identifying from a mixed ethnic group were more likely to exchange texts with family members or friends at least once a week than respondents identifying from a white ethnic group (93% vs 86%).
Those without a limiting long term illness or disability were more likely to exchange texts/instant messages (89% vs 81%) at least once a week than those with a long term limiting illness or disability.
When looking at regional differences:
Some regional variability was seen, with those in London less likely to meet up in person (67%) at least once a week than those in the North West (74%), North East (78%), and Yorkshire and The Humber (74%). Those in the North East were also more likely to meet up in person at least once a week than those in the East (69%) and the South West (67%).
However respondents in London were more likely to email or write to their family and friends (41%) at least once a week than those in the North East (26%), North West (29%), Yorkshire and the Humber (28%), East Midlands (30%), West Midlands (32%) and the East of England (33%).
Those in London were also more likely to exchange texts with family or friends (89%) at least once a week than respondents in the East of England (85%), North West (85%), East Midlands (84%), and West Midlands (84%).
No significant variation was seen in those speaking on the phone/video call with family or friends at least once a week by region.
Across urban and rural areas, methods of communication were broadly similar.
Respondents living in the most deprived areas, as measured by the Index of Multiple Deprivation,[footnote 3] were less likely to email or write to family or friends at least once a week (30%) versus respondents from the least deprived areas (quintile 4, 35% and quintile 5, 36%). Other forms of communication were broadly similar across deprivation quintiles.
2. Support networks
Overall, most respondents said there were people available if they needed support:
96% agreed that there is at least one person they can really count on to listen when they need to talk.
95% either definitely agreed or tended to agree that if they needed help there are people who would be there for them.
92% either definitely agreed or tended to agree that if they wanted company or to socialise there are people they could call.
These estimates remain broadly similar to those in 2020/21 and have remained consistent since 2013/14.
Respondents identifying as female were more likely than those identifying as male to agree that if they wanted company or to socialise there are people they could call (94% vs 91%).
Respondents identifying as from a black ethnic group had lower agreement that if they needed help there were people who would be there for them (90%) versus respondents identifying as from a white ethnic group (96%). Respondents identifying as from a white ethnic group had higher levels of agreement that there is one person or more they could count on to listen to them when they needed to talk (96%) compared to respondents identifying from an Asian ethnic group (94%) or other ethnic group (92%).
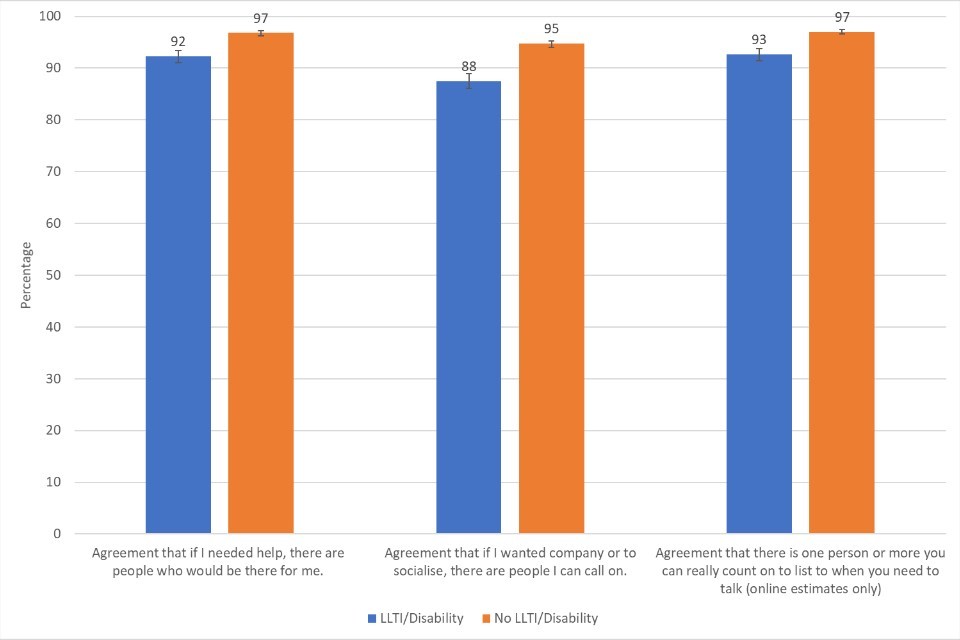
Those with a long term limiting illness reported lower levels of agreement across all statements than those without, suggesting possibly less access to support networks. The largest difference in response was seen for the statement ‘I agree that if I wanted company or to socialise, there are people I can call on’, where 88% of those with a long term limiting illness or disability agreed, compared to 95% of those without.
Those living in a rural area had lower levels of agreement that if they wanted company or to socialise there are people they can call upon (92%) versus respondents from urban areas (95%).
Those from the least deprived areas reported higher levels of agreement (i.e. people available if they needed support) across all statements than those from the most deprived areas. The largest variation between the least deprived (94%) and the most deprived (90%) was whether they agreed that if they wanted company or to socialise there were people they could call on.
There was no variability across regions or by age.
Figure 1.4: Percentage of respondents with support networks available by limiting long-term illness/disability (LLTI/Disability), 2021/22
3. Diversity of friendship groups
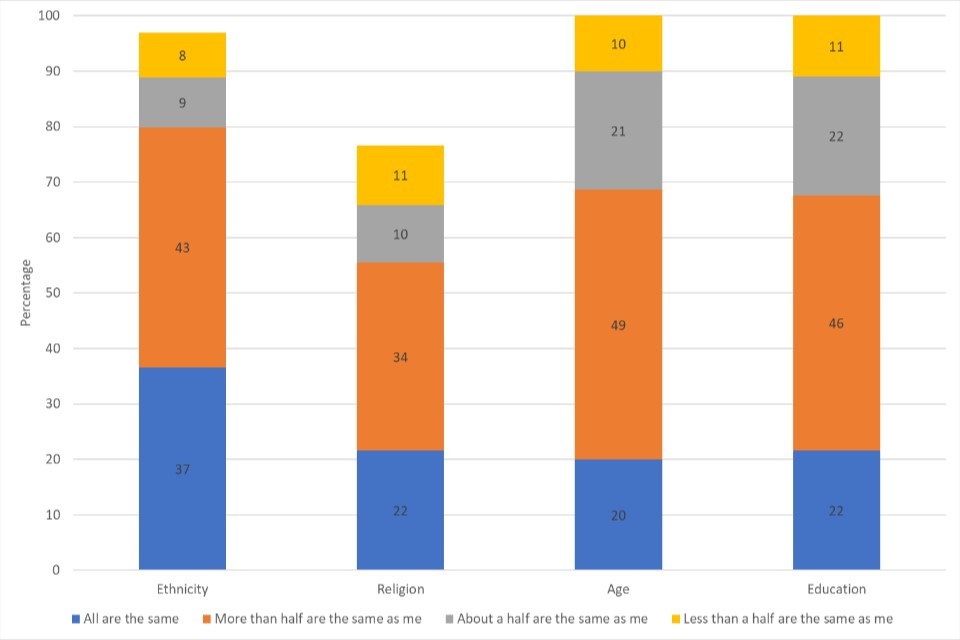
In 2021/22, the majority of respondents had diverse friendship groups in terms of ethnic group, religion, age and education. Just over a fifth (22%) said all their friends had a similar level of education, and 20% said all were from the same age group, similar to levels in 2020/21. Respondents in 2021/22 were less likely than in 2020/21 to report that all their friends are the same ethnic group (37% vs 39%) or religious group (22% vs 28%).
Figure 1.5: Similarity of friends to respondent in terms of ethnic group, religion, education and age group, 2021/22[footnote 4]
-
The 95% confidence intervals are indicated by error bars on the charts. They show the range that we are 95% confident the true value for the population falls between. When there is no overlap between the error bars for two or more groups, we can be more confident that the differences between groups represent true differences between these groups in the population. ↩
-
Respondents who reported their gender as ‘other’ have not been included in this chart due to the number of respondents being small and therefore potentially disclosive. ↩
-
The Index of Multiple Deprivation, commonly known as the IMD, is the official measure of relative deprivation for small areas in England. It is calculated using several measures such as income deprivation, crime and living environment deprivation. The Index of Multiple Deprivation ranks every small area in England from 1 (most deprived area) to 32,844 (least deprived area). In this publication, we have clustered these areas into ‘IMD Quintiles’ with 1 being the most deprived areas and 5 being the least deprived areas. ↩
-
Figure 1.5 does not sum to 100% due to the presence of missing values in the data. These include all those who answered ‘Don’t have any friends’, ‘Don’t know’ or ‘Prefer not to say’. Please refer to the Technical Annex for more information on how missing data was handled. ↩