Main findings: children’s social care in England 2023
Updated 8 September 2023
Applies to England

© Crown copyright 2023
This publication is licensed under the terms of the Open Government Licence v3.0 except where otherwise stated. To view this licence, visit nationalarchives.gov.uk/doc/open-government-licence/version/3 or write to the Information Policy Team, The National Archives, Kew, London TW9 4DU, or email: psi@nationalarchives.gov.uk.
Where we have identified any third party copyright information you will need to obtain permission from the copyright holders concerned.
This publication is available at https://www.gov.uk/government/statistics/childrens-social-care-data-in-england-2023/main-findings-childrens-social-care-in-england-2023
This is the main findings report for the children’s social care in England 2023 release. The following are also available:
-
underlying data
-
methodology
-
pre-release access list
Summary
This release contains:
-
inspection outcomes for local authority (LA) children’s services inspections from 1 November 2013, covering all inspections published by 30 April 2023
-
the number of providers of children’s social care, and the number of places they are registered for, as at 31 March 2023
-
the most recent inspections and outcomes for all regulated and inspected children’s social care provision, as at 31 March 2023 and published by 30 April 2023
-
outcomes for all regulated and inspected children’s social care provision inspections carried out between 1 April 2022 and 31 March 2023 and published by 30 April 2023
Main findings
The number of children’s homes in England continues to rise across all regions.
As at 31 March 2023, there was a 9% increase in the number of children’s homes (to 2,880) and a 7% increase in the number of places (to 10,818) compared with 31 March 2022. This continues the long-standing trend of the number of homes rising faster than the number of places.
Although all regions had an increase in the number of children’s homes this year, homes are still not evenly distributed across England. Similar to last year, the North West accounts for a quarter of all children’s homes and almost a quarter of all places.
All LAs have now had at least one inspection under the inspection of local authority children’s services (ILACS) framework. A higher proportion of LAs were graded good or outstanding after their first ILACS inspection compared with their first single inspection framework (SIF) inspection.
After every LA had received one ILACS inspection, the proportion of LAs judged good or outstanding for overall effectiveness was 55%, which is higher than after every LA had received a full inspection under the SIF framework, when this proportion was 36%. The proportion of LAs rated inadequate has fallen from 22% after every LA had received a full SIF inspection to 13% after every LA had received a full ILACS inspection.
The long-term trend of the steadily decreasing number and potential capacity of residential special schools registered as children’s homes continues this year as these settings close or reconfigure their registration.
This year’s total of 56 residential special schools registered as children’s homes is the lowest in the last decade and contrasts with the 2014 total of 88 residential special schools registered as children’s homes (a 36% drop since 2014). In the same period, potential capacity has dropped from 2,331 to 1,457 (a 37% drop since 2014). In some cases, this may relate to reconfiguration of settings’ registration as opposed to their closure.
Residential family centres saw a large proportional increase compared with last year, with a 15% increase in settings and a 20% increase in potential capacity.
Residential family centres represent a small proportion of social care providers and places overall but saw a substantial increase compared with last year, with a 15% increase in settings (from 68 to 78) and a 20% increase in potential capacity (from 371 to 444).
Introduction
Ofsted reports each year on social care inspections and outcomes for LAs, regulated providers and other providers of placements for children in England.
Out of the nearly 12 million children living in England, just over 400,000 (3%) are in the social care system at any one time. Just over 82,000 of these children are children in care. As at 31 March 2023, across England, 152 LAs were responsible for ensuring and overseeing the effective delivery of social care services for children. We inspect these LAs to see how their children’s services are performing.
We regulate and/or inspect providers that offer placements for children in care and other providers of placements. As at 31 March 2023, there were 3,812 active or suspended social care providers of these services in England. More information about the different types of providers can be found in Figure 5 and in the glossary.
Inspection of LA children’s services
This year we reached a point at which every LA had been inspected under the ILACS framework. This means that it is now possible to compare inspection outcomes after every LA had received a full ILACS inspection with those after every LA had received a full SIF inspection.
Of these, one (South Tyneside) was inspected during the 2022 to 2023 period but was not published by the usual deadline for inclusion; however, it is included in this report to enable comparison between inspection outcomes after every LA had received a full inspection under the SIF and after every LA had received a full inspection under the ILACS framework.
This year, we visited 95 LAs on 111 occasions to carry out short or standard ILACS inspections, focused visits and monitoring visits. There have been 51 short or standard ILACS inspections during the year.
Overall LA effectiveness as at 31 March 2023
As at 31 March 2023, 16% of LAs were judged outstanding, 43% good, 32% requires improvement to be good and 9% inadequate. The proportion of LAs judged outstanding or good has increased from 53% in 2022 to 59% in 2023.
Figure 1: LA overall effectiveness as at 31 March 2023 compared with 31 March 2022

Note: Numbers in brackets represent the number of LAs with an overall effectiveness outcome as at 31 March 2022 and 2023.
Due to rounding, percentages might not add up to 100.
View data in an accessible format.
A small number of LAs have already had their second ILACS inspection. Their most recent grade as at 31 March 2023 is shown in the figure above.
After their first ILACS inspection, over half (55%) of LAs were graded outstanding or good. When every LA had received a full SIF inspection, 36% of LAs were graded outstanding or good. There were also fewer LAs graded inadequate after their first inspection under the ILACS framework (13%) compared with their first inspection under the SIF framework (22%). This comparison is shown in the figure below.
Figure 2: LA overall effectiveness after every LA had received a full ILACS inspection and after every LA had received a full SIF inspection

Note: Numbers in brackets represent the number of LAs with an overall effectiveness outcome after their first inspection under the ILACS and SIF frameworks.
Due to rounding, percentages might not add up to 100.
View data in an accessible format.
ILACS activity between 1 April 2022 and 31 March 2023
Between 1 April 2022 and 31 March 2023, we visited 95 LAs to carry out ILACS activities. We made a total of 111 visits to these LAs.
Figure 3: ILACS inspection activity between 1 April 2022 and 31 March 2023
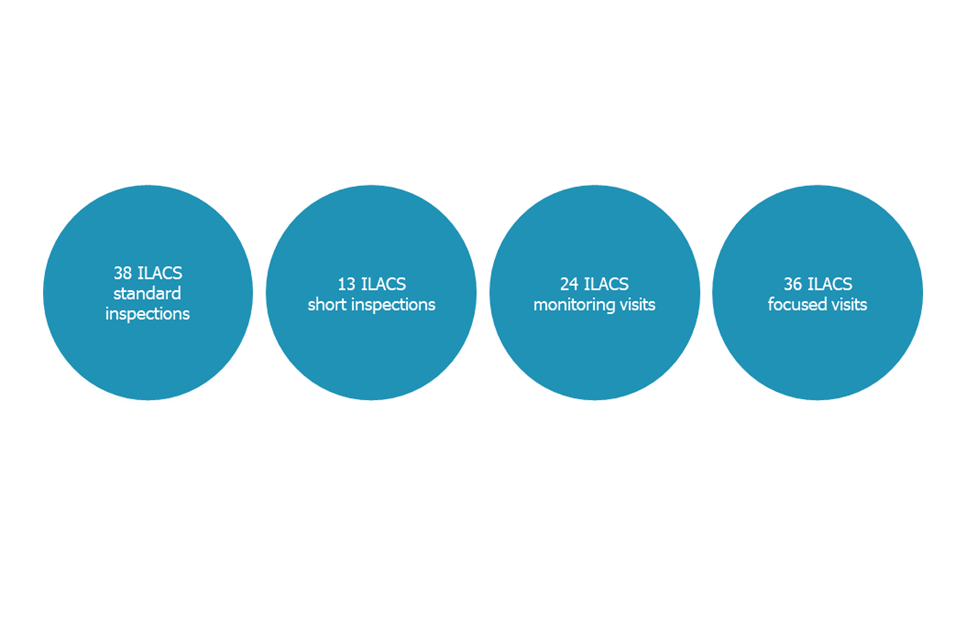
View data in an accessible format.
ILACS standard and short inspections
Between 1 April 2022 and 31 March 2023, we carried out 51 ILACS standard or short inspections.
Over half of these inspections resulted in a judgement of outstanding or good (55%). The remaining inspections resulted in judgements of requires improvement to be good (33%) or inadequate (12%). Of the 51 inspected LAs, more improved than declined in their overall effectiveness judgement. 25 LAs improved their judgement, while 6 declined. There were 18 LAs that retained the same judgement. Two LAs were inspected for the first time during this period.
Of the 25 LAs that improved, 3 did so by more than one grade. All 3 of these changed from inadequate at their last inspection to good.
ILACS focused visits
We carry out focused visits between standard and short inspections. A focused visit will look at one or more aspects of the service or themes or cohorts of children.
Of the 36 focused visits carried out, nearly half (17) were to LAs judged requires improvement to be good at their last graded inspection. Details of visit themes are given in figure 4.
Figure 4: ILACS focused visits by theme between 1 April 2022 and 31 March 2023

View data in an accessible format.
ILACS monitoring visits
Between 1 April 2022 and 31 March 2023, we carried out a total of 24 monitoring visits across 14 LAs.
Social care providers and places as at 31 March 2023
As at 31 March 2023, there were 3,812 children’s social care providers. This is a 7% increase compared with 31 March 2022, when there were 3,576 providers. This is a similar increase to previous years. As in previous years, the reason for this increase can be attributed largely to the increase in children’s homes: a 9% increase in settings (246) and a 5% increase in places (630). Residential family centres represent a much smaller proportion of social care providers and places overall but saw a large proportional increase compared with last year, with a 15% increase in settings (10) and a 20% increase in potential capacity (73).
Figure 5: The number of settings as at 31 March 2023 by provider type, and the change from 31 March 2022
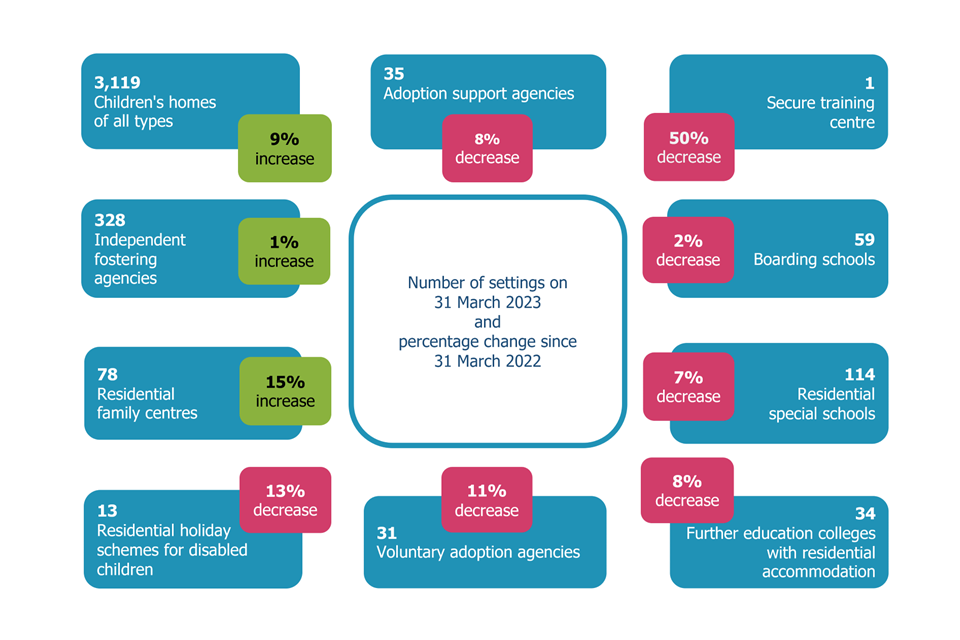
View data in an accessible format.
Children’s homes of all types
In this section, we report separately on the 4 types of children’s homes:
-
secure children’s homes
-
residential special schools registered as children’s homes
-
short-break-only children’s homes
-
children’s homes
There were 3,119 children’s homes of all types as at 31 March 2023, a 9% increase (246 homes) from the previous year (2,873).
In total, the 3,119 children’s homes of all types were registered for 13,528 places. This represents a 5% increase in potential capacity since 31 March 2022, when there were 12,898 registered places in total. The proportional increase in potential capacity is larger than last year, when there was a 1% increase (from 12,732 places in 2021 to 12,898 in 2022). On average, children’s homes have 4 places, which is in line with previous years.
Since 2019, the number of children’s homes has increased by 35%, from 2,304 to 3,119. Over the same period, the number of places has increased by a smaller proportion (12%), from 12,035 to 13,528.
Figure 6: Percentage change in the number of children’s homes of all types and their potential capacity since 2014

View data in an accessible format.
Secure children’s homes
There were 13 secure children’s homes as at 31 March 2023. Of these, 12 are run by LAs and 1 by a charitable organisation. According to our data, these offer a total of 214 places, of which 101 are commissioned by the Youth Custody Service for children remanded in custody by the courts or who are serving a custodial sentence. The rest are for children placed by LAs under section 25 of the Children Act 1989. There are no secure children’s homes in London or the West Midlands.
Residential special schools registered as children’s homes
As at 31 March 2023, there were 56 residential special schools registered as children’s homes, offering 1,457 places. This is a 10% decrease in the number of providers and a 7% decrease in the number of places since March 2022, when these totals were 62 and 1,573, respectively.
Between 1 April 2022 and 31 March 2023, no residential special schools registered as children’s homes opened. Meanwhile, 5 residential special schools registered as children’s homes either closed or reconfigured their registration (87 places). All the settings that closed or ceased to operate as residential special schools registered as children’s homes were in the private sector.
This continues the longer-term trend of the steadily decreasing number and potential capacity of residential special schools registered as children’s homes.
Figure 7: The year-on-year change in the number of residential special schools registered as children’s homes and places since 2014

View data in an accessible format.
Private companies ran most residential special schools registered as children’s homes. They operated 40 schools, providing 926 places. Voluntary-sector organisations ran 13 schools, providing 453 places. LAs ran the remaining 3 schools, providing 78 places.
Short-break-only children’s homes
As at 31 March 2023, there were 170 children’s homes that provided care exclusively for short breaks, offering 1,039 places. This is an increase compared with the number of homes recorded as short-break-only as at 31 March 2022, when there were 156 homes offering 982 places. This data has only been analysed separately since 2021, so we cannot yet comment on longer-term trends.
Table 1: The number of short-break-only children’s homes and places as at 31 March 2023, by region
| Region | Number of short-break-only children’s homes | Percentage of short-break-only children’s homes | Number of short-break-only children’s home places | Percentage of short-break-only children’s home places |
|---|---|---|---|---|
| North East, Yorkshire and the Humber | 31 | 18% | 226 | 22% |
| North West | 31 | 18% | 161 | 15% |
| South East | 26 | 15% | 174 | 17% |
| West Midlands | 22 | 13% | 115 | 11% |
| East of England | 18 | 11% | 100 | 10% |
| South West | 18 | 11% | 84 | 8% |
| London | 13 | 8% | 94 | 9% |
| East Midlands | 11 | 6% | 85 | 8% |
| England | 170 | 100% | 1,039 | 100% |
Table 2: The number of short-break-only children’s homes and places as at 31 March 2023, by sector
| Sector | Number of short-break-only children’s homes | Percentage of short-break-only children’s homes | Number of short-break-only children’s home places | Percentage of short-break-only children’s home places |
|---|---|---|---|---|
| Local authority | 107 | 63% | 647 | 62% |
| Voluntary | 38 | 22% | 245 | 24% |
| Private | 16 | 9% | 94 | 9% |
| Health authority | 9 | 5% | 53 | 5% |
| All | 170 | 100% | 1,039 | 100% |
Note: Due to rounding, percentages might not add up to 100.
Children’s homes
In this section, when we refer to children’s homes, we mean children’s homes excluding short-break-only children’s homes, secure children’s homes and residential special schools registered as children’s homes.
The number of children’s homes in England continues to rise. There was a 9% increase in the number of homes and a 7% increase in the number of places compared with 31 March 2022. This year’s data continues the long-standing trend of a greater proportional year-on-year increase in children’s homes than places.
Children’s home providers and places as at 31 March 2023
There were 2,880 children’s homes as at 31 March 2023, a 9% increase (238 homes) from the previous year (2,642). These 2,880 homes were registered for 10,818 places, a 7% increase from 10,113 at 31 March 2022. Both the number of homes and places had a faster rate of growth this year than the rate in 2022, when the number of homes grew by 7% and places by 4%. This was accounted for by 365 homes opening and 116 homes closing.
Change in the number of homes by region
As in previous years, children’s homes are not distributed evenly across the country. All regions saw an increase in homes and places. As at 31 March 2023, the North West had the most children’s homes (746) and places (2,458), while London had the fewest settings (164), and the South West had the fewest places (600).
Table 3: The number of children’s homes and the number of places as at 31 March 2023, by region
| Region | Number of children’s homes | Percentage of children’s homes | Number of children’s home places | Percentage of children’s home places |
|---|---|---|---|---|
| North West | 746 | 26% | 2,458 | 23% |
| West Midlands | 475 | 16% | 1,672 | 15% |
| North East, Yorkshire and the Humber | 430 | 15% | 1,612 | 15% |
| East Midlands | 331 | 11% | 1,218 | 11% |
| South East | 303 | 11% | 1,461 | 13% |
| East of England | 230 | 8% | 1,010 | 9% |
| South West | 201 | 7% | 600 | 6% |
| London | 164 | 6% | 787 | 7% |
| England | 2,880 | 100% | 10,818 | 100% |
Note: Due to rounding, percentages might not add up to 100.
The regions with the most substantial growth in the number of settings over the last year were East Midlands (15%), East of England (13%) and London (12%). East Midlands and East of England saw the largest proportional increase in places (12% and 10%, respectively).
Although net change in the North West was relatively low, this region accounted for the highest number of newly registered children’s homes (88, 24%) and places (273, 22%), which is roughly in line with the previous year. This region also accounted for nearly a quarter of both closed homes (29, 24%) and places (121, 23%).
Figure 8: The percentage change of children’s homes and places from 31 March 2022 to 31 March 2023, by region
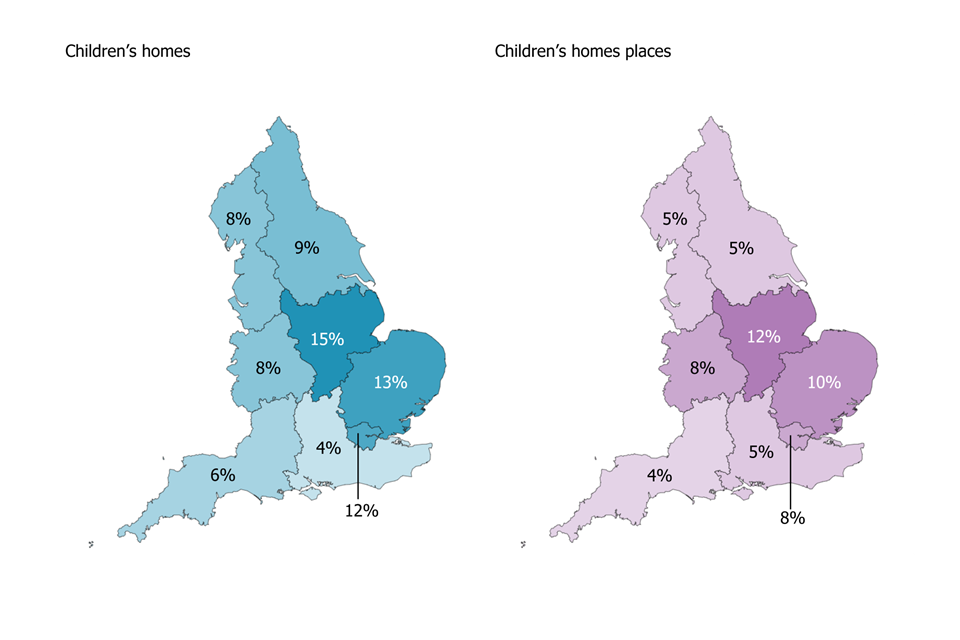
Note: In both maps, lighter hue indicates lower percentage change.
View data in an accessible format.
Number of homes by sector
As at 31 March 2023, private companies ran 85% of children’s homes (2,450), providing 81% of places (8,791). LAs ran 12% (333) of children’s homes, providing 14% of places (1,529).
15 of these LA homes were run by organisations that provide the children’s services function of the council, including trusts. This accounted for 89 places. Voluntary providers ran 3% of homes (97) providing 5% of places (498).
The private sector saw an increase in the number both of homes (11%) and places (10%) compared with 2022. This increase is in line with previous years. The voluntary sector also saw an increase in homes (3%) and places (1%).
Since 2021, which was the first year we analysed children’s homes without short-break-only homes, there has been a 21% increase in private-sector homes, a 7% increase in voluntary-run homes and a 2% decrease in LA-run homes. There has been a 35% decrease in LA homes run by organisations that provide the children’s services function of the council, including trusts, in this period.
Inspection profile of all types of children’s homes as at 31 March 2023
In this section, we report on the 4 types of children’s homes together.
As at 31 March 2023, 93% of all active children’s homes of all types had an inspection judgement (2,890 out of 3,119).
The proportion of children’s homes of all types judged outstanding or good was 79% as at 31 March 2023 (10% outstanding, 69% good). This is a slight increase from 2022, when the proportion was 77%. 18% of homes were judged requires improvement to be good (compared with 21% in 2022) and 2% were judged inadequate (compared with 3% in 2022).
Figure 9: Grade profile of children’s homes of all types with inspection outcomes as at 31 March 2023 and 31 March 2022

Note: Numbers in brackets represent the number of providers with an overall effectiveness grade as at 31 March 2022 and 2023.
Due to rounding, percentages might not add up to 100.
View data in an accessible format.
Although the inspection profile is similar for most types of children’s homes, short-break-only homes had a higher proportion of outstanding homes (16%). However, the percentage of outstanding short-break-only homes has fallen over time from 29% in 2020.
Figure 10: Grade profile of all types of children’s homes with inspection outcomes as at 31 March 2023

Note: Numbers in brackets represent the number of providers with an overall effectiveness grade as at 31 March 2023.
Due to rounding, percentages might not add up to 100.
View data in an accessible format.
The grade profiles are broadly in line across the sectors. LAs have the highest proportion of outstanding children’s homes (14%).
Figure 11: Grade profile of all types of children’s homes with inspection outcomes as at 31 March 2023, split by sector

Note: Totals in brackets are the number of children’s homes of all types in each sector with an overall effectiveness grade as at 31 March 2023.
Nine children’s homes are run by a health authority and are excluded from the chart. As at 31 March 2023, all 9 were judged to be good.
Due to rounding, percentages might not add up to 100.
View data in an accessible format.
Inspections of all types of children’s homes during 2022 to 2023
Between 1 April 2022 and 31 March 2023, we carried out a total of 3,441 full, assurance or monitoring inspections of 2,606 children’s homes.
Full inspections
Between 1 April 2022 and 31 March 2023, we carried out 2,741 full inspections of children’s homes. This figure captures multiple inspections of some settings, while others were not inspected at all this year. In terms of outcomes, 73% were judged outstanding or good (8% outstanding and 65% good), with the remainder being judged requires improvement to be good (19%) or inadequate (9%).
Figure 12: Grade profile of all full inspections of all types of children’s homes carried out between 1 April 2022 and 31 March 2023

Note: Totals in brackets are the number of children’s homes of each type that received a full inspection between 1 April 2022 and 31 March 2023.
There is a small number of secure children’s homes, making percentage-based comparisons with other setting types difficult in this instance. They are therefore excluded from this chart.
Due to rounding, percentages might not add up to 100.
View data in an accessible format.
There were 2 secure children’s homes judged as inadequate this year. Both underwent a monitoring visit and subsequent full inspection later in the year and saw their overall grade increase to requires improvement to be good. For this reason, the data for providers as at 31 March 2023 does not show any secure children’s homes with an inadequate judgement.
Monitoring visits and other inspections
Since 1 April 2022, we have carried out 437 monitoring visits to 315 children’s homes of all types. We have also carried out 263 assurance visits to 262 children’s homes of all types.
Regulatory activity in all types of children’s homes between 1 April 2022 and 31 March 2023
An important part of our work is the regulation of social care settings. Much of this concerns children’s homes, which make up the majority of all children’s social care providers.
3-month condition
When it is clear that a children’s home has no intention of operating for at least 3 months, Ofsted can impose a condition requiring it to give 3 months’ notice to Ofsted if it intends to admit a child. This means that Ofsted is not required to inspect the setting routinely. As at 31 March 2023, 60 children’s homes (2%) had a 3-month condition to inform Ofsted 3 months before any child is accommodated. This represents a potential capacity of 206 places.
Enforcement activity
Between 1 April 2022 and 31 March 2023, we carried out the following enforcement actions across all children’s homes:
-
103 restrictions of accommodation
-
20 suspensions of providers
-
24 homes received a notice of cancellation
The 103 restrictions of accommodation occurred in 98 different children’s homes. Of these,4 homes received more than one restriction of accommodation.
The 20 suspensions occurred in 19 different children’s homes, with 1 home receiving multiple suspensions. Of these 19 homes, 3 resigned and 4 were still suspended on 31 March 2023. The remaining 12 homes were active on 31 March 2023.
Incident notifications received from children’s homes between 1 April 2022 and 31 March 2023
Providers must tell Ofsted, as the regulator for children’s homes in England, about the most serious incidents that happen to children living with them and what they have done in response.
Between 1 April 2022 and 31 March 2023, we received a total of 37,094 notifications from social care providers. The majority of these (30,200, 81%) came from children’s homes, in line with previous years.
Half of all notifications (51%) received from children’s homes in 2022 to 2023 were categorised as ‘other’. ‘Other’ notifications cover any incident considered by the registered person to be serious but that does not fit under one of the existing categories, which is why we see a high number of notifications in this category. Police call-outs to the home were the next highest category and accounted for a quarter of all notifications (26%). Police call-out notifications are not exclusively related to the child being suspected of committing a crime. Around half of all police call-out notifications relate to the police being called because a child has gone missing, has been a victim of sexual or criminal exploitation or another crime, or has disclosed a historic safeguarding concern.
Figure 13: A breakdown of the types of events contained in notifications made by children’s homes from 1 April 2022 to 31 March 2023

Note: There were 16 notifications relating to the death of a child, which are not represented here. Therefore, percentages might not add up to 100.
View data in an accessible format.
Unregistered children’s homes
Alongside our regulatory work, we receive and investigate notifications about potentially unregistered children’s homes. Between 1 April 2022 and 31 March 2023, we completed 460 investigations into potentially unregistered settings. This is an increase from 420 in 2021 to 2022.
Most of our work (75%) follows a notification of the placement by the placing local authority (the local authority with responsibility for finding a suitable place for a child to live). The next most common source of notification (5%) was Ofsted identifying a potentially unregistered children’s home during inspection.
The majority of placements in potentially unregistered children’s homes (71%) were because the LA was unable to find a suitable regulated option. More than 1 in 10 placements were in holidays lets being used temporarily as unregistered children’s homes (13%). A small proportion of settings were already registered with the Care Quality Commission but not with Ofsted (3%).
Of the 460 potentially unregistered children’s homes we investigated, 16% of settings (72) did not need to be registered or were used for very short-term temporary placements that had ended by the time of the investigation. This is an increase from 2021 to 2022, when fewer than 10% of settings did not need to be registered. These 72 settings were fairly evenly split between providers of supported accommodation and similar unregulated placements, and temporary placements that had since ended.
There were 356 settings (77%) that should have been registered with us. Most settings have since received warning letters, and many have closed.
Other social care providers
As at 31 March 2023, there were 693 settings from other social care provider types. Independent fostering agencies and residential special schools accounted for the majority of the 693 settings, with 328 (47%) and 114 (16%) settings respectively.
Figure 14: Percentage change of other social care providers from 31 March 2022 to 31 March 2023

Note: Totals in brackets are the number of settings of each type as at 31 March 2023.
View data in an accessible format.
We have data on the number of places available as at 31 March 2023 for the following 4 provider types:
-
residential special schools – the number of places fell by 4% to 3,372
-
boarding schools – the number of places fell by 9% to 8,939
-
further education colleges with residential accommodation – the number of places fell by 1% to 5,134
-
residential family centres – the number of places rose 20% by 73 places to 444
Inspections of other social care providers
Between 1 April 2022 and 31 March 2023, we carried out a total of 289 full inspections at 287 other social care providers. We also carried out 32 monitoring visits and one emergency inspection.
Inspection profile of other social care providers as at 31 March 2023
Of the 693 other social care provider settings, the majority (656, 95%) had a full inspection outcome as at 31 March 2023.
Figure 15: Inspection judgement profile of other social care providers at 31 March 2023

Note: Numbers in brackets represent the number of other social care providers with an overall effectiveness grade as at 31 March 2023.
There is one secure training centre, which was inspected this year and judged requires improvement to be good. This has been excluded from the chart.
Due to rounding, percentages might not add up to 100.
View data in an accessible format.
Inspections of other social care providers during 2022 to 2023
Of the 293 inspections of other social care providers, the majority (87%) were judged outstanding or good.
Figure 16: Full inspection outcomes of other social care providers between 1 April 2022 and 31 March 2023, by provider type

Note: There is one secure training centre, which was inspected this year and judged requires improvement to be good. This has been excluded from the chart.
Due to rounding, percentages might not add up to 100.
View data in an accessible format.
Further information
Notes
South Tyneside LA was inspected within the 2022 to 2023 year, but the report was not published by our usual deadline for inclusion in official statistics. It is included in this report to enable comparison between inspection outcomes after every LA had received a full inspection under the SIF and after every LA had received a full inspection under the ILACS framework.
There is a quality and methodology report to accompany this release.
Contacts
If you are a member of the public and have any comments or feedback on this publication, contact Emma Martin (emma.martin@ofsted.gov.uk) or the social care and area SEND analysis team (socialcaredata@ofsted.gov.uk).
Acknowledgements
Thanks to the following for their contribution to this statistical release: Hannah Tempest and Courtney Edwards.
Glossary
Definitions of terms are in the statistical glossary.
Annex: data tables for figures
This section contains the underlying data in an accessible table format for all figures.
Data for Figure 1: LA overall effectiveness as at 31 March 2023 compared with 31 March 2022
| Period | % Outstanding | % Good | % Requires improvement to be good | % Inadequate |
|---|---|---|---|---|
| As at 31 March 2023 (152) | 16 | 43 | 32 | 9 |
| As at 31 March 2022 (150) | 13 | 40 | 35 | 12 |
See Figure 1.
Data for Figure 2: LA overall effectiveness after every LA had received a full ILACS inspection and after every LA had received a full SIF inspection
| Period | % Outstanding | % Good | % Requires improvement to be good | % Inadequate |
|---|---|---|---|---|
| After each LA’s first ILACS inspection (152) | 16 | 39 | 32 | 13 |
| After each LA’s first SIF inspection, as at October 2017 (152) | 2 | 34 | 43 | 22 |
See Figure 2.
Data for Figure 3: ILACS inspection activity between 1 April 2022 and 31 March 2023
| Type of visit | Number |
|---|---|
| ILACS standard inspections | 38 |
| ILACS short inspections | 13 |
| ILACS monitoring visits | 24 |
| ILACS focused visits | 36 |
See Figure 3.
Data for Figure 4: ILACS focused visits by theme between 1 April 2022 and 31 March 2023
| Theme | Percentage |
|---|---|
| Front door | 33% |
| Children in need/subject to a plan | 25% |
| Children in care | 17% |
| Care leavers | 11% |
| Achieving permanence | 8% |
| Vulnerable adolescents | 6% |
See Figure 4.
Data for Figure 5: The number of settings as at 31 March 2023 by provider type, and the change from 31 March 2022
| Type of provider | Number of settings as at 31 March 2023 | Percentage change since 31 March 2022 |
|---|---|---|
| Children’s homes of all types | 3,119 | 9% increase |
| Independent fostering agencies | 328 | 1% increase |
| Residential family centres | 78 | 15% increase |
| Residential holiday schemes for disabled children | 13 | 13% decrease |
| Adoption support agencies | 35 | 8% decrease |
| Voluntary adoption agencies | 31 | 11% decrease |
| Secure training centre | 1 | 50% decrease |
| Boarding schools | 59 | 2% decrease |
| Residential special schools | 114 | 7% decrease |
| Further education colleges with residential accommodation | 34 | 8% decrease |
See Figure 5.
Data for Figure 6: Percentage change in the number of children’s homes of all types and their potential capacity since 2014
| Year | Percentage change in the number of homes | Percentage change in the number of places |
|---|---|---|
| 2014 | 0% | 0% |
| 2015 | 1% | 2% |
| 2016 | 1% | 0% |
| 2017 | 4% | 1% |
| 2018 | 7% | 1% |
| 2019 | 12% | 4% |
| 2020 | 20% | 5% |
| 2021 | 32% | 10% |
| 2022 | 40% | 11% |
| 2023 | 52% | 17% |
See Figure 6.
Data for Figure 7: The year-on-year change in the number of residential special schools registered as children’s homes, and places since 2014
| Year | Number of settings | Number of places |
|---|---|---|
| 2014 | 88 | 2,331 |
| 2015 | 86 | 2,441 |
| 2016 | 85 | 2,527 |
| 2017 | 81 | 2,302 |
| 2018 | 71 | 2,082 |
| 2019 | 69 | 2,006 |
| 2020 | 69 | 1,911 |
| 2021 | 69 | 1,793 |
| 2022 | 62 | 1,573 |
| 2023 | 56 | 1,457 |
See Figure 7.
Data for Figure 8: The percentage change of children’s homes and places from 31 March 2022 to 31 March 2023, by region
| Region | Percentage change of children’s homes | Percentage change of children’s home places |
|---|---|---|
| East Midlands | 15% | 12% |
| East of England | 13% | 10% |
| London | 12% | 8% |
| North East, Yorkshire and the Humber | 9% | 5% |
| West Midlands | 8% | 8% |
| North West | 8% | 5% |
| South West | 6% | 4% |
| South East | 4% | 5% |
See Figure 8.
Data for Figure 9: Grade profile of children’s homes of all types with inspection outcomes as at 31 March 2023 and 31 March 2022
| Period | % Outstanding | % Good | % Requires improvement to be good | % Inadequate |
|---|---|---|---|---|
| As at 31 March 2023 (2,890) | 10 | 69 | 18 | 2 |
| As at 31 March 2022 (2,666) | 12 | 65 | 21 | 3 |
See Figure 9.
Data for Figure 10: Grade profile of all types of children’s homes with inspection outcomes as at 31 March 2023
| Type of children’s home | % Outstanding | % Good | % Requires improvement to be good | % Inadequate |
|---|---|---|---|---|
| All children’s homes (2,890) | 10 | 69 | 18 | 2 |
| Children’s homes (2,652) | 10 | 69 | 19 | 2 |
| Residential special schools (registered as children’s homes) (56) | 7 | 68 | 25 | 0 |
| Secure children’s homes (13) | 15 | 62 | 23 | 0 |
| Short-break-only children’s homes (169) | 16 | 72 | 9 | 2 |
See Figure 10.
Data for Figure 11: Grade profile of all types of children’s homes with inspection outcomes as at 31 March 2023, split by sector
| Sector | % Outstanding | % Good | % Requires improvement to be good | % Inadequate |
|---|---|---|---|---|
| Local authority (443) | 14 | 67 | 16 | 4 |
| Private (2,298) | 10 | 70 | 19 | 2 |
| Voluntary (140) | 9 | 76 | 15 | 1 |
See Figure 11.
Data for Figure 12: Grade profile of all full inspections of all types of children’s homes carried out between 1 April 2022 and 31 March 2023
| Type of children’s home | % Outstanding | % Good | % Requires improvement to be good | % Inadequate |
|---|---|---|---|---|
| All children’s homes (2,741) | 8 | 65 | 19 | 9 |
| Children’s homes (2,514) | 8 | 65 | 19 | 8 |
| Residential special schools (registered as children’s homes) (68) | 6 | 57 | 22 | 15 |
| Short-break-only children’s homes (145) | 10 | 70 | 10 | 9 |
See Figure 12.
Data for Figure 13: A breakdown of the types of events contained in notifications made by children’s homes from 1 April 2022 to 31 March 2023
| Type of event | Percentage |
|---|---|
| Police called (7,935) | 26% |
| Allegation/complaint (4,012) | 13% |
| Missing (980) | 3% |
| Child protection enquiry (869) | 3% |
| Accident/illness (592) | 2% |
| Sexual exploitation (454) | 2% |
| Other (15,342) | 51% |
See Figure 13.
Data for Figure 14: Percentage change of other social care providers from 31 March 2022 to 31 March 2023
| Provider type | Net change | Percentage change |
|---|---|---|
| Residential family centres (78) | +10 | 15% |
| Independent fostering agencies (328) | +2 | 1% |
| Boarding schools (59) | -1 | -2% |
| Residential special schools (114) | -8 | -7% |
| Adoption support agencies (35) | -3 | -8% |
| Further education colleges with residential accommodation (34) | -3 | -8% |
| Voluntary adoption agencies (31) | -4 | -11% |
| Residential holiday schemes for disabled children (13) | -2 | -13% |
See Figure 14.
Data for Figure 15: Inspection judgement profile of other social care providers as at 31 March 2023
| Provider type | % Outstanding | % Good | % Requires improvement to be good | % Inadequate |
|---|---|---|---|---|
| All social care providers other than children’s homes (655) | 27 | 67 | 5 | 1 |
| Adoption support agencies (31) | 48 | 52 | 0 | 0 |
| Boarding schools (57) | 23 | 65 | 9 | 4 |
| Further education colleges with residential accommodation (34) | 35 | 59 | 6 | 0 |
| Independent fostering agencies (313) | 20 | 74 | 4 | 1 |
| Residential family centres (66) | 11 | 77 | 6 | 6 |
| Residential holiday schemes for disabled children (11) | 64 | 36 | 0 | 0 |
| Residential special schools (111) | 41 | 52 | 7 | 0 |
| Voluntary adoption agencies (31) | 39 | 61 | 0 | 0 |
See Figure 15.
Data for Figure 16: Full inspection outcomes of other social care providers between 1 April 2022 and 31 March 2023, by provider type
| Provider type | % Outstanding | % Good | % Requires improvement to be good | % Inadequate |
|---|---|---|---|---|
| All social care providers other than children’s homes (289) | 28 | 59 | 8 | 5 |
| Adoption support agencies (15) | 40 | 60 | 0 | 0 |
| Boarding schools (15) | 7 | 73 | 13 | 7 |
| Further education colleges with residential accommodation (9) | 67 | 22 | 11 | 0 |
| Independent fostering agencies (112) | 22 | 64 | 8 | 5 |
| Residential family centres (37) | 8 | 62 | 11 | 19 |
| Residential holiday schemes for disabled children (8) | 88 | 13 | 0 | 0 |
| Residential special schools (81) | 36 | 59 | 9 | 0 |
| Voluntary adoption agencies (11) | 27 | 73 | 0 | 0 |
See Figure 16.