Main findings: children’s social care in England 2021
Updated 30 March 2022
Applies to England

© Crown copyright 2022
This publication is licensed under the terms of the Open Government Licence v3.0 except where otherwise stated. To view this licence, visit nationalarchives.gov.uk/doc/open-government-licence/version/3 or write to the Information Policy Team, The National Archives, Kew, London TW9 4DU, or email: psi@nationalarchives.gov.uk.
Where we have identified any third party copyright information you will need to obtain permission from the copyright holders concerned.
This publication is available at https://www.gov.uk/government/statistics/childrens-social-care-data-in-england-2021/main-findings-childrens-social-care-in-england-2021
This is the main findings report for the children’s social care in England 2021 release. The following are also available:
- underlying data
- methodology
- pre-release access list
Summary
This release contains:
- inspection outcomes for local authority (LA) children’s services inspections from 1 November 2013 covering all inspections published by 30 April 2021
- the number of providers of children’s social care, and the number of places they are registered for, as at 31 March 2021
- the most recent inspections and outcomes for all regulated and inspected children’s social care provision, as at 31 March 2021, and published by 30 April 2021
- outcomes for all regulated and inspected children’s social care provision inspections carried out between 1 April 2020 and 31 March 2021 and published by 30 April 2021
Due to COVID-19 (coronavirus), Ofsted suspended all routine inspections of social care providers on 17 March 2020, at the request of the Secretary of State. However, during 2020 to 2021, Ofsted has continued to carry out its regulatory work, including urgent inspections. This is detailed in the following release. For more information on the suspension of routine inspections, visit the Ofsted guidance and information relating to COVID-19.
The number of new children’s homes in England continues to rise.
As at 31 March 2021, there was an 11% increase in the number of homes and an 8% increase in the number of places compared with 31 March 2020. Although there was a smaller gap between them this year, it continues the long-standing trend of the number of new homes rising faster than the number of new places.
All regions saw an increase in the number of children’s homes as at 31 March 2021.
Although all regions saw an increase in numbers, children’s homes are still not evenly distributed across England. The North West still accounts for just over a quarter of all children’s homes, and almost a quarter of all places.
Almost 60% of all types of children’s homes (1,557) received a monitoring and/or assurance visit in 2020 to 2021.
Between 1 April 2020 and 31 March 2021, 1,244 monitoring visits and 861 assurance visits were carried out to children’s homes of all types. We prioritised our visits based on either concerns about children or the home’s most recent inspection judgements. Where applicable, the outcomes of these visits have been discussed further in this release.
The number of complaints about providers received in 2020 to 2021 was 18% higher than last year.
Between 1 April 2020 and 31 March 2021, we received 932 complaints about 629 providers. This is an increase on the number of complaints received in the previous 2 years (788 in 2019 to 2020 and 813 in 2018 to 2019).
There were no judged inspections of local authority children’s services (ILACS) in 2020 to 2021. Therefore, half of all LAs were still judged good or outstanding for overall effectiveness on 31 March 2021.
As at 31 March 2021, the proportion of LAs judged good or outstanding for overall effectiveness remained at 50%. This was because no inspections resulting in a judgement were carried out during the COVID-19 pandemic in 2020 to 2021. After each LA’s first single inspection framework (SIF) inspection, it was 36%.
Introduction
Ofsted reports each year on social care inspections and outcomes for LAs, regulated providers and other providers of placements for children in England.
Out of the 12 million children living in England, just under 400,000 (3%) are in the social care system at any one time. More than 80,000 of these children are children in care. As at 31 March 2021, across England, there were 151 LAs responsible for ensuring and overseeing the effective delivery of social care services for children. We inspect these LAs to see how their children’s services are performing.
We regulate and/or inspect providers that offer placements for children in care and other providers of placements. As at 31 March 2021, there were 3,402 active or suspended social care providers of these services in England. More information about the different types of providers can be found in Figure 8 and in the glossary.
Due to COVID-19, during 2020 to 2021, we did not complete any graded inspections of social care providers or LAs. The national inspection grade profile for both providers and LAs has, therefore, not changed since the release of our children’s social care data in England 2020 national statistics.
Routine inspection was suspended throughout 2020 to 2021, but our priority remained to be a force for improvement. We continued urgent inspection and regulation work and considered carefully how our skills and resources could best support the national COVID-19 response.
Throughout the year, we adapted our approach depending on the social care sector’s needs and the COVID-19 restrictions in place at the time. Our activity can be broadly split into 3 periods of time:
-
spring to summer 2020 (first national lockdown) – we carried out emergency monitoring visits to children’s homes of all types and continued registrations and wider regulatory work
-
autumn 2020 (regional restrictions and second national lockdown) – we started focused assurance visits to LAs and assurance visits to social care providers usually inspected under the social care common inspection framework (SCCIF). We continued to carry out monitoring visits and regulatory work for all social care providers. These assurance and monitoring visits did not result in graded judgements
-
winter to spring 2021 (third national lockdown) – we resumed focused visits to LA children’s services. We continued to carry out monitoring and assurance visits and regulatory work for all social care providers
Over the whole period, we also continued to do urgent inspections where there were concerns about leadership and management or safeguarding, and we continued our regulatory work in the social care sector.
Inspection of LA children’s services
There have been no short or standard ILACS inspections since 1 April 2020, because routine inspections have been suspended.
One additional inspection report is included in the data in this release, as it was published in June 2020 after an inspection in March 2020. The LA was judged requires improvement to be good.
Since September 2020, we have visited 22 LAs to carry out a focused assurance visit and returned to one – Northamptonshire – to carry out a monitoring visit.
Overall LA effectiveness as at 31 March 2021
Nationally, a higher proportion of LAs were judged good or outstanding at 31 March 2021 than after their first SIF inspection. As at 31 March 2021, 12% of LAs were judged outstanding, 38% good, 36% requires improvement to be good and 14% inadequate. Nationally, a higher proportion of LAs were judged good or outstanding than after their first SIF inspection.
Figure 1: LA overall effectiveness as at 31 March 2021 and after first SIF inspection

Numbers in brackets represent the number of LAs with an overall effectiveness outcome as at 31 March 2021.
View data in an accessible format.
ILACS activity between 1 April 2020 and 31 March 2021
Between 1 April 2020 and 31 March 2021, we visited 22 LAs to carry out ILACS activity. We made a total of 23 visits to these LAs. Of the 22 focused assurance visits carried out, the majority (68%) were to LAs judged inadequate or requires improvement to be good at their last graded inspection.
We made one focused assurance visit to Bournemouth, Christchurch and Poole, which has yet to receive a graded inspection since changes to the LA boundaries were made in April 2019.
During the year, we made one monitoring visit, to Northamptonshire, following a focused assurance visit. Northamptonshire was judged inadequate at its last graded inspection in June 2019. In addition, we made 6 monitoring visits to LAs following an inadequate judgement. The reports for these visits were not published.
Social care providers and places as at 31 March 2021
On 31 March 2021, there were 3,402 social care providers. This is an 8% increase compared with 31 March 2020, when there were 3,158 providers. Most of this increase can be accounted for by the increase in children’s homes.
Figure 2: The number of settings as at 31 March 2021 by provider type, and the change from 31 March 2020

View data in an accessible format.
Children’s homes of all types
There were 2,706 children’s homes of all types as at 31 March 2021, a 10% increase (246 homes) from the previous year (2,460). This year saw a greater increase in children’s homes than the previous year, when there was a 7% increase. These homes were registered for 12,732 places, a 5% increase from 12,175 as at 31 March 2020. In the previous year, the number of places had only grown by 1% (12,035 to 12,175 places).
Other social care providers
As at 31 March 2021, 4 provider types increased the number of settings from 31 March 2020. Another 4 provider types decreased in the number of settings and the remaining one had no change. Boarding schools inspected by Ofsted saw the largest change, with a 14% decrease in the number of settings compared with 31 March 2021.
The number of residential special schools has fallen further in 2021, to 126. This is a decrease of 7% (10 schools) compared with 2020. This continues the fall in the number of residential special schools observed since 2016, when there were 165. One of these schools re-registered as a different provider type: a residential special school registered as a children’s home.
The number of voluntary adoption agencies (VAAs) has fallen for the second year, with 2 VAAs closing in the year. This led to a decrease of 5%, from 39 in 2020 to 37 in 2021.
On 31 March 2021, there were 2 secure training centres operating. Since then, the Ministry of Justice has announced that all children are to be removed from one of these secure training centres due to serious safety concerns.
During 2020 to 2021, 26 new independent fostering agencies (IFAs) opened and 8 resigned. Ofsted also cancelled the registration of one IFA following a monitoring visit.
We have data on the number of places available on 31 March 2021 for the following 4 provider types:
- residential special schools – the number of places fell by 7% to 3,685
- boarding schools – the number of places fell by 11% to 8,887
- further education colleges with residential accommodation – the number of places fell by 12% to 5,081
- residential family centres – the number of places rose by 3% to 325
Children’s homes of all types
In this section, we report separately on the 4 types of children’s homes:
- secure children’s homes
- residential special schools registered as children’s homes
- short-break-only children’s homes
- children’s homes
Short-break-only homes are being reported on separately in some detail for the first time in a statistical first release.
Secure children’s homes
There were 13 secure children’s homes as at 31 March 2021. When operating at full capacity, they offer 234 places. The COVID-19 pandemic impacted on the staffing of secure children’s homes, with staff becoming ill and/or having to self-isolate. This meant that secure children’s homes could not look after as many children, as they must operate with sufficient staffing levels to provide safe care for children.
Secure children’s homes were not split evenly across England. As with last year, there were no secure children’s homes in London or the West Midlands, while there were 4 in the North East, Yorkshire and the Humber region. Therefore, there has been no change in secure children’s homes since 31 March 2020.
Of the 13 secure children’s homes, 12 were run by LAs. The remaining one was run by a voluntary organisation.
There is a shortage of secure children’s homes in England. Since 2002, 16 secure children’s homes have closed. At any one time, around 25 children each day are waiting for a secure children’s home place and around 20 are placed by English LAs in Scottish secure units due to the lack of available places. The limited number of secure children’s homes places means that, even when children get a place, they will likely end up living far away from home.[footnote 1]
Residential special schools registered as children’s homes
As at 31 March 2021, there were 69 residential special schools registered as children’s homes, offering 1,793 places as at 31 March 2021.
Between 1 April 2020 and 31 March 2021, 3 residential special schools registered as children’s homes opened (with 36 places). Meanwhile, 3 residential schools registered as children’s homes closed (111 places). This resulted in no net change in the number of homes but a net decrease in the number of places by 75.
Private companies ran most residential special schools registered as children’s homes. They operated 51 schools, providing 1,240 places. Voluntary sector organisations ran 15 schools, providing 475 places. LAs ran the remaining 3 schools, providing 78 places.
Short-break-only children’s homes
As at 31 March 2021, there were 162 children’s homes that provided care exclusively for short breaks, offering 1,009 places. This is a slight decrease from the previous year, when there were 167 homes, offering 1,037 places.
Between 1 April 2020 and 31 March 2021, 5 short-break-only children’s homes opened (with 25 places). Meanwhile, 10 short-break-only children’s homes closed (49 places). This resulted in a net decrease in the number of short-break-only homes by 5 homes and 28 places.
As with children’s homes, short-break-only homes are not evenly distributed across the country. The North East, Yorkshire and the Humber region has the most homes (32, 20%) and places (234, 23%). London has the second-lowest number of homes (11, 7%) and the lowest number of places (76, 8%).
Table 1: The number of short-break-only children’s homes and places as at 31 March 2021, by region
| Region | Number of short-break-only children’s homes | Percentage of short-break-only children’s homes | Number of short-break-only children’s places | Percentage of short-break-only children’s places |
|---|---|---|---|---|
| East Midlands | 10 | 6% | 80 | 8% |
| East of England | 18 | 11% | 109 | 11% |
| London | 11 | 7% | 76 | 8% |
| North East, Yorkshire and the Humber | 32 | 20% | 234 | 23% |
| North West | 27 | 17% | 139 | 14% |
| South East | 25 | 16% | 174 | 17% |
| South West | 19 | 12% | 93 | 9% |
| West Midlands | 20 | 12% | 104 | 10% |
| England | 162 | 100% | 1,009 | 100% |
Of the 162 short-break children’s homes, 64% (104 homes) were run by an LA or an LA trust. These homes offered 64% of places (648). The voluntary sector ran a further 22% of homes and 23% of places. Just over a third of LAs (51, 34%) do not have a short-break-only home in their boundaries. Further analysis of short-break-only homes will follow in a subsequent publication.
Table 2: The number of short-break-only children’s homes and places as at 31 March 2021, by sector
| Sector | Number of short-break-only children’s homes | Percentage of short-break-only children’s homes | Number of short-break-only children’s places | Percentage of short-break-only children’s places |
|---|---|---|---|---|
| Health authority | 9 | 6% | 53 | 5% |
| LA trust | 6 | 4% | 34 | 3% |
| LA | 98 | 60% | 614 | 61% |
| Private | 14 | 9% | 75 | 7% |
| Voluntary | 35 | 22% | 233 | 23% |
| England | 162 | 100% | 1,009 | 100% |
Children’s homes
The number of children’s homes in England continues to rise. There was an 11% increase in the number of homes and an 8% increase in the number of places compared with 31 March 2020. Although the gap between the two is smaller this year, it continues the long-standing trend of the number of new homes rising faster than the number of new places.
Children’s home providers and places as at 31 March 2021
There were 2,462 children’s homes as at 31 March 2021, an 11% increase (251 homes) from the previous year (2,211). These 2,462 homes were registered for 9,699 places, an 8% increase from 8,996 at 31 March 2020.
Change in the number of homes by region
As with previous years, children’s homes are not distributed evenly across the country. As at 31 March 2021, just over a quarter of all children’s homes, and almost a quarter of all places, were in the North West region. This region also saw the biggest increase in the number of children’s homes (73) and places (206). Only 5% of homes and 6% of places were in London, which has been the region with the fewest children’s homes for many years.
Table 3: The number of children’s homes and the number of places as at 31 March 2021 by region
| Region | Number of children’s homes at 31 March 2021 | Percentage of children’s homes at 31 March 2021 | Number of places at 31 March 2021 | Percentage of places at 31 March 2021 |
|---|---|---|---|---|
| England | 2,462 | 9,699 | ||
| East Midlands | 266 | 11% | 1,060 | 11% |
| East of England | 177 | 7% | 813 | 8% |
| London | 124 | 5% | 627 | 6% |
| North East, Yorkshire and the Humber | 379 | 15% | 1,530 | 16% |
| North West | 636 | 26% | 2,223 | 23% |
| South East | 267 | 11% | 1,321 | 14% |
| South West | 181 | 7% | 575 | 6% |
| West Midlands | 432 | 18% | 1,550 | 16% |
All regions saw an increase in the number of children’s homes at 31 March 2021. Six regions saw an increase that was greater than or equal to the national level of 11% (251 homes): North East, Yorkshire and the Humber (16%, 51), East Midlands (14%, 33), North West (13%, 73), South West (13%, 21), London (12%, 13) and East of England (11%, 18).
All regions also saw an increase in the number of places at 31 March 2021. Three regions saw a greater increase than that seen nationally (8%): East Midlands (11%, 104 places), North West (10%, 206) and East of England (9%, 65).
Table 4: The number of children’s homes and places as at 31 March 2021 and 2020 by region, and percentage change
| Region | Number of children’s home at 31 March 2021 | Number of places at 31 March 2021 | Number of children’s homes at 31 March 2020 | Number of places at 31 March 2020 | Percentage change in children’s homes | Percentage change in places |
|---|---|---|---|---|---|---|
| England | 2,462 | 9,699 | 2,211 | 8,996 | 11% | 8% |
| East Midlands | 266 | 1,060 | 233 | 956 | 14% | 11% |
| East of England | 177 | 813 | 159 | 748 | 11% | 9% |
| London | 124 | 627 | 111 | 595 | 12% | 5% |
| North East, Yorkshire and the Humber | 379 | 1,530 | 328 | 1,430 | 16% | 7% |
| North West | 636 | 2,223 | 563 | 2,017 | 13% | 10% |
| South East | 267 | 1,321 | 251 | 1,257 | 6% | 5% |
| South West | 181 | 575 | 160 | 536 | 13% | 7% |
| West Midlands | 432 | 1,550 | 406 | 1,457 | 6% | 6% |
Number of homes by sector
As at 31 March 2021, private companies ran over 80% of children’s homes (2,032), providing 7,555 (78%) places. LAs ran only 14% (339) of children’s homes, providing 16% (1,643) of places. Twenty-three of these LA homes were run by organisations that provide the children’s services function of the council, including trusts. Voluntary providers ran 91 homes (4%), providing 501 places (5%).
Figure 3: The split by sector of children’s homes and places as at 31 March 2021

View data in an accessible format.
All but the voluntary sector saw a slight increase in the number of homes and places compared with 2020. Private companies saw the biggest increase, by 227 (13%) homes and 654 (9%) places. LAs saw an increase of 32 (10%) homes and 137 (9%) places.
Joiners and leavers in 2020 to 2021
Between 1 April 2020 and 31 March 2021, 346 children’s homes opened (offering 1,155 places) and 95 children’s homes closed (448 places). This was in line with the previous year.
This year continues the trend of newly registered children’s homes tending to be smaller than those that closed. Over 80% of new children’s homes were registered for between 1 and 4 places, with only 6% being approved for 7 or more places. Of the children’s homes that closed, almost 20% were approved for 7 or more places. The average number of places for a new children’s home was 3.3, while the average for a closing home was 4.7. This is in line with the previous year.
Table 5: The number of ‘approved for’ places in children’s homes that were newly registered and closed
| Number of places | New registrations | Percentage of new registrations | Closed | Percentage of closed |
|---|---|---|---|---|
| 1 to 2 | 117 | 34 | 16 | 17 |
| 3 to 4 | 172 | 50 | 43 | 45 |
| 5 to 6 | 37 | 11 | 19 | 20 |
| 7 to 9 | 16 | 5 | 12 | 13 |
| 10+ | 4 | 1 | 5 | 5 |
| Total | 346 | 95 |
Of the 346 homes that opened during 2020 to 2021, 7 (29 places) had closed again by 31 March 2021. Two of these were LA-run homes that were opened in response to COVID-19. They accounted for 14 places in total.
All of the above changes resulted in a net increase of 251 homes and 703 places.
Over a quarter (97 homes) of the 346 newly registered children’s homes were in the North West. London only accounted for 6% of the new children’s homes.
Table 6: The number and percentage of newly registered and closed children’s homes in 2020 to 2021, split by region
| Region | New registrations in year | Percentage of new registrations in year | Closed in year | Percentage of closed in year |
|---|---|---|---|---|
| England | 346 | 95 | ||
| East Midlands | 43 | 12 | 10 | 11 |
| East of England | 26 | 8 | 8 | 8 |
| London | 22 | 6 | 9 | 9 |
| North East, Yorkshire and the Humber | 66 | 19 | 14 | 15 |
| North West | 97 | 28 | 24 | 25 |
| South East | 22 | 6 | 6 | 6 |
| South West | 26 | 8 | 5 | 5 |
| West Midlands | 44 | 13 | 19 | 20 |
The North West region accounted for almost a quarter (278) of all new places in children’s homes, although it also accounted for one of the largest losses in the number of places (80 places, 18%). The South West, London, East of England and the South East each accounted for less than 10% of new places.
Table 7: The number and percentage of new and closed places in children’s homes in 2020 to 2021, split by region
| Region | Number of new places in year | Percentage of new places in year | Number of places closed in year | Percentage of closed places in year |
|---|---|---|---|---|
| England | 1,155 | 448 | ||
| East Midlands | 157 | 14 | 47 | 10 |
| East of England | 95 | 8 | 32 | 7 |
| London | 90 | 8 | 54 | 12 |
| North East, Yorkshire and the Humber | 203 | 18 | 95 | 21 |
| North West | 278 | 24 | 80 | 18 |
| South East | 103 | 9 | 36 | 8 |
| South West | 71 | 6 | 29 | 6 |
| West Midlands | 158 | 14 | 75 | 17 |
The majority of the 346 new children’s homes were privately run (303, 88%). The North West accounted for almost a third of these new homes (94). LAs ran 7% (26) of these 346 new homes. Half of these LA homes were in the North East, Yorkshire and the Humber region and the other half were split between the remaining regions. As at 31 March 2021, 316 of the 2,462 children’s homes (13%) were LA homes.
Of the 346 new children’s homes, 56 (16%) were owned by 8 of the top 10 largest children’s homes providers. CareTech Holdings Plc registered 18 of these homes and SC Topco Limited registered 10. These 56 children’s homes accounted for 14% (161) of all new places. More detailed data on ownership, exploring beyond the top 10 children’s home providers, will be available in the national social care providers management information being published at the end of July 2021.
Table 8: The number of newly registered and resigned children’s homes owned by the top children’s homes providers
| Top children’s homes provider | New registrations | New places | Closed children’s homes | Closed places |
|---|---|---|---|---|
| CareTech Holdings Plc (191) | 18 | 50 | 2 | 5 |
| Sc Topco Limited (37) | 10 | 24 | 0 | 0 |
| Hcs Group Limited (37) | 8 | 17 | 1 | 6 |
| Horizon Care and Education Ltd (47) | 8 | 25 | 7 | 21 |
| G Square Healthcare Private Equity Llp (Keys Group) (98) | 5 | 22 | 4 | 11 |
| Esland (Esland North Limited, Esland South Limited) (30) | 3 | 8 | 0 | 0 |
| Partnerships In Care Uk 1 Ltd (62) | 3 | 11 | 5 | 30 |
| Sscp Spring Topco Limited (The Outcomes First Group) (52) | 1 | 4 | 0 | 0 |
| The Partnership Of Care Today (35) | 0 | 0 | 1 | 2 |
| Total | 56 | 161 | 20 | 75 |
Numbers in brackets represent the number of children’s homes owned as at 31 March 2020.
Inspection profile of all types of children’s homes as at 31 March 2021
In this section, we report on the 4 types of children’s homes together.
As at 31 March 2021, there were 2,217 (82%) active children’s homes of all types with an inspection judgement. This percentage has dropped since 31 March 2020 (94%) due to the suspension of routine inspection as a result of COVID-19. This meant that any new children’s homes registered in-year would not have yet received a graded full inspection.
Similarly, across all inspected children’s homes, the overall effectiveness grade profile has not changed since the publication of children’s social care data in England 2020 as at 31 March 2020. Just over 80% of all children’s homes were judged good or outstanding, 18% requires improvement to be good and 1% inadequate.
Although the inspection profile is similar for most types of children’s homes, short-break-only homes have a higher proportion of outstanding homes (29%).
Figure 4: Grade profile of all types of children’s homes with inspection outcomes as at 31 March 2021

The overall effectiveness profile is the same as at 31 March 2020, but the overall number of providers with inspection outcomes has changed, as some providers have closed.
Numbers in brackets represent the number of providers with an overall effectiveness grade as at 31 March 2021.
View data in an accessible format.
The grade profiles across the sectors are broadly in line with each other. LAs have the highest proportion of outstanding children’s homes (22%), but they also have a slightly higher proportion of inadequate homes (3%).
Figure 5: Grade profile of all types of children’s homes with inspection outcomes as at 31 March 2021, split by sector

Eight children’s homes run by a health authority are excluded from the chart. As at 31 March 2021, 5 were judged good and 3 requires improvement to be good.
View data in an accessible format.
For a further breakdown of the inspection profile for all types of children’s homes, see last year’s children’s social care data in England 2020. The national picture has not changed since this publication.
Inspections of all types of children’s homes during 2020 to 2021
Although all full inspections of social care providers were suspended in March 2020, between 1 April 2020 and 31 March 2021, almost 60% of all children’s homes of all types (1,557) received some inspection activity in the form of a monitoring and/or assurance visit.
Monitoring visits
We carried out on-site monitoring visits, as necessary, to settings inspected under the SCCIF in line with usual guidance, including to follow up on urgent safeguarding concerns.
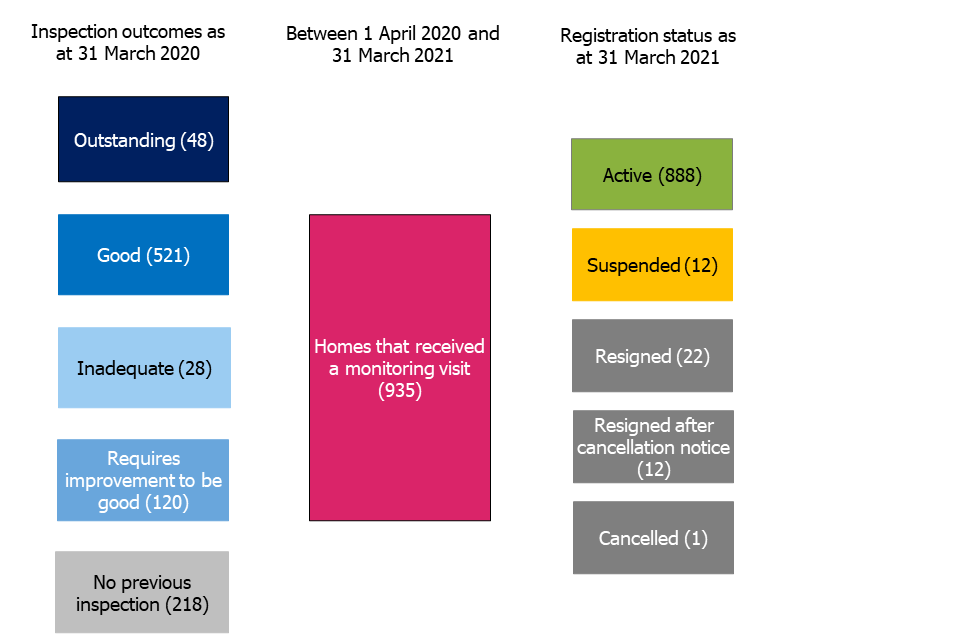
Since 1 April 2020, there have been 1,244 monitoring visits to 935 children’s homes of all types. These homes represented 35% of all children’s homes open at 31 March 2021.
Of the 935 homes visited, 717 (77%) had a full inspection judgement as at 31 March 2020. Just under a quarter (21%) had previously been judged requires improvement to be good, or inadequate. This is slightly higher than the national proportion of 19%.
The other 218 homes were newly registered and had not previously been inspected.
Of the 935 homes we visited, 888 were still active at 31 March 2021, 34 had resigned, 12 were suspended and 1 had been cancelled. Of those that had resigned or were cancelled, 8 had previously been judged inadequate, 15 requires improvement to be good, 11 good and 1 had not previously been inspected.
Of the 34 homes that resigned, 12 resigned after we issued a cancellation notice.
Figure 6: Outcomes for homes that received monitoring visits
View data in an accessible format.
Figure 7: Overall effectiveness profile (at 31 March 2020) of children’s homes that then received a monitoring visit

View data in an accessible format.
Of the 1,244 monitoring visits that took place, most homes visited were children’s homes, with 1,178 visits to 886 homes. There were 38 visits to 23 residential special schools (registered as children’s homes), 26 visits to 25 short-break-only homes and 2 visits to 1 secure children’s home.
Table 9: Number of monitoring visits in year by type of children’s homes
| Type of children’s home | Number of monitoring visits | Number of homes inspected |
|---|---|---|
| All children’s homes | 1,244 | 935 |
| Children’s home | 1,178 | 886 |
| Residential special school (registered as a children’s home) | 38 | 23 |
| Short-break-only children’s home | 26 | 25 |
| Secure children’s homes | 2 | 1 |
Assurance visits
As part of a phased return to routine inspection, from 1 September 2020, Ofsted started carrying out assurance visits to children’s social care services. At these visits, inspectors evaluated the extent to which:
- children were well cared for
- children were safe
- leaders and managers were exercising strong leadership
We prioritised visits based on the most recent inspection judgements, other information we hold about the provider, the amount of time since the last inspection and whether the provider is newly registered and therefore has not yet been inspected.
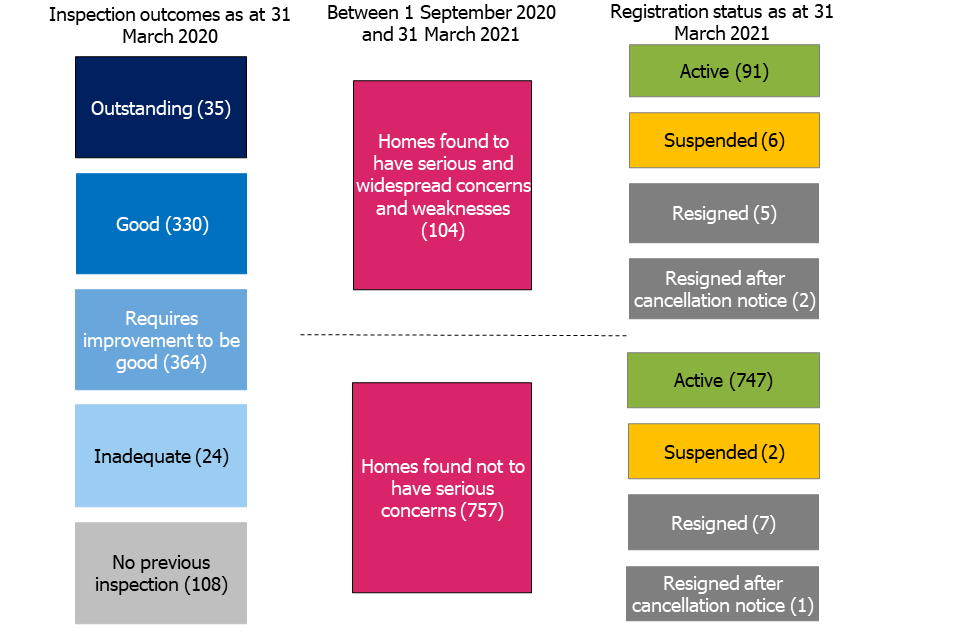
Between 1 September 2020 and 31 March 2021, we carried out 861 assurance visits to 861 prioritised children’s homes of all types. Most homes visited were children’s homes (793). Twenty-nine short-break-only children’s homes, 26 residential special schools (registered as children’s homes) and all 13 secure children’s homes were visited.
Of the 861 homes visited, 753 had an overall effectiveness grade at 31 March 2020. Just under half (48%) had previously been judged requires improvement to be good and 3% had been judged inadequate.
In total, 239 of the 861 homes that received an assurance visit also received at least 1 monitoring visit in the year.
Of the 861 prioritised homes visited, 12% (104) were found to have serious and widespread concerns. Many of these serious concerns related to the care or protection of children at the homes, specifically around:
- poor safeguarding of children
- ineffective management
- poorly maintained homes
- inadequate response to risks
Of the 104 homes that were found to have serious concerns, their previous inspection outcomes as at 31 March 2020 were: 1 (1%) outstanding, 41 (39%) good, 36 (35%) requires improvement to be good and 4 (4%) inadequate. The remaining 22 (21%) homes had not previously been inspected. Of these 22 homes, 1 had resigned by 31 March 2021.
The 861 homes that received an assurance visit were prioritised based on concerns about the home, dependent on the factors already discussed above.
Figure 8: Outcomes for homes that received an assurance visit
View data in an accessible format.
Regulatory activity in all children’s homes between 1 April 2020 and 31 March 2021
An important part of our work, which has continued throughout the pandemic, is the regulation of social care settings.
Complaints and child protection notifications
Between 1 April 2020 and 31 March 2021, we received 932 complaints about 629 providers. This is an increase on the number of complaints received in the previous 2 years (788 in 2019 to 2020 and 813 in 2018 to 2019). We received a complaint about around a quarter of homes, in line with the previous 2 years.
We also received 169 child protection notifications over the course of the year. This is higher than the number received in 2019 to 2020 (101 notifications) but in line with figures for 2018 to 2019 (166 notifications).
Of these 1,101 total complaints and notifications, 874 (79%) had one or more actions recorded by the end of March 2021. Table 10 shows the number and type of actions recorded during 2020 to 2021. Cases can have multiple actions taken, so Table 10 will add up to more than 874 cases.
Table 10: Number and type of actions taken in 2020 to 2021
| Action taken | Number of actions in 2020 to 2021 |
|---|---|
| Provider-led investigation | 319 |
| Continued monitoring by allocated inspector | 311 |
| Key line of enquiry for next inspection | 309 |
| Monitoring visit | 134 |
| Compliance and enforcement action | 77 |
| Referred to child protection team in the relevant local authority | 74 |
| Inspection brought forward | 31 |
| Other action taken not included in other categories [footnote 2] | 104 |
| Not for Ofsted | 35 |
| Total actions taken | 1394 |
Enforcement activity
Between 1 April 2020 and 31 March 2021, we carried out the following enforcement actions across all children’s homes:
- 63 restrictions of accommodation
- 44 suspensions of providers
- 2 cancellations of providers
The 63 restrictions of accommodation occurred in 54 different children’s homes in 2020 to 2021, with 9 homes receiving multiple restrictions of accommodation in year. One of these homes was later cancelled by Ofsted.
The 44 suspensions occurred in 36 different children’s homes during 2020 to 2021, with 8 homes receiving multiple suspensions in-year. Of these 36 homes, one was cancelled in-year by Ofsted, 16 resigned and 9 were still suspended on 31 March 2021. The remaining 10 homes were active on 31 March 2021.
Ofsted cancelled 2 homes in-year. One home received a restriction of accommodation, followed by a suspension. It was cancelled after an assurance visit identified serious and/or widespread concerns. The other was cancelled as the home failed to sustain improvement across its period of registration.
We are carrying out work exploring the reasons for enforcement activity and hope to discuss these in our Annual Report.
Incident notifications received from children’s homes between 1 April 2020 and 31 March 2021
As the regulator for children’s homes in England, providers must tell us about the most serious incidents that happen to children living with them and what they have done in response.
Between 1 April 2020 and 31 March 2021, we received a total of 28,743 notifications from social care providers. The majority of these (22,135, 77%) came from children’s homes, in line with previous years.
Almost half of all notifications (47%) received from children’s homes in 2020 to 2021 related to an accident or illness of a child in the home. Of these, around 12% were related to COVID-19. Children’s homes do not need to notify us about events that fall into the category of accident or illness. Police callouts to the home were the next highest category and accounted for over a quarter of notifications (28%).
Figure 9: A breakdown of the types of events contained in notifications made by children’s homes in 2020 to 2021, by those required by Ofsted (blue) and those not required (pink)
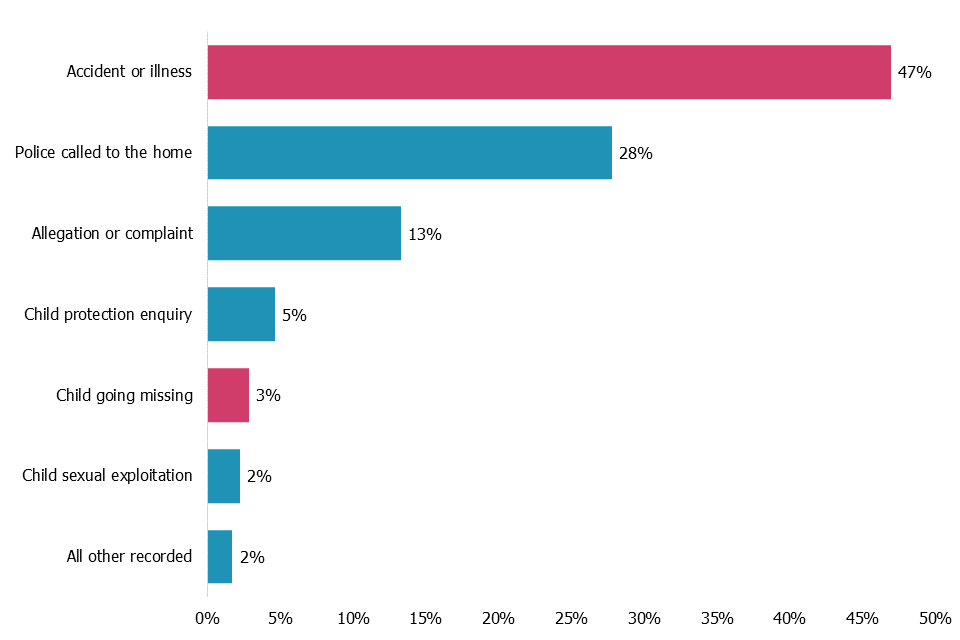
One per cent of notifications did not have a reason recorded and are not presented here. Therefore, percentages do not add up to 100.
View data in an accessible format.
Unregistered children’s homes
Alongside our regulatory work, we receive and investigate notifications about potentially unregistered children’s homes. Between 1 April 2020 and 31 March 2021, we carried out 229 investigations into possible unregistered settings.
After investigation, just over a third of the 229 settings (83) did not need to be registered. Many of these were providers of supported accommodation and similar unregulated placements.
Just under two thirds of settings (136) should have been registered with us as children’s homes. Around 60% of those unregistered settings (84) were sent a ‘cease and apply’ letter, encouraging them to apply to register with Ofsted as a children’s home. Others were either already in the process of registering with Ofsted or had ceased to operate as they no longer had children living there. For a very small number of cases, the investigation was still ongoing.
Other social care providers
On 31 March 2021, there was an increase in the number of settings for 4 provider types. These were adoption support agencies, IFAs, residential family centres and residential holiday schemes for disabled children. There was a decrease in the number of settings for another 4 types. These are boarding schools, residential special schools, further education colleges with residential accommodation and VAAs. There was no change in the number of secure training centres, which remained at 2.
Between 1 April 2020 and 31 March 2021, we carried out a total of 132 visits to 110 other social care providers. Of these 132 visits, 73 were assurance visits and 59 were monitoring visits. Over half of all visits were carried out in IFAs. None of these visits resulted in a graded judgement, but 3 settings were found to have serious and widespread concerns.
Inspection profile as at 31 March 2021
As at 31 March 2021, there were 696 active or suspended settings, not including children’s homes. This is in line with 698 settings in the previous year. Just under half of these settings (317, 46%) were IFAs.
Of these 696 settings, the majority (620, 89%) had a full inspection outcome as at 31 March 2021. The providers that we had not yet inspected were mostly new. Due to graded inspections stopping as a result of COVID-19, any new providers registered in-year would not have yet received a graded full inspection.
Figure 10: Inspection judgement profile at 31 March 2021
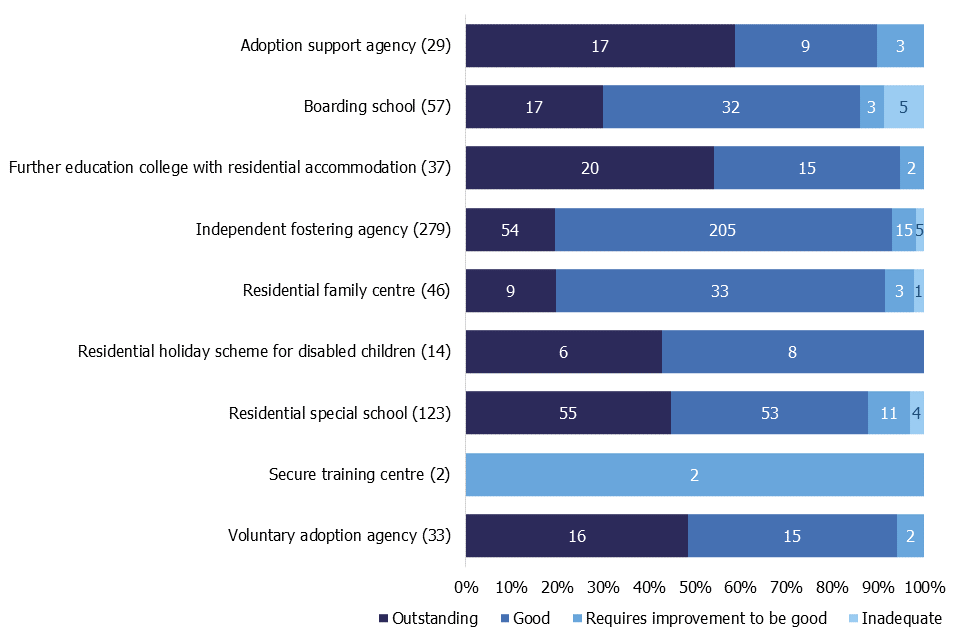
Numbers in brackets represent the number of other social care providers with an overall effectiveness grade as at 31 March 2021.
View data in an accessible format.
Inspections of social care providers other than children’s homes during 2020 to 2021
Between 1 April 2020 and 31 March 2021, we carried out a total of 132 inspections of 110 other social care providers. In total, there were 73 assurance visits and 59 monitoring visits to settings other than children’s homes in 2020 to 2021.
Figure 11: Number of visits to other social care providers between 1 April 2020 and 31 March 2021, by visit type

View data in an accessible format.
Of the 73 assurance visits, the majority (66%) were carried out in IFAs. Of these agencies, 2 were found to have serious and widespread concerns. Almost a quarter of the visits (23%) were carried out in residential special schools; one was found to have serious and widespread concerns. The majority (51 settings, 70%) of assurance visits were carried out in settings that had received a previous judgement of inadequate or requires improvement to be good, or those newer settings that have yet to receive a graded inspection.
We carried out 59 monitoring visits to 49 settings. Three quarters were carried out in either IFAs (37%) or residential family centres (37%). Of these 49 settings: 26 were judged good at their last inspection, 5 were judged requires improvement to be good and 9 were judged inadequate. There were 8 settings visited that had not yet received a graded inspection. Of these 59 visits, we carried out 2 monitoring visits at the request of the Department for Education to a boarding school registered with the Independent Schools Inspectorate.
Regulatory activity between 1 April 2020 and 31 March 2021
As with children’s homes, we have continued to regulate and register other social care providers throughout the pandemic.
Between 1 April 2020 and 31 March 2021, we cancelled the registration of 1 IFA and suspended 3 other providers (2 residential family centres and 1 IFA). Of the 3 suspended providers, one remained suspended on 31 March 2021, one resigned in year and one had returned to active status by 31 March 2021.
For both cancellations and suspensions, this is broadly in line with the same period in 2019 to 2020.
Revisions to previous release
We have published revised data covering children’s homes in the period 1 April 2020 to 31 August 2020 as part of this release.
The revision of statistics relating to 1 April 2020 to 31 August 2020 from ‘provisional’ to ‘revised’ status includes no additional inspections. All inspections carried out in this period were published by 30 September 2020 and included in the above release.
We publish revisions to data in this publication in line with our revisions policy for official statistics.
Further information
Notes
The new Bournemouth, Christchurch and Poole LA was formed from the old Bournemouth and Poole LAs and the Christchurch region of Dorset. The new Dorset LA is therefore smaller as a result. Neither of these newly formed LAs have yet received a standard or short ILACS inspection. Therefore, throughout this release, we have excluded these 2 LAs from the LA judgement profile as at 31 March 2021. We have, however, included these LAs in the in-year inspection activity where they received monitoring or focused assurance visits.
All social care providers are inspected by Regulatory Inspectors and Her Majesty’s Inspectors under the SCCIF, except for secure training centres, where there is a joint inspection with other inspectorates.
We inspect most providers annually. These include:
- children’s homes
- residential special schools
- secure training centres
- residential holiday schemes for disabled children
We inspect IFAs on a 3-year inspection cycle.
When we talk about ‘other social care providers’, we are referring to all providers other than children’s homes (all 4 types). In previous releases, ‘other social care providers’ has also excluded IFAs. In this release, IFAs are included in the ‘other social care providers’ data.
Ten LAs have alternative delivery models where all the statutory functions are delegated to third-party bodies, a children’s trust or a not-for-profit organisation. There are also a small number of LAs that have delegated part of their functions to other organisations. All agencies that perform the fostering or adoption functions of an LA must register with Ofsted as an IFA or a VAA respectively. They are included in the analysis and the grade profile of IFAs and VAAs, if applicable.
In a small number of cases, when data on the number of places for other social care providers is not available, we have used estimates. For the full picture of changes in the number of providers and places since September 2011, see the underlying data file ‘Providers+places six monthly’ tab.
Due to rounding, percentages might not add up to 100.
There is a quality and methodology report and glossary to accompany this release.
Contacts
If you are a member of the public and have any comments or feedback on this publication, contact Adam King (adam.king@ofsted.gov.uk) or the social care team socialcaredata@ofsted.gov.uk.
Acknowledgements
Thanks to the following for their contribution to this statistical release: Klara Davies and Jade Davies.
Glossary
Definitions of terms are in the statistical glossary.
Annex: data tables for figures
This section contains the underlying data in an accessible table format for all figures.
Data for Figure 1: LA overall effectiveness as at 31 March 2021 and after first SIF inspection
| % Outstanding | % Good | % Requires improvement to be good | % Inadequate | |
|---|---|---|---|---|
| As at 31 March 2021 (149) | 12 | 38 | 36 | 14 |
| After each LA’s first SIF inspection, as at October 2017 (151) | 2 | 34 | 43 | 22 |
See Figure 1.
Data for Figure 2: The number of settings as at 31 March 2021 by provider type, and the change from 31 March 2020
| Type of provider | Number of settings on 31 March 2021 | Percentage change since 31 March 2021 |
|---|---|---|
| Children’s homes of all types | 2,706 | 10% increase |
| Independent fostering agencies | 317 | 6% increase |
| Residential family centres | 59 | 2% increase |
| Residential holiday schemes for disabled children | 18 | 6% increase |
| Adoption support agencies | 38 | 15% increase |
| Voluntary adoption agencies | 37 | 5% decrease |
| Secure training centres | 2 | No change |
| Boarding schools | 60 | 14% decrease |
| Residential special schools | 126 | 7% decrease |
| FE colleges with residential accommodation | 39 | 9% decrease |
See Figure 2.
Data for Figure 3: The split by sector of children’s homes and places as at 31 March 2021
| Places as at 31 March 2021 | Children’s homes as at 31 March 2021 | |
|---|---|---|
| LA | 17% | 14% |
| Private | 78% | 83% |
| Voluntary | 5% | 4% |
See Figure 3.
Data for Figure 4: Grade profile of all types of children’s homes with inspection outcomes as at 31 March 2021
| Type of children’s home | Percentage outstanding | Percentage good | Percentage requires improvement to be good | Percentage inadequate |
|---|---|---|---|---|
| Secure children’s home (13) | 15 | 54 | 31 | 0 |
| Residential special school (registered as a children’s home) (65) | 18 | 62 | 20 | 0 |
| Short-break-only children’s homes (154) | 29 | 61 | 9 | 1 |
| Children’s homes (1,985) | 16 | 65 | 18 | 1 |
| All children’s homes (2,217) | 17 | 64 | 18 | 1 |
See Figure 4.
Data for Figure 5: Grade profile of all types of children’s homes with inspection outcomes as at 31 March 2021, split by sector
| Type | % Outstanding | % Good | % Requires improvement to be good | % Inadequate |
|---|---|---|---|---|
| Voluntary (129) | 19 | 66 | 14 | 1 |
| Private (1,676) | 15 | 65 | 18 | 1 |
| LA (404) | 22 | 60 | 16 | 3 |
See Figure 5.
Data for Figure 6: Outcomes for homes that received monitoring visits
| Inspection outcome as at 31 March 2020 | Number of children’s homes of all types |
|---|---|
| Outstanding | 48 |
| Good | 521 |
| Requires improvement to be good | 120 |
| Inadequate | 28 |
| No previous inspections | 218 |
935 homes received a monitoring visit between 1 April 2020 and 31 March 2021.
| Registration status as at 31 March 2021 | Number of children’s homes of all types |
|---|---|
| Active | 888 |
| Suspended | 12 |
| Resigned | 22 |
| Resigned after cancellation notice | 12 |
| Cancelled | 1 |
See Figure 6.
Data for Figure 7: Overall effectiveness profile (at 31 March 2020) of children’s homes that then received a monitoring visit
| Percentage outstanding | Percentage good | Percentage requires improvement to be good | Percentage inadequate | |
|---|---|---|---|---|
| All children’s homes (2,217) | 17 | 64 | 18 | 1 |
| Children’s homes that received monitoring visits (717) | 7 | 73 | 17 | 4 |
See Figure 7.
Data for Figure 8: Outcomes for homes that received an assurance visit
| Inspection outcome as at 31 March 2020 | Number of children’s homes of all types |
|---|---|
| Outstanding | 35 |
| Good | 330 |
| Requires improvement to be good | 364 |
| Inadequate | 24 |
| No previous inspections | 108 |
| Outcomes of assurance visits between 1 September 2020 and 31 March 2021 | Number of children’s homes of all types |
|---|---|
| Homes found to have serious and widespread concerns and weaknesses | 104 |
| Homes found not to have serious concerns | 757 |
| Registration status as at 31 March 2021 | Homes found to have serious and widespread concerns and weaknesses (104) |
|---|---|
| Active | 91 |
| Suspended | 6 |
| Resigned | 5 |
| Resigned after cancellation notice | 2 |
| Registration status as at 31 March 2021 | Homes found not to have serious concerns (757) |
|---|---|
| Active | 747 |
| Suspended | 2 |
| Resigned | 7 |
| Resigned after cancellation notice | 1 |
See Figure 8.
Data for Figure 9: A breakdown of the types of events contained in notifications made by children’s homes in 2020 to 2021, by those required by Ofsted (blue) and those not required (pink)
| Number of notifications | |
|---|---|
| Accident or illness | 47% |
| Police called to the home | 28% |
| Allegation or complaint | 13% |
| Child protection enquiry | 5% |
| Child going missing | 3% |
| Child sexual exploitation (CSE) | 2% |
| All other recorded | 2% |
See Figure 9.
Data for Figure 10: Inspection judgement profile at 31 March 2021
| Outstanding | Good | Requires improvement to be good | Inadequate | |
|---|---|---|---|---|
| Adoption support agency (29) | 17 | 9 | 3 | 0 |
| Boarding school (57) | 17 | 32 | 3 | 5 |
| Further education college with residential accommodation (37) | 20 | 15 | 2 | 0 |
| Independent fostering agency (279) | 54 | 205 | 15 | 5 |
| Residential family centre (46) | 9 | 33 | 3 | 1 |
| Residential holiday scheme for disabled children (14) | 6 | 8 | 0 | 0 |
| Residential special school (123) | 55 | 53 | 11 | 4 |
| Secure training centre (2) | 0 | 0 | 2 | 0 |
| Voluntary adoption agency (33) | 16 | 15 | 2 | 0 |
See Figure 10.
Data for Figure 11: Number of visits to other social care providers between 1 April 2020 and 31 March 2021, by visit type
| Type of visit | Number of visits in 2020 to 2021 |
|---|---|
| Monitoring visit | 59 |
| Assurance visit | 73 |
| Total number of visits in 2020 to 2021 | 132 |
See Figure 11.
-
For more information, see the Ofsted blog on the sufficiency of secure children’s homes published in June 2020. ↩
-
Other action taken includes any action that does not fall under one of the named categories. An example of this would be a complaint about a possible unregistered children’s home. ↩