Children in low income families: local area statistics: FYE 2015 to FYE 2020
Published 25 March 2021

© Crown copyright 2021
This publication is licensed under the terms of the Open Government Licence v3.0 except where otherwise stated. To view this licence, visit nationalarchives.gov.uk/doc/open-government-licence/version/3 or write to the Information Policy Team, The National Archives, Kew, London TW9 4DU, or email: psi@nationalarchives.gov.uk.
Where we have identified any third party copyright information you will need to obtain permission from the copyright holders concerned.
This publication is available at https://www.gov.uk/government/statistics/children-in-low-income-families-local-area-statistics-2014-to-2020/children-in-low-income-families-local-area-statistics-fye-2015-to-fye-2020
The latest release of these statistics can be found in the Children in low income families: local area statistics collection.
This is the second release of these statistics which complement the Households Below Average Income (HBAI) release.
This is an annual release and the next release will be in Spring 2022.
Coverage of the statistics has been extended from Great Britain to United Kingdom. Statistics back to financial year ending (FYE) 2015 have been updated on Stat-Xplore and in supporting data tables to include Northern Ireland geographies.
Feedback and queries about the statistics can be sent to stats.consultation-2018@dwp.gov.uk.
1. Introduction
This bulletin contains official statistics on the number and proportion of children living in low income families, Before Housing Costs (BHC), across the United Kingdom by local area for the financial year ending (FYE) 2020.
Coverage of the statistics in this release has been extended from Great Britain to United Kingdom due to improvements in Northern Ireland source data.
These statistics complement and should be viewed as a companion release to the Households Below Average Income (HBAI) survey on children in low income households which provides national and regional estimates but not local area estimates. These local area statistics are calibrated to, and thus match, the 3-year average HBAI survey estimates at national and regional level for the United Kingdom.
2. Main stories
The headline statistics for this release are:
- in financial year ending (FYE) 2020, there were 2.99 million children (aged 0 to 19) living in families in Relative low income and 2.44 million children (aged 0 to 19) in Absolute low income across the United Kingdom; 81% of children were aged under 16 for both measures
- in the United Kingdom, the proportion of children aged under 16 in low income families was 19% for Relative and 16% for Absolute
- at a local level, the proportion of children aged under 16 living in low income families varies greatly, ranging from 4% to 39% across local authorities for Relative low income and from 4% to 33% for Absolute low income
- Middlesbrough had the highest proportion of children aged under 16 in low income families for both Relative (39%) and Absolute (33%) measures
- City of London had the lowest proportion of children aged under 16 in low income families, with a rate of 4% for both Relative and Absolute measures
- all regions and countries across the United Kingdom had more children aged 0 to 19 in working low income families than not in working ones for both Relative and Absolute measures
3. What you need to know
The statistics in this bulletin relate to the number and proportion of children living in low income families by local area across the United Kingdom. These statistics are a measure of children and cannot be used to obtain the number of low income families.
The statistics complement and are calibrated to DWP’s Households Below Average Income (HBAI) statistics, which contains the headline measures for children in low income households at a national and regional level, by providing local area statistics.
There is no material impact of COVID-19 upon the data used in this release. The Family Resources Survey (FRS) 2019 to 2020 data (which HBAI estimates are based on) forms a key, pre-pandemic baseline of household incomes.
A minor methodological revision has been made to capture all income from child maintenance in HBAI. This has resulted in more income from child maintenance being included, which in turn has slightly increased some household incomes and slightly reduced low income rates for families with children. The full back series of HBAI and Children in low income families: local area statistics have been revised. This means previously published statistics may be slightly different to those published in this year’s release.
DWP has a statutory obligation to publish measures of Absolute and Relative low income, and low income and material deprivation for children under section 4 of the Welfare Reform and Work Act 2016 and this is provided through the annual HBAI and Income Dynamics publications. HBAI is only able to provide estimates of children in low income at national and regional level, however there is significant demand for local area measures from users such as local authorities.
Measures of the statistics
Statistics are calibrated to the 3-year average HBAI regional and work status aggregates, thus the national and region totals in these statistics match equivalent statistics in the 3-year average HBAI statistics.
The United Kingdom financial year ending (FYE) 2020 figure is formed from the HBAI 3-year average from between FYE 2018 and FYE 2020.
A family must have claimed Child Benefit and at least one other household benefit (Universal Credit, tax credits or Housing Benefit) at any point in the year to be classed as low income in these statistics. Relative low income measures families in low income in the reference year, whereas Absolute low income measures families in low income based on what low income looked like in FYE 2011. Income is Before Housing Costs (BHC) and is equivalised to adjust for family size and composition. See definitions for more information about the terminology used throughout this release.
The statistics relate to activity throughout the financial year. The count of children refers to the age of the child at 31 March of each year.
Figures in this bulletin are rounded in accordance with the DWP rounding policy for statistics. Perturbed figures from the underlying data available on Stat Xplore or in accompanying tables may not sum exactly to the rounded totals accordingly. See the rounding policy for more information.
Calculation of rates
Proportions (also referred to as rates) are calculated by dividing the unrounded number of children aged under 16 in a geographical area (for example, a local authority), by the population aged under 16 in that geographical area. Populations have been taken from mid-year population estimates which are an estimate of the usual resident population as at 30 June of the reference year. The mid-2019 population estimates were the latest available at the time of release.
Figures on the proportion of children are presented for children aged under 16 due to difficulty in identifying child dependents aged 16 to 19 in the mid-year population estimates. Statistics on the proportion of children in low income families at local authority, Parliamentary constituency, and ward level can be found in supporting data tables.
Stat-Xplore
More detailed breakdowns on the number of children in Relative and Absolute low income families, including those aged 16 to 19, can be found via DWP’s online tabulation tool Stat-Xplore. The statistics released on Stat-Xplore can be broken down by age and gender of child, family type, work status, and a range of geographies (including Parliamentary constituency, ward and lower super output area). Stat-Xplore allows users to analyse the number (and proportion) of children in low income families within and across small areas since FYE 2015.
The background information and methodology gives more information on the construction of these statistics.
4. Proportion of children living in low income families
Figures in this section are presented for children aged under 16. Numbers for all children in low income families, including those aged 16 to 19, can be found on Stat-Xplore.
In financial year ending (FYE) 2020, there were 2.99 million children (aged 0 to 19) in families in Relative low income and 2.44 million children (aged 0 to 19) in Absolute low income families across the United Kingdom. 81% of children were aged under 16 for both Relative and Absolute measures.
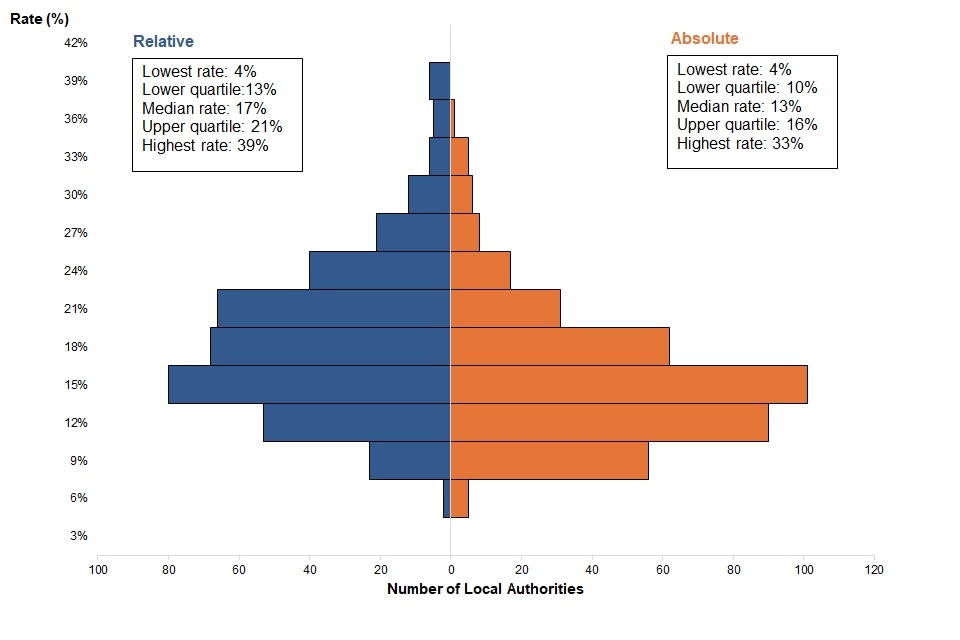
At a local level, the proportion of children aged under 16 living in low income families varies greatly, ranging from 4% to 39% across local authorities for Relative low income families and from 4% to 33% for Absolute low income families in FYE 2020. The majority of local authorities had a rate of children aged under 16 in low income families that falls between 10% and 20%.
Proportion of children aged under 16 in Relative and Absolute low income families by number of local authorities, United Kingdom, financial year ending 2020
Over 60% of local authorities had a proportion of children in low income families between 10% and 20%.
Source:
- DWP Stat-Xplore, Children in Low Income Families, local authority by age
- ONS Nomis, Population Estimates, local authority by age
For children aged under 16 in Relative low income families, 61% of the 382 local authorities across the United Kingdom had a rate between 10% and 20%. Only 4% of local authorities had a rate over 30%. The United Kingdom had a rate of 19% for children aged under 16 in Relative low income families in FYE 2020.
In comparison, 67% of local authorities had a rate of children aged under 16 in Absolute low income families between 10% and 20%. Only 2% of local authorities had a rate over 30%. The United Kingdom had a rate of 16% for children aged under 16 in Absolute low income families in FYE 2020.
Note: Figures at the national level are based on HBAI 3-year averages.
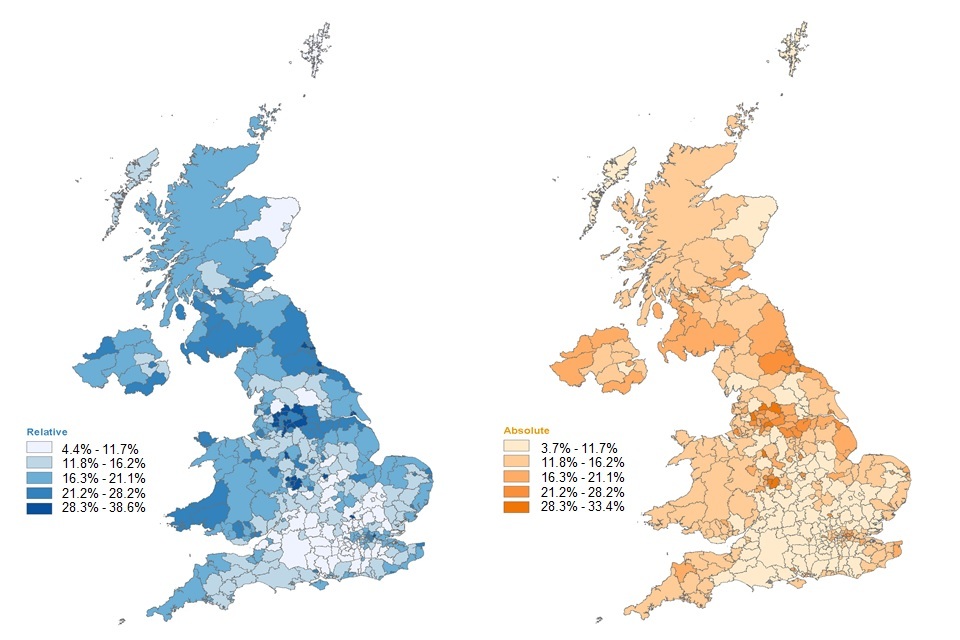
Proportion of children aged under 16 in Relative and Absolute low income families by local authority (quintiles), United Kingdom, financial year ending 2020
There are clusters of local authorities in the South East with lower proportions of children in low income families.
Source:
- DWP Stat-Xplore, Children in Low Income Families, local authority by age
- ONS Nomis, Population Estimates, local authority by age
The proportion of children in low income families across local authorities can be classified using quintiles. This means group ranges are calculated to split local authorities evenly, so approximately 20% of local authorities fit into each group. To allow comparison, the same quintile bandings have been used for both Relative and Absolute low income measures.
In FYE 2020, areas with the highest and lowest rates were similar for Relative and Absolute low income measures.
The top quintile shows the group of local authorities which have the highest rates of children aged under 16 in low income families. Local authorities within the North West and West Midlands regions are within the top quintile.
In contrast, the bottom quintile shows the group of local authorities which have the lowest rates of children in low income families. There are clusters of local authorities across the South East region which fall within the bottom quintile.
5. Areas with the highest and lowest proportions of children in low income families
Figures in this section are presented for children aged under 16. Numbers for all children in low income families, including those aged 16 to 19, can be found on Stat-Xplore.
Highest proportions
In financial year ending (FYE) 2020, Middlesbrough was the local authority with the highest proportion of children aged under 16 in low income families for both Relative and Absolute measures at 39% and 33% respectively.
The 20 local authorities with the highest proportions of children aged under 16 in Relative low income families, United Kingdom, financial year ending 2020
The proportion of children in Relative low income families was highest in Middlesbrough (39%), increasing by 3 percentage points since FYE 2019.
| Local Authority | Proportion of children (%) | Change on year (percentage point) |
|---|---|---|
| Middlesbrough | 38.6 | +3.1 |
| Oldham | 37.7 | -0.6 |
| Bradford | 37.6 | +2.7 |
| Pendle | 37.3 | -0.8 |
| Birmingham | 36.9 | +3.2 |
| Blackburn with Darwen | 36.5 | -0.6 |
| Stoke-on-Trent | 34.4 | +3.8 |
| Sandwell | 34.3 | +3.2 |
| Manchester | 33.8 | -0.8 |
| Hyndburn | 33.1 | -0.7 |
| Burnley | 33.1 | -0.9 |
| Bolton | 32.7 | +0.5 |
| Kingston upon Hull, City of | 32.2 | +2.1 |
| Walsall | 31.8 | +3.1 |
| Wolverhampton | 31.6 | +3.2 |
| Leicester | 31.4 | +2.4 |
| Newcastle upon Tyne | 31.1 | +2.8 |
| Rochdale | 29.8 | -0.2 |
| Hartlepool | 29.4 | +3.2 |
| South Tyneside | 29.2 | +3.7 |
Source:
- DWP Stat-Xplore, Children in Low Income Families (Relative), local authority by age
- ONS Nomis, Population Estimates, local authority by age
Oldham (38%) had the second highest proportion of children aged under 16 in Relative low income families in FYE 2020 after being the highest ranking local authority in the United Kingdom in FYE 2019. Bradford (38%) was the local authority with the next highest rate, increasing by 3 percentage points since the previous year.
Out of the top 20 local authorities with the highest proportions of children in Relative low income families, 8 are located in the North West.
The 20 local authorities with the highest proportions of children aged under 16 in Absolute low income families, United Kingdom, financial year ending 2020
The proportion of children in Absolute low income families was highest in Middlesbrough (33%), increasing by 4 percentage points since FYE 2019.
| Local Authority | Proportion of children (%) | Change on year (percentage point) |
|---|---|---|
| Middlesbrough | 33.4 | +3.6 |
| Bradford | 32.3 | +1.3 |
| Oldham | 31.6 | -2.0 |
| Pendle | 31.1 | -2.6 |
| Blackburn with Darwen | 30.3 | -2.1 |
| Birmingham | 30.2 | +2.4 |
| Stoke-on-Trent | 28.3 | +3.6 |
| Sandwell | 28.2 | +2.8 |
| Burnley | 27.7 | -1.2 |
| Manchester | 27.6 | -2.1 |
| Hyndburn | 27.4 | -2.2 |
| Newcastle upon Tyne | 27.2 | +3.6 |
| Bolton | 26.8 | -1.2 |
| Kingston upon Hull, City of | 26.4 | +0.9 |
| Leicester | 25.9 | +1.9 |
| Walsall | 25.8 | +2.4 |
| Wolverhampton | 25.8 | +2.7 |
| Hartlepool | 25.1 | +3.4 |
| South Tyneside | 25.0 | +4.1 |
| Rochdale | 24.5 | -1.7 |
Source:
- DWP Stat-Xplore, Children in Low Income Families (Absolute), local authority by age
- ONS Nomis, Population Estimates, local authority by age
Similar to Relative low income families, Bradford (32%) and Oldham (32%) were within the top three local authorities with the highest proportions of children aged under 16 in Absolute low income families.
Out of the top 20 local authorities with the highest proportions, South Tyneside had the largest change since the previous year with an increase of 4 percentage points to a rate of 25% in FYE 2020.
Lowest proportions
In FYE 2020, City of London had the lowest proportion of children aged under 16 in low income families, with a rate of 4% for both Relative and Absolute measures.
The 20 local authorities with the lowest proportions of children aged under 16 in Relative low income families, United Kingdom, financial year ending 2020
The proportion of children in Relative low income families was lowest in City of London (4%), decreasing by 1 percentage point since FYE 2019.
| Local Authority | Proportion of children (%) | Change on year (percentage point) |
|---|---|---|
| City of London | 4.4 | -0.7 |
| Elmbridge | 5.7 | +0.1 |
| Epsom and Ewell | 6.2 | -0.4 |
| Hart | 6.8 | +0.3 |
| Richmond upon Thames | 6.9 | +0.7 |
| Wokingham | 7.2 | -0.2 |
| Isles of Scilly | 7.5 | -1.2 |
| Waverley | 7.6 | +0.2 |
| St Albans | 7.8 | -0.3 |
| South Northamptonshire | 8.0 | +0.7 |
| East Hertfordshire | 8.0 | +0.5 |
| Guildford | 8.1 | +0.1 |
| Rushcliffe | 8.1 | +0.9 |
| Mole Valley | 8.2 | +0.2 |
| Mid Sussex | 8.2 | +0.5 |
| Kensington and Chelsea | 8.2 | -0.1 |
| Windsor and Maidenhead | 8.3 | +0.3 |
| Vale of White Horse | 8.3 | -0.5 |
| Chiltern | 8.4 | -0.3 |
| Three Rivers | 8.4 | -0.1 |
Source:
- DWP Stat-Xplore, Children in Low Income Families (Relative), local authority by age
- ONS Nomis, Population Estimates, local authority by age
As in the previous year, City of London (4%) and Elmbridge (6%) remained the two local authorities with the lowest proportions of children aged under 16 in Relative low income families in FYE 2020.
Out of the top 20 local authorities with the lowest proportions, Isles of Scilly had the largest change on year with a decrease of 1 percentage point to a rate of 8% in FYE 2020.
The 20 local authorities with the lowest proportions of children aged under 16 in Absolute low income families, United Kingdom, financial year ending 2020
The proportion of children in Absolute low income families was lowest in City of London (4%), decreasing by 1 percentage point since FYE 2019.
| Local Authority | Proportion of children (%) | Change on year (percentage point) |
|---|---|---|
| City of London | 3.7 | -0.7 |
| Elmbridge | 4.6 | -0.4 |
| Epsom and Ewell | 5.1 | -0.7 |
| Richmond upon Thames | 5.4 | +0.4 |
| Hart | 5.8 | +0.1 |
| St Albans | 6.0 | -0.4 |
| Wokingham | 6.1 | -0.6 |
| Kensington and Chelsea | 6.3 | -0.1 |
| Waverley | 6.3 | -0.2 |
| East Hertfordshire | 6.5 | +0.4 |
| Guildford | 6.5 | -0.4 |
| Three Rivers | 6.5 | -0.4 |
| Vale of White Horse | 6.7 | -1.0 |
| Rushcliffe | 6.7 | +0.8 |
| South Cambridgeshire | 6.7 | -0.2 |
| South Northamptonshire | 6.8 | +0.4 |
| Mid Sussex | 6.9 | - |
| Windsor and Maidenhead | 6.9 | -0.2 |
| Mole Valley | 6.9 | -0.2 |
| Chiltern | 7.1 | -0.7 |
Source:
- DWP Stat-Xplore, Children in Low Income Families (Absolute), local authority by age
- ONS Nomis, Population Estimates, local authority by age
The local authorities with the lowest proportions of children aged under 16 in low income families were similar for both Absolute and Relative measures, with the same local authorities ranking within the top 5 for both. All of these local authorities are within the South East and London regions, of which 3 (Elmbridge, Epsom and Ewell, Richmond upon Thames) border one another.
Although City of London had the lowest proportion of children for both Relative and Absolute measures, this may not be the most representative indication of children in low income families. City of London is not known for being a residential area, due to high property prices, as demonstrated by the population count. The mid-2019 population estimates show that City of London was the local authority with the second lowest population of children aged under 16 across the United Kingdom.
Figures on rates for children aged under 16 by local authority, Parliamentary constituency, and ward can be found as a timeseries going back to FYE 2015 via supporting data tables.
6. Family Type and Work Status
The statistics in this section provide a count of the number of children aged 0 to 19 in low income families by family type and work status. They do not provide information on the proportion of children in low income by family type and work status. More information on these can be found in the HBAI release.
Family type
A lone parent family type means the parent or guardian has had no partnerships at any point in the financial year.
The number of children aged 0 to 19 in Relative low income families, region and country, family type, United Kingdom, financial year ending 2020
There were more children in couple Relative low income families than lone parent ones across Great Britain.
| Region or Country | Lone parent | Couple | Total |
|---|---|---|---|
| North East | 73,000 | 82,000 | 156,000 |
| North West | 159,000 | 229,000 | 388,000 |
| Yorkshire and The Humber | 127,000 | 194,000 | 321,000 |
| East Midlands | 79,000 | 115,000 | 194,000 |
| West Midlands | 137,000 | 230,000 | 367,000 |
| East of England | 92,000 | 135,000 | 227,000 |
| London | 164,000 | 259,000 | 424,000 |
| South East | 119,000 | 173,000 | 291,000 |
| South West | 71,000 | 103,000 | 175,000 |
| Wales | 62,000 | 79,000 | 141,000 |
| Scotland | 102,000 | 105,000 | 206,000 |
| Northern Ireland | 49,000 | 48,000 | 97,000 |
Note: See Stat-Xplore for equivalent breakdowns of the statistics relating to Absolute low income.
Source: DWP Stat-Xplore, Children in Low Income Families (Relative), region by family type
Totals may not sum due to rounding.
In financial year ending (FYE) 2020, there were more children aged 0 to 19 in Relative low income families with a couple family type across Great Britain. In Northern Ireland, there were slightly more children with a lone parent family type. However, this difference is marginal with almost half (49%) of the 97,000 children in Relative low income families in Northern Ireland being in couple families.
For the Absolute measure, all regions and countries across the United Kingdom had more children aged 0 to 19 in low income families with a couple family type in FYE 2020. The family type split was largest in the West Midlands with 64% of all children in Absolute low income families being in couple families, compared to 36% in lone parent families.
Work status
Work status reflects family employment activity throughout the financial year.
The number of children aged 0 to 19 in Absolute low income families, region and country, work status, United Kingdom, financial year ending 2020
There were more children in working Absolute low income families than not in working ones across the United Kingdom.
| Region or Country | In working families | Not in working families | Total |
|---|---|---|---|
| North East | 89,000 | 44,000 | 133,000 |
| North West | 204,000 | 114,000 | 318,000 |
| Yorkshire and The Humber | 177,000 | 93,000 | 270,000 |
| East Midlands | 113,000 | 49,000 | 162,000 |
| West Midlands | 201,000 | 98,000 | 299,000 |
| East of England | 131,000 | 46,000 | 177,000 |
| London | 255,000 | 85,000 | 340,000 |
| South East | 185,000 | 58,000 | 242,000 |
| South West | 107,000 | 37,000 | 144,000 |
| Wales | 67,000 | 32,000 | 99,000 |
| Scotland | 112,000 | 61,000 | 173,000 |
| Northern Ireland | 49,000 | 30,000 | 79,000 |
Note: See Stat-Xplore for equivalent breakdowns of the statistics relating to Relative low income.
Source: DWP Stat-Xplore, Children in Low Income Families (Absolute), region by work status
Totals may not sum due to rounding.
In FYE 2020, all regions and countries across the United Kingdom had more children aged 0 to 19 in working low income families, compared to not in working families, for both Relative and Absolute measures.
Over three quarters of all children in Absolute low income families in the South East were in working families. This was similar for the Relative measure where 78% of the 291,000 children aged 0 to 19 in low income families in the South East were in working families.
More detailed statistics are available on Stat-Xplore which allows users to produce bespoke tabulations showing local area analyses by a range of breakdowns over time.
7. About these statistics
Figures for the latest financial year are provisional and subject to revision in subsequent releases. The statistics in this release are not directly comparable to the former DWP (children in out-of-work benefit households) or HMRC (children in low income families local measure) releases. Whilst they complement the statistics released in the Households Below Average Income (HBAI) publication, please note that they are produced from an entirely different data source with some differences in methodology, for example HBAI considers household incomes whereas these statistics cover family incomes (multiple families may live in the same household).
Definitions
| Term | Definition |
|---|---|
| Children | Dependent individuals aged under 16; or aged 16 to 19 in full-time non-advanced education or in unwaged government training. Child age is derived as the duration from date of birth to 31 March in each year. |
| Family | A single adult; or a married or cohabitating couple; or a Civil Partnership; and any dependent children. |
| Equivalised income | Income is gross income Before Housing Costs (BHC) and includes contributions from earnings, state support and pensions. Equivalisation adjusts incomes for family size and composition; taking an adult couple with no children as the reference point. |
| Relative low income | A family in low income Before Housing Costs (BHC) in the reference year. A family must have claimed Child Benefit and at least one other household benefit (Universal Credit, tax credits or Housing Benefit) at any point in the year to be classed as low income in these statistics. |
| Absolute low income | A family in low income Before Housing Costs (BHC) in the reference year in comparison with incomes in financial year ending (FYE) 2011. A family must have claimed Child Benefit and at least one other household benefit (Universal Credit, tax credits or Housing Benefit) at any point in the year to be classed as low income in these statistics. |
| Work status | A family is defined as ‘in-work’ if they have an accumulated period of at least 26 weeks paid employment or self-employment within the 52-week tax year. Employment activity is accumulated from either (or both) the adult claimant of Child Benefit and any partner(s) in the tax year. |
| Family type | Family type accounts for changes in family composition throughout the year (for example, re-partnering, multiple partners). A lone parent family type means the parent/guardian has had no partnerships at any point in the year. |
Rounding policy
Numbers over 1 million are rounded to the nearest 10,000. Numbers less than 1 million are rounded to the nearest 1,000. Percentages are rounded to the nearest whole number, with the exception of the tables and maps which are shown to 1 decimal place. Unrounded figures, with statistical disclosure control applied, can be obtained from Stat-Xplore. Perturbed figures from the underlying data available on Stat-Xplore or in accompanying tables may not sum exactly to the rounded totals accordingly.
Where to find out more
This statistical bulletin gives an overview of the important points and trends. More detailed breakdowns can be found via the supporting data tables or DWP’s online tabulation tool Stat-Xplore.
The statistics within this release have been primarily sourced from the DWP RAPID (Registration and Population Interaction Database) longitudinal data set which provides a single coherent view of citizen interactions with DWP and HMRC within the tax year. The background information and methodology provides a fuller explanation on the purpose, coverage, construction, sources and limitations of the statistics.
Official statistics status
From this release, the experimental statistics label has been replaced by official statistics status. This means that our statistics meet the high standards of trustworthiness, quality and public value and comply with the UK Statistics Authority’s code of practice for statistics. This decision by DWP’s Head of Profession for Statistics reflects factors including user feedback, methodological robustness, coverage, and that the defined development phase for these statistics has ended.
Contact information and feedback
DWP would like to hear your views on these statistics. We would be interested in hearing what you use them for and how well they meet your requirements. Feedback and queries about the statistics can be sent to stats.consultation-2018@dwp.gov.uk.
Press enquiries should be directed to the DWP Press Office: 020 3267 5144
Lead Statisticians: Katie Wong and Russ Bentley
8. Related statistics
DWP Households Below Average Income (HBAI)
Department for Communities Family Resources Survey
ONS working and workless households
English Indices of Deprivation
Welsh Index of Multiple Deprivation
Scottish Index of Multiple Deprivation
ISBN: 978-1-78659-315-3