Child Benefit Statistics: Annual Release, August 2020 Main Commentary
Published 31 March 2021

© Crown copyright 2021
This publication is licensed under the terms of the Open Government Licence v3.0 except where otherwise stated. To view this licence, visit nationalarchives.gov.uk/doc/open-government-licence/version/3 or write to the Information Policy Team, The National Archives, Kew, London TW9 4DU, or email: psi@nationalarchives.gov.uk.
Where we have identified any third party copyright information you will need to obtain permission from the copyright holders concerned.
This publication is available at https://www.gov.uk/government/statistics/child-benefit-statistics-annual-release-august-2020/child-benefit-statistics-annual-release-august-2020-main-commentary
1. Overview
This publication includes details of the number of families claiming Child Benefit as at 31st August 2020, the number and ages of children within those families and their geographical location. Population counts at Country and English Region level are shown, as well as by Local Authority and Parliamentary Constituency (Westminster and Scottish) in the United Kingdom.
Contact details
For queries or feedback on this publication, please contact:
For press queries, please contact:
- HMRC Press Office, tel: 03000 585018
2. Main Headlines
As at 31st August 2020, there were:
7.21 million families in receipt of Child Benefit. This is a fall of approximately 71,000 when compared to a year earlier.
12.52 million children in Child Benefit recipient families. This is a fall of approximately 136,000 when compared to a year earlier.
Number of families and children in receipt of Child Benefit

Number of families in receipt of Child Benefit by region
3. Changes Since Previous Publication
Impacts of the Covid-19 Pandemic
The latest data on Child Benefit for August 2020 shows that the Covid-19 pandemic has had no effect on the falling trend of families claiming Child Benefit or the number of children in Child Benefit recipient families.
Following a four year freeze in Child Benefit payments between 2016/17 and 2019/20, Child Benefit has risen by 1.7% in line with Consumer Price Index (CPI) in 2020/21. This has resulted in Child Benefit increasing from £20.70 to £21.05 per week for the eldest child, and for each subsequent child increasing from £13.70 to £13.95 per week.
Despite the increase in Child Benefit allowance and the number of families likely to be exempt from the HICBC as a result of an increase in employments furloughed since the start of the pandemic, there may be a number of factors leading to a further fall in Child Benefit claimants. This includes provisional data for England and Wales indicating a fall in birth rates (see figure 4.7) and take-up of new Child Benefit claims interrupted by the effects of national lockdowns.
Central estimate of Child Benefit take-up rate in 2018-19
The central estimate of the Child Benefit take-up rate in 2018-19 is 92%. This represents a fall of 1% when compared with the previous year. The Child Benefit take-up rate is a new addition to this year’s release, having previously been published in the Child Benefit, Child Tax Credit and Working Tax Credit Take-up rates publication. The Child Benefit take-up rate represents the proportion of children eligible for Child Benefit who are registered by their parents.
Table 3.1: Caseload take-up rate percentages of Child Benefit by bounds, 2006 to 2019
| Lower bound | Central bound | Upper bound | |
|---|---|---|---|
| 2006-07 | 96 | 97 | 98 |
| 2007-08 | 96 | 97 | 97 |
| 2008-09 | 95 | 96 | 97 |
| 2009-10 | 95 | 96 | 97 |
| 2010-11 | 95 | 96 | 97 |
| 2011-12 | 95 | 96 | 96 |
| 2012-13* | 96 | 96 | 97 |
| 2013-14** | 95 | 95 | 96 |
| 2014-15** | 95 | 96 | 96 |
| 2015-16** | 94 | 94 | 95 |
| 2016-17** | 92 | 93 | 93 |
| 2017-18** | 92 | 93 | 94 |
| 2018-19** | 91 | 92 | 93 |
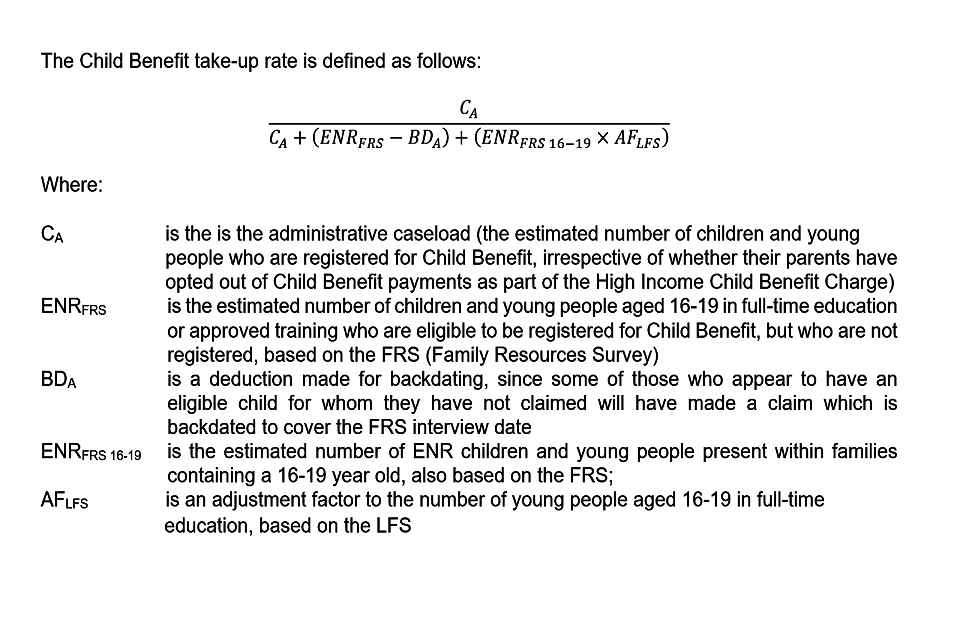
The Child Benefit take-up rate is calculated using three separate data sources. These are:
-
administrative data: used to calculate the caseload – the estimated number of children and young people who are registered for Child Benefit, regardless of whether their parents have opted out of Child Benefit payments as part of HICBC
-
the Family Resources Survey (FRS): a household survey carried out by Department for Work and Pensions, which includes information on family circumstances and income and can be used to determine families entitlement to Child Benefit
-
the Labour Force Survey (LFS): a quarterly household survey which covers education and training activities of young people aged 16 and over
A full description of the method used is available in the Technical Annex.
4. Overall Trends in Time Series
4.1 Number of Families in Receipt of Child Benefit and the Number of Children for Whom Child Benefit Is Received
Figure 4.1: The number of families in receipt of Child Benefit and the number of children for whom Child Benefit is received, 2003 to 2020
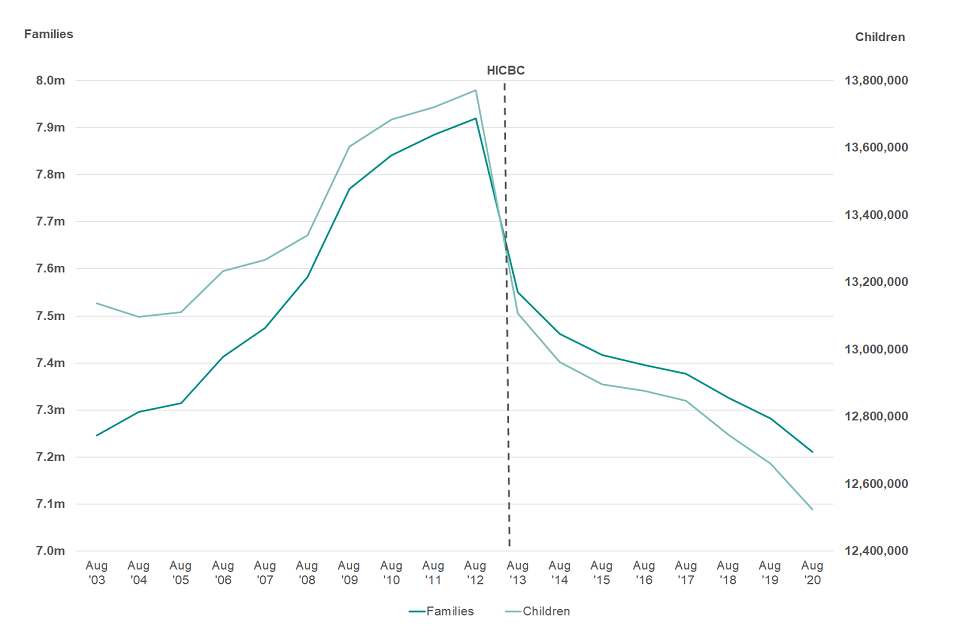
(Source data: Child Benefit Statistics, August ’20 - Table 1)
As at the 31st August 2020, there were approximately 7.21 million families in receipt of Child Benefit and 12.52 million children for whom Child Benefit was received. This is a decrease of approximately 71,000 families and 136,000 children when compared with a year earlier in August 2019. The number of families in receipt of Child Benefit and the number of children for whom Child Benefit is received does not include the number of families or children who have claimed Child Benefit but chosen to opt out of receiving payment since the High Income Child Benefit Charge (HICBC) was introduced in January 2013.
Ahead of August 2013 there had been significant growth in the number of families in receipt of Child Benefit and children for whom Child Benefit is received. However, subsequent to the introduction of the HICBC in January 2013, the number of families in receipt of Child Benefit and children for whom Child Benefit is claimed decreased sharply.
The effects of HICBC are still seen in the 2020 statistics. Following the sharp decrease in August 2013, there has been a downward trend in the number of families and children for whom Child Benefit is received. In August 2020, the number of children for whom Child Benefit is received is at its lowest level since HMRC began producing these statistics (in 2003).
4.2 Number of Families Claiming Child Benefit by Family Size
Figure 4.2: The number of families claiming Child Benefit broken down by family size, August 2003 to August 2020
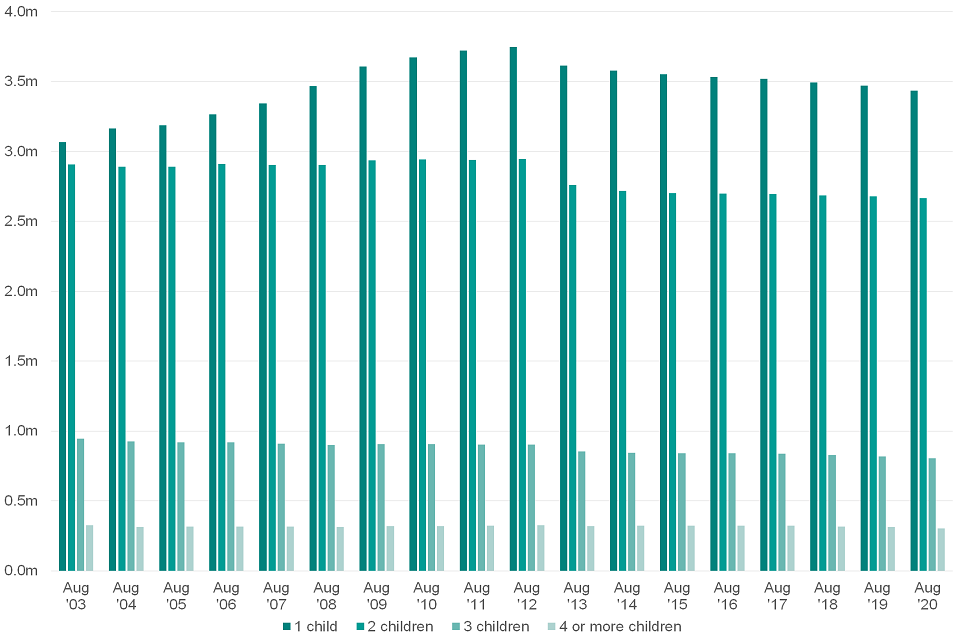
(Source data: Child Benefit Statistics, August ‘20 - Table 2)
The introduction of the HICBC in January 2013 has resulted in a decrease in the number of families in receipt of Child Benefit. This declining trend sees the number of families in receipt of Child Benefit for one child fall to the lowest level since 2007, currently standing at 3.43m.
Families in receipt of Child Benefit for two children had been steadily increasing from 2003 and peaked in 2012 at approximately 2.95m. After the introduction of HICBC, this particular group then fell by 0.19m to 2.76m in 2013 and has steadily declined to 2.67m in 2020.
Families in receipt of Child Benefit for three children has generally seen a steady decline since 2003 with a net fall of approximately 142,000. This figure currently stands at 805,000 in 2020.
Families with four or more children has remained fairly stable. Although the yearly change within this group has fluctuated between 2003 and 2020, the net change over this entire period amounted to approximately 20,000. The figure for 2020 currently stands at 305,000.
4.3 Average Number of Children for Whom Child Benefit Is Received per Family by Country
Figure 4.3: Average number of children for whom Child Benefit is received per family broken down by country, August 2008 to August 2020
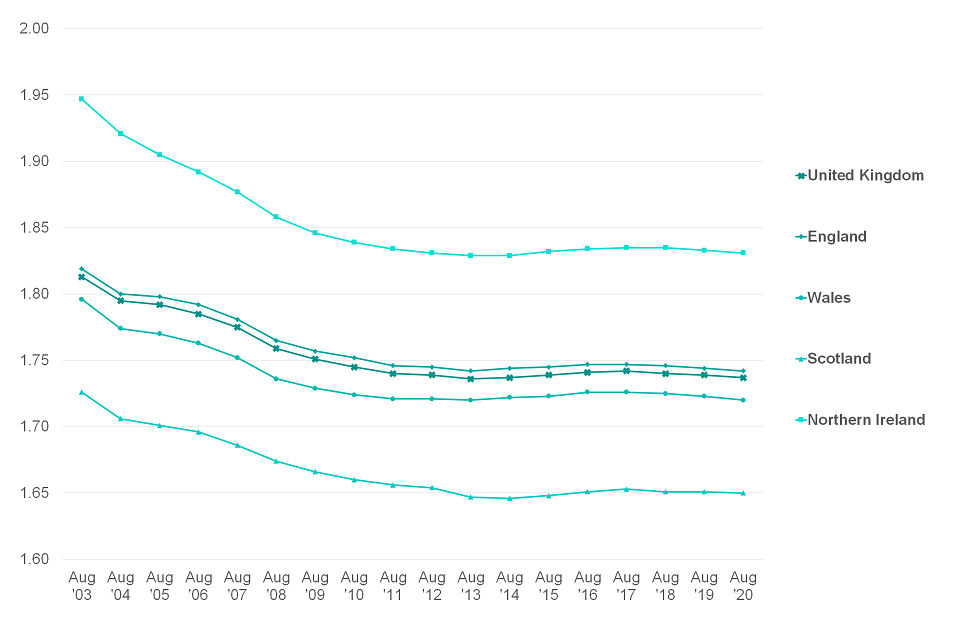
(Source data: Child Benefit Statistics, August ‘20 - Table 1)
The average number of children for whom Child Benefit was received per family in the United Kingdom had fallen each year between 2003 and 2013 from 1.813 to 1.736 (Figure 4.3). However, in 2014 the average rose slightly to 1.737 and this trend continued until 2017 where it stood at 1.742. In 2018, the average fell slightly and this has continued into 2020 where it is currently 1.737, a trend seen in all countries.
4.4 Number of Children for Whom Child Benefit Is Received by Age Group
Figure 4.4: The number of children for whom Child Benefit is received by age group, August 2003 to August 2020
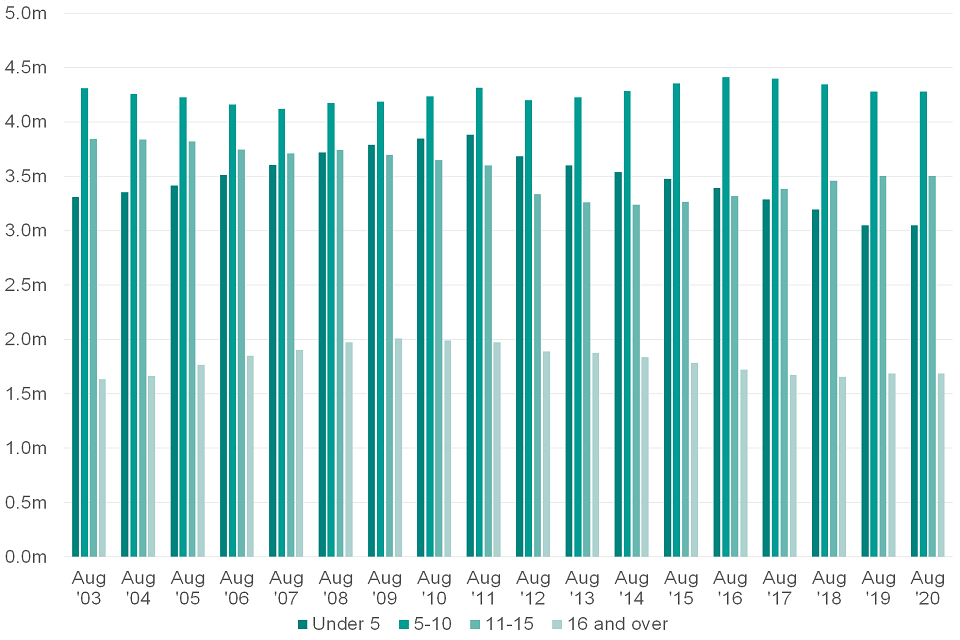
(Source data: Child Benefit Statistics, August ‘20 - Table 2)
The number of children aged under 5 for whom Child Benefit is received increased by approximately 0.58m between 2003 and 2012 to 3.88m. This group then experienced a continued decline from 2013 of approximately 0.69m where it stood at 3.05m in 2020.
Between 2003 and 2008 the number of children aged between 5 and 10 decreased by approximately 0.24m where it stood at 4.12m. The number of children within this age group then increased by approximately 194,000 between 2008 and 2012 but then fell by 0.12m in 2013. Between 2013 and 2017 the number of children this group then increased by approximately 0.22m before falling by 0.07m in 2020, where it stood at approximately 4.28m.
Children aged between 11 and 15 experienced a continual decline between 2003 and 2015 totalling approximately 0.64m, with the largest fall in being attributable to 2013, which accounted for approximately 42% of the total decline in this period. Since 2015, this group then increased by approximately 0.26m to 3.50m in 2020.
From 2003 to 2010, the number of children aged 16 and over increased by approximately 0.42m where it peaked in at 2.01m and then subsequently continued to fall through to 2019. 2020 saw an increase of 0.03 to 1.69m.
4.5 Number of Families in Receipt of Child Benefit and Children for Whom Child Benefit Is Being Received, by Country and English Regions
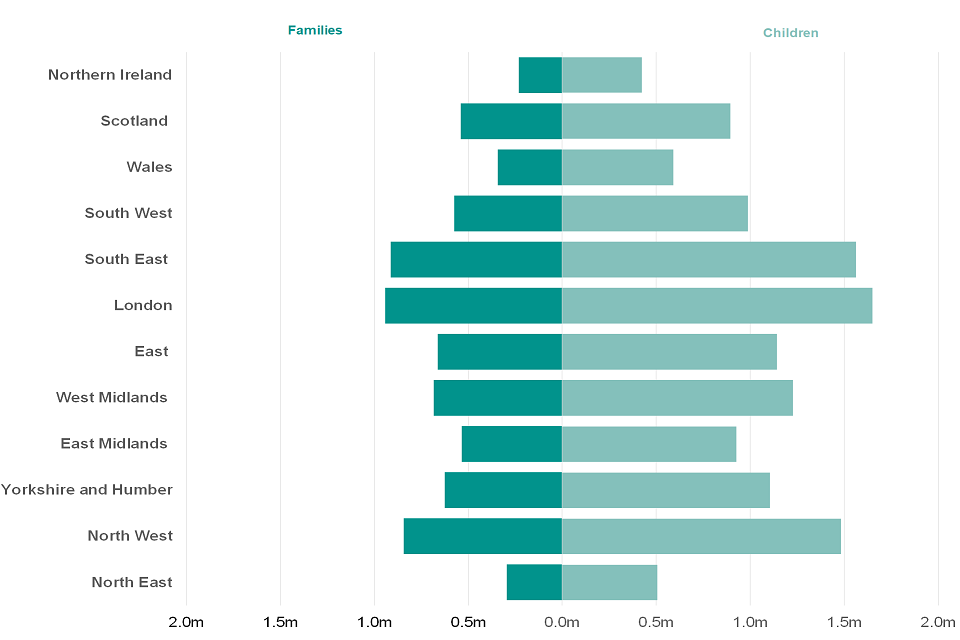
Figure 4.5: The number of families in receipt of Child Benefit and children for whom Child Benefit is being received, by country and English regions, August 2020
| Country and Region | Families | Children |
|---|---|---|
| North East | 295,275 | 504,990 |
| North West | 844,415 | 1,483,135 |
| Yorkshire and the Humber | 626,240 | 1,104,555 |
| East Midlands | 536,215 | 926,330 |
| West Midlands | 684,360 | 1,228,355 |
| East of England | 661,890 | 1,141,520 |
| London | 941,125 | 1,650,705 |
| South East | 912,285 | 1,561,785 |
| South West | 575,095 | 987,140 |
| Wales | 342,900 | 589,925 |
| Scotland | 541,285 | 893,390 |
| Northern Ireland | 230,555 | 422,145 |
Figure 4.5 (above) shows London, the South East and North West to have the highest number of families in receipt of Child Benefit and children for whom Child Benefit is received. This is in line with the population projections/estimates produced by the Office of National Statistics.
4.6 Average Number of Children for Whom Child Benefit Is Received per Family by Country and English Region
Figure 4.6: Average number of children for whom Child Benefit is received per family by country and English region, August 2020
| Region and Country | Average Number of children (2020) |
|---|---|
| North East | 1.71 |
| North West | 1.76 |
| Yorkshire and the Humber | 1.76 |
| East Midlands | 1.73 |
| West Midlands | 1.79 |
| East of England | 1.72 |
| London | 1.75 |
| South East | 1.71 |
| South West | 1.72 |
| Wales | 1.72 |
| Scotland | 1.65 |
| Northern Ireland | 1.83 |
In the UK, the average number of children for whom Child Benefit is being received per Child Benefit recipient family is 1.74. We can see that a majority of English regions and Wales fall between +/- 0.03 of this average. Northern Ireland and the West Midlands both have a higher average than the UK, 0.09 and 0.05 higher respectively, whereas Scotland’s average is 0.09 lower.
When compared to a year earlier, the average in each regions and country has remained stable with a very small movement in the West Midlands (-0.01), the East of England (-0.01) and London (-0.01). No regions/countries experienced an increase.
4.7 Number of Children for Whom Child Benefit Is Received by Individual Age
Figure 4.7: The number of children for whom Child Benefit is received by individual age, August 2020
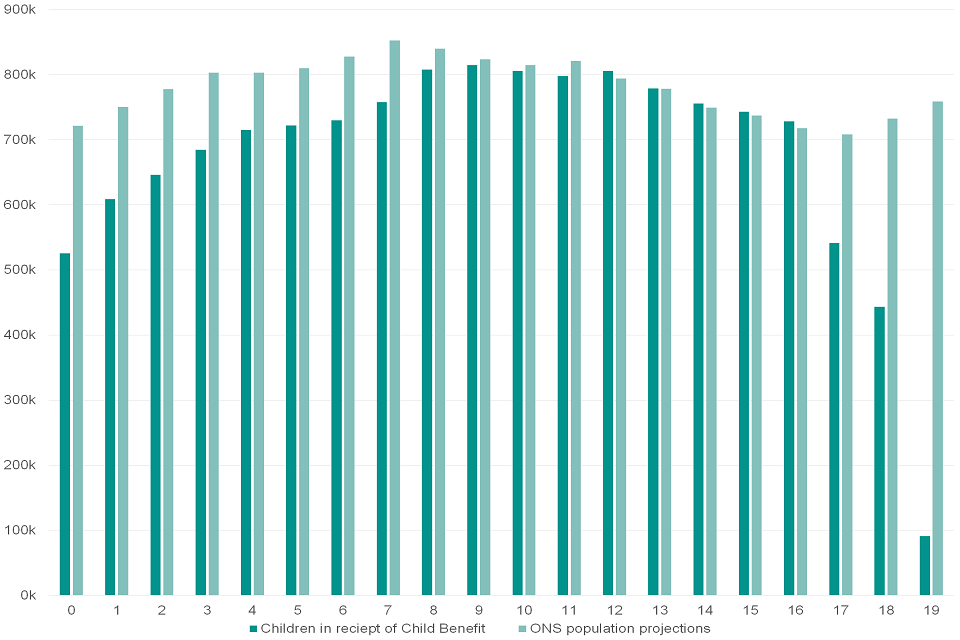
(Source data: Child Benefit Statistics, August ‘20 - Table 4 & ONS population projections for UK)
Figure 4.7 shows that the number of Children aged between 6 and 11 for whom Child Benefit is received is slightly below the ONS population projections for the same age range. The difference is partly explained by the introduction of the HICBC which resulted in some families choosing to opt-out of receiving Child Benefit (see next section). For children aged 0 to 5 the difference is even larger, and may also reflect the behaviour of some families who are affected by HICBC to not make any claim for Child Benefit when their children were born.
When compared to 2019, the largest change in children in receipt of child benefit by age was among children aged 0, falling by 9%. This fall is in line with ONS Provisional Births in England and Wales which suggests that births in the first three quarters of 2020 (January – September) have decreased by 3.6% when compared to the same period in 2019 (based on birth notification data).
The difference between Child Benefit data and ONS projections is largest for children ages 17 to 19. This is because these children are only included within Child Benefit claims if they meet the eligibility criteria for non-advanced further education or training.
4.8 Proportion and Number of Child Benefit Recipient Families by Gender of Claimant
Figure 4.8: The proportion and number of Child Benefit recipient families by gender of claimant, August 2020

In August 2020, 87% (6.25m) of Families in receipt of Child Benefit had a female as the registered claimant and 13% (0.9m) had a male registered as the claimant.
5. Families That Have Opted Out of Receiving Child Benefit Payment
In January 2013, the Government introduced the HICBC. This is a tax charge which does not affect a child’s entitlement but the Child Benefit recipient will be liable to pay some or all of their entitlement if their income (or their partner’s income) is in excess of £50,000 per year. For every £100 an individual earns in excess of £50,000 the tax charge increases by 1%. This means that if the registered Child Benefit recipient (or the recipient’s partner) earns £60,000 or more, they will be liable to repay their entire Child Benefit entitlement. Alternatively, if the registered Child Benefit recipient is affected by the HICBC (because either they or their partner earns in excess of £50,000) they can choose to “opt-out” of receiving payments and negate the need to pay the HICBC.
5.1 Number of Families and Children That Have Opted Out of Child Benefit, Broken Down by Country and Region
Figure 5.1: The number of families and children that have opted out of Child Benefit, broken down by country and region at 31st August 2020
| Country and Region | Families | Children |
|---|---|---|
| North East | 14,065 | 21,780 |
| North West | 48,605 | 75,725 |
| Yorkshire and the Humber | 34,005 | 53,200 |
| East Midlands | 34,705 | 54,310 |
| West Midlands | 38,055 | 59,600 |
| East of England | 80,885 | 126,890 |
| London | 117,830 | 179,230 |
| South East | 144,070 | 227,500 |
| South West | 43,105 | 69,475 |
| Wales | 14,360 | 22,510 |
| Scotland | 43,685 | 68,540 |
| Northern Ireland | 8,450 | 15,070 |
Figure 5.1 shows that the East of England, London and the South East have the highest number of families that have opted out of receiving Child Benefit.
5.2 Number of Children in Families That Have Opted Out of Receiving Child Benefit by Individual Age
Figure 5.2: The number of children in families that have opted out of receiving Child Benefit by individual age , August 2020
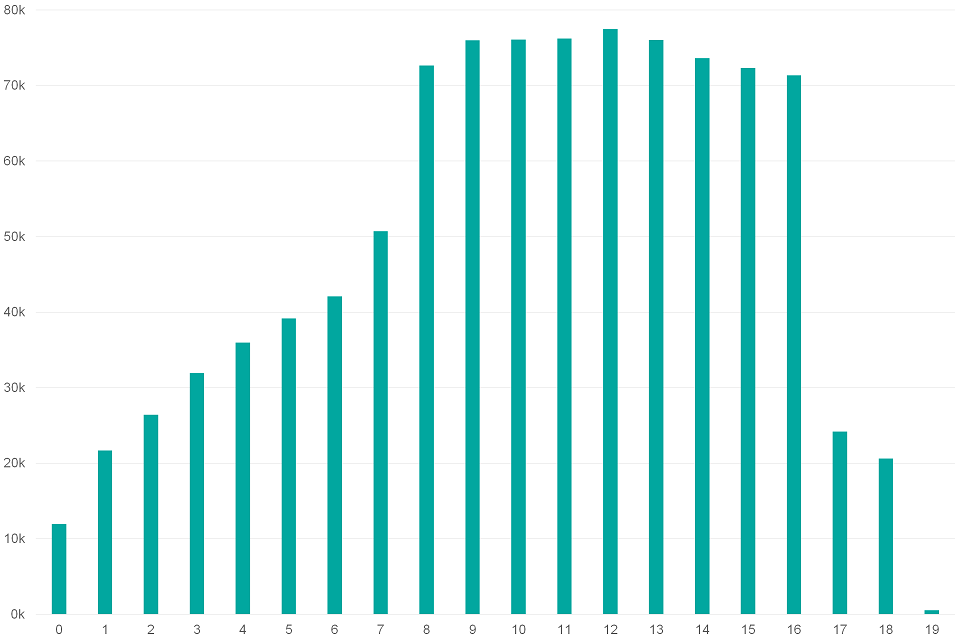
The lower number of children at ages 7 or younger is likely to be because families subject to the HICBC (either the potential recipient or recipient’s partner earns more than £50,000) will have the option of registering and then opting out of receiving payment or not register to begin with. These figures suggest that these families may have chosen not to register for Child Benefit after learning about the HICBC. For children aged above 16, there are likely to be fewer families that have opted out of receiving Child Benefit with children due to the eligibility criteria for this particular age group, which is seen also in children for whom Child Benefit is received.
5.3 Proportion and Number of Child Benefit Families That Have Opted Out of Receiving Child Benefit Payment by Gender of Registered Claimant
Figure 5.3: The proportion and number of Child Benefit families that have opted out of receiving Child Benefit payment by gender of registered claimant, August 2020
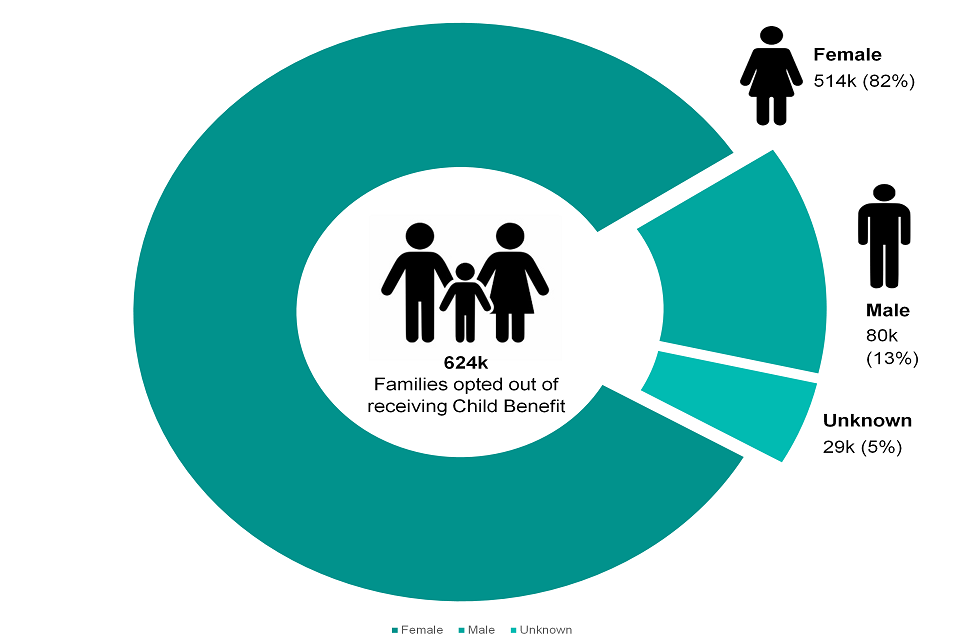
In August 2020, 82% of families that had chosen to opt-out of receiving Child Benefit were registered as having a female claimant and 13% were registered as having a male claimant. The total number of families that have opted out of receiving child benefits increased by 42,000 when compared to the previous year.
6. Technical Note
A NATIONAL STATISTICS PUBLICATION
National Statistics are produced to high professional standards set out in the Code of Practice for Official Statistics. They undergo regular quality assurance reviews to ensure that they meet customer needs. They are produced free from any political interference.
The United Kingdom Statistics Authority has designated these statistics as National Statistics, in accordance with the Statistics and Registration Service Act 2007 and signifying compliance with the Code of Practice for Official Statistics.
Designation can be broadly interpreted to mean that the statistics:
-
meet identified user needs;
-
are well explained and readily accessible;
-
are produced according to sound methods, and
-
are managed impartially and objectively in the public interest.
Once statistics have been designated as National Statistics it is a statutory requirement that the Code of Practice shall continue to be observed.
For general enquiries about National Statistics, contact the National Statistics Public Enquiry Service on:
-
telephone : 0845 601 3034
-
overseas : +44 (1633) 653 599
-
minicom : 01633 812399
-
e-mail : info@statistics.gov.uk
-
fax : 01633 652747
-
letters :
Customer Contact Centre,
Room 1.101, Government Buildings
Cardiff Road, Newport
South Wales
NP10 8XG
Media contact: HMRC Press Office 020 7147 2318
Statistical Contact: Oliver Anand benefitsandcredits.analysis@hmrc.gov.uk
KAI Benefits & Credits
HM Revenue and Customs
100 Parliament Street London
SW1A 2BQ
You can also find National Statistics on the internet at government statistics
7. What is Child Benefit?
Child Benefit is a payment that you can claim for your child. It is usually paid every four weeks but in some cases can be paid weekly. The payment can be claimed by anyone who qualifies.
As of January 2013, claimants may be liable to a tax charge called the High Income Child Benefit Charge (HICBC). Being liable for this charge does not affect a child’s entitlement but any Child Benefit recipient is liable to repay some or all of their Child Benefit back if they or their partner has an individual income of more than £50,000 per year. For every additional £100 over the £50,000 threshold that an individual earns, the tax charge due increases by 1%. This means that any recipient whose income (or partner’s income) is £60,000 or higher will be liable to repay their entire Child Benefit entitlement. Alternatively, claimants affected by the HICBC have the option to opt-out of receiving Child Benefit, thereby ceasing their payments.
Child Benefit is paid to those responsible for children (aged under 16) or qualifying young people. The latter includes those:
a. in full-time non-advanced education or (from April 2006) on certain approved vocational training courses and who are under 19, or are aged 19 and have been on the same course since their 19th birthdays. (Note: those reaching 19 up to 9 April 2006 ceased to qualify on their 19th birthdays); or
b. entered for future external examinations, or are in the period between leaving education (or exams finishing) and the week containing the first Monday in September (or similar dates after Easter and in early January, if earlier), and are not in work (there are slight variations for Scotland); or
c. aged under 18 who have moved directly from full-time education to being registered for work or training with the Careers service or with Connexions.
You can get Child Benefit even if your child doesn’t live with you. However, if they live with someone else, you can only get Child Benefit if:
a. you pay towards the upkeep of your child
b. what you pay is at least the same as the amount of Child Benefit you get for your child
c. the person bringing up your child is not getting Child Benefit for them - if you and another person both claim Child Benefit for the same child, only one of you can get it
You can also claim Child Benefit for a child even if you’re not their parent, but you have to be responsible for them to qualify.
Awards are also subject to residence criteria being satisfied. Under UK domestic law a family is eligible to receive Child Benefit if they are present and ordinarily resident in the UK. Citizens of European Economic Area countries are able to claim Child Benefit as long as they meet the requirements of the right to reside test, which amongst other requirements means that they must generally be in employment, in self-employment, be self-sufficient, or be a student.
There will be no change to the rights and status of EU citizens living in the UK before January 2021. Families can apply for settled status to continue living in the UK after June 2021.
There are two separate amounts, with a higher amount for your eldest (or only) child and a lower amount for each of your other children.
For further information about who can claim please refer to the HMRC website
8. What Does This Publication Tell Me?
This publication includes details of the number of families claiming Child Benefit as at 31st August 2020, the number and ages of children within those families and their geographical location. Population counts at Country and English Region level are shown, as well as by Local Authority and Parliamentary Constituency (Westminster and Scottish) in the United Kingdom. This publication also contains details of the number of families that had opted out of receiving Child Benefit as at August 2020, the number and ages of children within those families and their geographical location. Again population counts broken down by Country and English Region, Local Authority and Parliamentary Constituency are provided.
The statistics are as close to real-time as possible and represent the complete picture as at the 31st August, including back-dated awards pertaining to new-births. As these statistics are classified as National Statistics the exact date of publication is pre-announced at least a month in advance with the month published a year ahead in the previous publication.
This publication includes detailed analysis of the Child Benefit population as at 31st August 2020, as well as headline time series figures for each August back to 2003, this is because HM Revenue & Customs took over the responsibility for Child Benefit from April 2003.
Previously and up until April 2003, Child Benefit was administered by the Department of Social Security (now the Department for Work and Pensions).
We also publish detailed small area statistics for Great Britain, at Lower Layer Super Output Area (LSOA) for England and Wales, and Data Zone for Scotland. These statistics are based on the same source data and totals for higher level geographies will match up. The statistics are available with the National Statistics release of these statistics. Currently the small area data is not labelled as National Statistics and appears on the HMRC website and on the Neighbourhood Statistics website.
Further geographical statistics, down to Lower Layer Super Output Area (LSOA) in England and Wales, Data Zones in Scotland and Output Areas in Northern Ireland are available from the following sites:
-
Office for National Statistics: Neighbourhood Statistics
-
Scottish Government: Scottish Neighbourhood Statistics
-
Northern Ireland Statistics and Research Agency (NISRA): Northern Ireland Neighbourhood Information Service
9. Who Might Be Interested?
The statistics contained in this publication will be of interest for anyone that is looking for the latest possible data on Child Benefit. Specifically, there are statistics on the number of children, by age band, in each geographical area. These statistics may be of interest to academics, think tanks as well as Local Government and might be used for comparison to comparable Tax Credits statistics.
Although the number of families that have opted out and the children within those families are included within this publication, we are unable to provide figures on those that have chosen not to claim Child Benefit due to the introduction of the HICBC. This means that the Child Benefit population (up to 16) may not continue to be as useful a proxy for the child population as a whole in future years.
10. User Engagement
Bespoke analysis of Child Benefit data is possible although there may be a charge depending on the level of complexity and the resources required to produce. If you would like to discuss your requirements, to comment on the current publications, or for further information about the Child Benefit statistics please use the contact information found at the beginning of this publication.
We are committed to improving the official statistics we publish. We want to encourage and promote user engagement, so we can improve our statistical outputs. We would welcome any views you have using the contact information at the beginning of this publication.
11. National Statistics Review
We carried out a formal review of our National Statistics publications, covering both Tax Credits (provisional and finalised) and Child Benefit in 2011.
The Child Benefit Statistics User Consultation ran from 11 July to 30 September 2011 and covered Child Benefit National Statistics and Official Statistics using an on-line survey.
Following feedback from the consultation, we introduced a new category from the 2012 publication (for August 2011 data) to show the number of families in receipt of CB for four children and five or more children.
12. Disclosure Control
To avoid the possible disclosure of information about individual families, values have been supressed when underlying counts are low and are represented with an entry of “-’’ where they have been withheld in line with HMRC’s Dominance and Disclosure policy.
13. Rounding
The figures have been independently rounded to the nearest 5. This can lead to components as shown not summing to totals as shown.
14. Age Bands of Data on Children
For most tables in this publication, figures showing the age of children for whom Child Benefit is claimed have been grouped into four age bands. Figures at a local authority level showing the number of children by single year of age are available in Table 7, with Table 9 tabulating this for opt-outs.
15. Revisions and other changes to the statistics
A minor error has been corrected from last year’s publication (August 2019) regarding column headings for Table 2 in the Main Tables document. The column heading ‘Five or more children’ has now have been divided into two new columns, ‘Five to Nine Children’ and ‘Ten or more children’ for data from August 2019 to provide more detailed breakdowns.
16. Technical Annex – Child Benefit Take-up Rate
The Child Benefit take-up rate is defined as follows: