National Disease Registration Service: Case-mix adjusted percentage of cancers diagnosed at stages 1 and 2 in England, by Clinical Commissioning Group
Published 29 May 2020

© Crown copyright 2020
This publication is licensed under the terms of the Open Government Licence v3.0 except where otherwise stated. To view this licence, visit nationalarchives.gov.uk/doc/open-government-licence/version/3 or write to the Information Policy Team, The National Archives, Kew, London TW9 4DU, or email: psi@nationalarchives.gov.uk.
Where we have identified any third party copyright information you will need to obtain permission from the copyright holders concerned.
This publication is available at https://www.gov.uk/government/statistics/case-mix-adjusted-percentage-cancers-diagnosed-at-stages-1-and-2-by-ccg-in-england/national-disease-registration-service-case-mix-adjusted-percentage-of-cancers-diagnosed-at-stages-1-and-2-in-england-by-clinical-commissioning-group
1. Main findings
The latest unadjusted and case-mix adjusted ‘percentage of cancers diagnosed at stages 1 and 2’ indicator, at national level and by Clinical Commissioning Group (CCG), shows that:
-
in England, there were 242,346 cancers diagnosed with a recorded stage (1 to 4) in 2018. Of these, 55% were diagnosed at stages 1 and 2. The unadjusted range by CCG was 48% to 64%
-
this is comparable to the previous year (2017) when the unadjusted percentage was 54%, ranging from 47% to 60%
-
the most recent 3-year case-mix adjusted percentage figures (2016 to 2018) show that 55% of cancers were diagnosed at stages 1 and 2 – the case-mix adjusted range by CCG was 50% to 58%
-
by using a 3-year rolling average, more reliable estimates of the case-mix adjusted percentage of cancers diagnosed at stages 1 and 2 can be obtained – the median reliability (defined below) on a scale of 0 to 1 of the CCG estimates was 0.74, ranging from 0.31 to 0.95, which reflects that there was less chance variation than when a single year of data was used: for 2018 alone the median was 0.58 and the range was 0.17 to 0.90.
-
the percentage of cancers diagnosed at stages 1 and 2 varied by cancer site – in 2018, this ranged from 13.5% (oropharynx, base of tongue, tonsil, soft palate and uvula) to 92.0% (testis)
2. Summary
The accompanying output presents the unadjusted and case-mix adjusted ‘percentage of all cancers diagnosed at stages 1 and 2’ indicator nationally, and at CCG level. The output provides 1- and 3-year estimates (for example, for 2018 and 2016 to 2018 combined). The most recently available results are for diagnoses of cancer in 2018, with data available from 2013. Cancer site-specific breakdowns are also given in an interactive output that provides the counts of cancer by cancer site and stage at diagnosis. These are summarised in Table 1.
In England, there were 242,346 cancers diagnosed with a recorded stage (1 to 4) in 2018. Of these, 55.0% were diagnosed at stages 1 and 2. This 2018 percentage was comparable to that of 2017, when the unadjusted percentage of cancers diagnosed at stages 1 and 2 was 54.5%, given that the range over the period of 2013 to 2018 is 54.5% to 55.1%.
The variation of the case-mix adjusted ‘percentage of cancers diagnosed at stages 1 and 2’ indicator for the most recent 3-year (2016 to 2018) is presented in Figure 1. The overall case-mix adjusted percentage of cancers diagnosed at stages 1 and 2 was 54.8%. The range of case-mix adjusted percentage of cancers diagnosed at stages 1 and 2 across the 191 CCGs was 50.0% to 58.2%; which is smaller than the unadjusted range. This shows that a part of the variation between CCGs is due to the population characteristics.
Case-mix adjustment is a process that statistically controls, or accounts, for these characteristics and risk factors. This allows for fairer comparisons of outcomes between CCGs that have populations with different characteristics negatively or positively associated with the performance indicator. Comparisons between geographies using unadjusted values of the indicator have been shown to be misleading due to differences in the underlying population characteristics and distribution of risk factors.
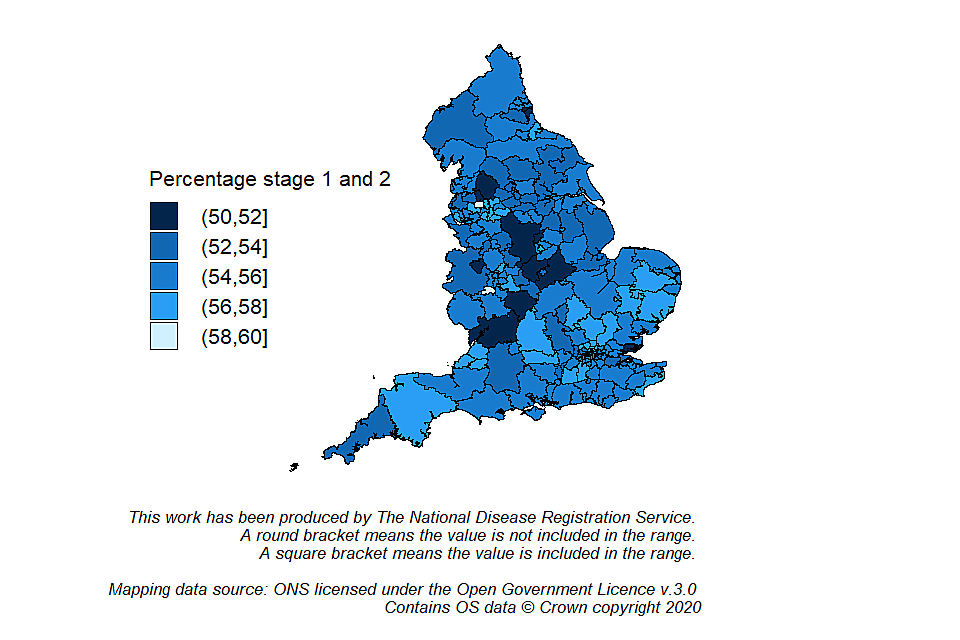
Map of England showing the variation in case-mix adjusted percentage of cancers diagnosed at stages 1 and 2 by Clinical Commissioning Group (2016 to 2018)
An example of the time trends using 3-year data for the case-mix adjusted ‘percentage of cancers diagnosed at stages 1 and 2’ indicator are provided in Figure 2. Each CCG within a Cancer alliance is a grey line, and the blue line represents the estimates for England. For the 3-year period substantial inter-period variation at CCG level can be observed. If individual years are used to assess a time trend, the interpretation should be focused on overall trends, rather than estimates for an individual year. This is because the number of cases diagnosed each year in each CCG is relatively small and the estimates are therefore less stable. The percentage for the CCGs in this alliance can be observed to be grouped above the overall figure for England.
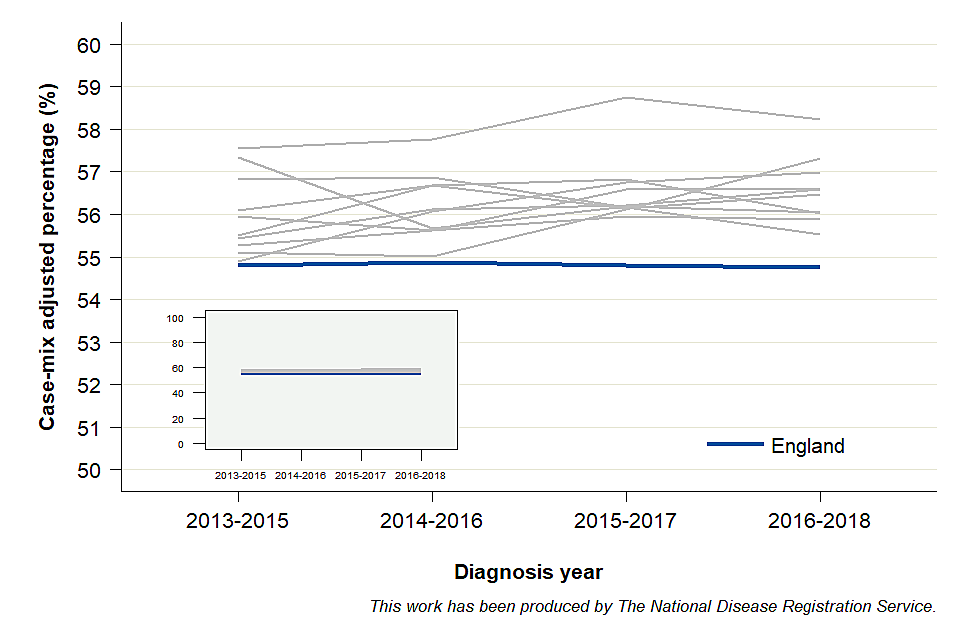
Graph showing the time trend of case-mix adjusted percentage of cancers diagnosed at stages 1 and 2 for an example set of Clinical Commissioning Groups within a Cancer Alliance, and England
Table 1 lists the percentage of cancers diagnosed at stages 1 and 2 by cancer site in 2018. Of the cancer sites listed, the percentage of cases diagnosed at stages 1 and 2 ranged from 13.5% (oropharynx, base of tongue, tonsil, soft palate and uvula) to 92.0% (testis). The percentage of cancers diagnosed at stages 1 and 2 may vary by cancer site for several reasons. These reasons include: patient awareness of symptoms and the ease of diagnosing the symptoms (cancers with non-specific symptoms can be harder to diagnose), and how fast the cancer spreads and develops.
Table 1. Percentage of cancers diagnosed at stages 1 and 2 by cancer site (2018)
| Cancer site | Total number of stageable cancers diagnosed | Number of cancers diagnosed at stages 1 and 2 | Percentage (%) |
|---|---|---|---|
| Testis | 1,869 | 1,720 | 92.0 |
| Melanoma of skin | 13,786 | 12,297 | 89.2 |
| Thyroid | 2,669 | 2,374 | 88.9 |
| Breast | 43,658 | 37,456 | 85.8 |
| Uterus | 7,507 | 6,066 | 80.8 |
| Cervix | 2,075 | 1,667 | 80.3 |
| Bladder | 7,384 | 5,594 | 75.8 |
| Kidney, except renal pelvis | 8,004 | 4,556 | 56.9 |
| Prostate | 44,759 | 24,428 | 54.6 |
| Larynx including anterior surface of epiglottis | 1,565 | 796 | 50.9 |
| Oral cavity, hard palate and lip (inner aspect) | 2,529 | 1,175 | 46.5 |
| Hodgkin lymphoma | 1,605 | 725 | 45.2 |
| Colon | 21,401 | 9,638 | 45.0 |
| Rectum and rectosigmoid junction | 10,678 | 4,592 | 43.0 |
| Ovary, fallopian tube and primary peritoneal carcinomas | 5,574 | 2,229 | 40.0 |
| Non-Hodgkin lymphoma | 9,980 | 2,992 | 30.0 |
| Lung | 36,552 | 10,562 | 28.9 |
| Stomach excluding cardia and gastroesophageal junction | 2,707 | 742 | 27.4 |
| Pancreas | 7,199 | 1,625 | 22.6 |
| Oesophagus including cardia and gastroesophageal junction | 7,571 | 1,627 | 21.5 |
| Oropharynx, base of tongue, tonsil, soft palate and uvula | 3,274 | 443 | 13.5 |
3. Things you need to know
These statistics are designated as Experimental Statistics. Experimental Statistics are those which are in the testing phase, are not yet fully developed and have not been submitted for assessment as National Statistics to the UK Statistics Authority. Experimental Statistics are published in order to involve customers and stakeholders in their development and as a means of building in quality at an early phase. Further information on Experimental Statistics can be found on the Office for National Statistics (ONS) website.
The definition of cancer sites included within this publication has been updated from previous definitions. For this reason, we are publishing a back-series for diagnoses from 2013 onwards. As a result, the unadjusted percentages presented in the workbook are not directly comparable to previous publications related to the ‘percentage of cancers diagnosed at stages 1 and 2’.
3.1 Stage
The main point for consideration is that improvement in recording of stage continues to be part of the work programme for the National Disease Registration Service.
Stage is a measure of how much a cancer has grown and spread, with more advanced stages meaning the cancer is bigger or has spread to other parts of the body (lymphatic spread or metastasis). There are usually fewer treatment options at a later stage. National public health interventions, such as screening programmes and information and educational campaigns (for example, Be Clear on Cancer), aim to increase the proportion of early diagnoses.
A cancer is considered stageable if a staging system exists for where the cancer originates in the body (the site) and the type of cells in the cancer. For example, a staging system doesn’t exist for the types of cancer found in the heart.
The staging system used here is TNM. The TNM system puts cancers in a group from 1 to 4 depending on the cancer, or tumour, size (T); which, if any, lymph nodes have cancer cells (N); and if the cancer has spread (metastasised) to other parts of the body (M). Different versions of TNM are used (versions 5 (for colorectal), 7 and 8), in line with international guidance. For some cancers, a site-specific staging system is used instead of TNM: gynaecological (ovary and uterus) cancers which use FIGO (International Federation of Gynecology and Obstetrics) staging; lymphomas (non-Hodgkin lymphomas) which use Ann Arbor staging; myelomas which use ISS (International Staging System); Binet staging for chronic lymphocytic leukaemia. For these cancer sites, TNM stage has been used where the site-specific stage was unknown. Cervical cancer is the exception, whereby a cancer is only considered staged if a FIGO staging value is available. These site-specific staging systems can be mapped to TNM as follows:
-
Stage 1 = TNM stage 1, FIGO stage 1, Ann Arbor stage 1, ISS for myeloma stage 1, Binet stage A
-
Stage 2 = TNM stage 2, FIGO stage 2, Ann Arbor stage 2, ISS for myeloma stage 2, Binet stage B
-
Stage 3 = TNM stage 3, FIGO stage 3, Ann Arbor stage 3, ISS for myeloma stage 3, Binet stage C
-
Stage 4 = TNM stage 4, FIGO stage 4, Ann Arbor stage 4, ISS for myeloma stage 4
TNM was updated to version 8 and introduced for all cancers registered since January 2018 (except head and neck where it was introduced for 2019 registrations onwards). Details of the updates are available here. This has an impact on the time series of certain cancer sites, in that a noticeable change in the unadjusted percentage can be seen from 2017 to 2018. The greatest change in the unadjusted percentage between 2017 and 2018 was seen for thyroid cancer, with a sharp increase.
During development of the case-mix adjustment methodology, a sensitivity analysis was performed to assess the impact of the introduction of the new TNM version on the case-mix adjusted estimates for the 3-year rolling case-mix adjusted average. The sensitivity analysis removed thyroid as a cancer site and compared the estimates. Thyroid was chosen because it was the cancer site with the greatest increase in the unadjusted percentage of cancers diagnosed at stages 1 and 2 from 2017 to 2018, the time when TNM version 8 was introduced. For England, the results were as follows:
-
2013 to 2015: 54.7% without thyroid, 54.8% with thyroid
-
2014 to 2016: 54.8% without thyroid, 54.9% with thyroid
-
2015 to 2017: 54.7% without thyroid, 54.8% with thyroid
The standard deviation for the differences between the 2 values for each CCG was 0.1% for all 3 time periods. Therefore, it was concluded that no methodological changes were required to account for the TNM version update. As stated in the Technical Documentation, this will be reviewed in 2023, when the inclusion of TNM version as a case-mix variable will be considered.
3.2 Methodology
Important points for consideration:
-
the case-mix adjusted ‘percentage of cancers diagnosed at stages 1 and 2’ indicator adjusts for the following patient-level characteristics: age, sex, cancer site and deprivation
-
the case-mix adjusted values of the ‘percentage of cancers diagnosed at stages 1 and 2’ are applied to the characteristics of the baseline population – this is to enable comparisons of changes to the indicator which are unrelated to changes to the underlying patient characteristics over time
-
smaller populations when analysing at a CCG level creates wider confidence intervals, with the reliability measure accompanying the output provides an indication of the robustness of the value – reliability above 0.7 is considered sufficient, with 0.9 considered the threshold for pay-for-performance measures
The cancer sites identified for this indicator are stageable sites that meet 2 criteria: at least 1,500 cancers diagnosed annually in England and a staging completeness of at least 70%. Therefore, some cancer sites are excluded from the indicator due to higher levels of missing stage at diagnosis. They were excluded on the basis that their inclusion would compromise the statistical robustness of the measure.
The ‘percentage of cancers diagnosed at stages 1 and 2’ indicator was developed to inform policy and to monitor the quality and effectiveness of interventions aiming to increase diagnosis at an earlier stage. It also provides contextual information for the ONS cancer survival rates, which are also published by stage.
Case-mix adjustment for the ‘percentage of cancers diagnosed at stages 1 and 2’ indicator will have an impact on the overall CCG measure of diagnosis at stage 1 and 2 if:
-
cancers less likely to be diagnosed at stages 1 and 2 occur more frequently in the CCG than the national average, which will make the CCG’s measure look worse than it is
-
cancers more likely to be diagnosed at stages 1 and 2 occur more frequently in the CCG than the national average, which will make the CCG’s measure look better than it is
For example, breast cancer is more frequently diagnosed at stages 1 and 2 than lung cancer. Therefore, without case-mix adjustment, CCGs with a higher than average occurrence of breast cancer will tend to perform better on the ‘percentage of cancers diagnosed at stages 1 and 2’ indicator, compared to CCGs with a higher than average occurrence of lung cancer.
Reliability gives an indication of how robust the performance measure is. The possible range lies between 0 and 1, with values closer to 1 indicating higher reliability. Low reliability indicates that chance due to small numbers is having an unduly high influence on the performance measure. Lower reliability is likely to reflect smaller sample sizes, due to smaller populations within a CCG or use of annual rather than 3-year summary statistics.
4. Policy context and use
The policy area which is most likely to be influenced by these results is early diagnosis. Users of the ‘percentage of cancers diagnosed at stages 1 and 2’ indicator include government organisations, the NHS, local bodies responsible for commissioning cancer services, health policymakers, cancer charities, academics and researchers, cancer registries, the public and the media.
The data can also be used to monitor progress against national cancer plans such as the 6 strategic priorities set out by the Independent Cancer task Force. These include reducing CCG variation and the ambition to increase 12-month cancer survival to 75% by 2020 for all cancers combined. The indicator can be used to monitor whether the cancer ambition of the NHS Long Term Plan for cancer to diagnose 3-quarters of cancers at stage 1 and 2 is being achieved. Further, the unadjusted data can inform the NHS Outcomes Indicator Set, which was established to monitor overall changes in performance of the NHS and the quality of health outcomes, which include cancers detected at stage 1 or 2 and a record of lung cancer stage at decision to treat, and the Public Health Outcomes Framework.
5. Further information
A document detailing the data sources and methodology used to create the case-mix adjusted ‘percentage of cancers diagnosed at stages 1 and 2’ indicator is available to download here.
An online visualisation tool accompanies this release and can be used to explore the data.
6. Other information also available
The National Cancer Transformation programme strategy and progress report for achieving world-class cancer outcomes.
Cancer survival by stage at diagnosis for England.
Independent Cancer Taskforce Strategy set out 6 strategic priorities including reducing CCG variation and the ambition to increase 12-month survival to 75% by 2020 for all cancers combined.
Public Health Outcomes Framework (PHOF) currently publishes the cancers diagnosed at stages 1 and 2 at a variety of geographies (including local authority and National Statistics regions). The definition currently comprises new cases of cancer diagnosed at stages 1 and 2 as a percentage of all new cases of cancer diagnosed (specific cancer sites, morphologies and behaviour: invasive malignancies of breast, prostate, colorectal, lung, bladder, kidney, ovary, uterus, non-Hodgkin lymphomas and invasive melanomas of skin). By May 2020, the definition will be aligned to the complete case approach presented in the current document.
NHS Outcome Indicator Set publishes the percentage of all cases of cancer for which a valid stage is recorded by CCG, cancers detected at stage 1 or 2 (as defined as above), and record of lung cancer stage at decision to treat. By August 2020, the definition will be aligned to the complete case approach presented in the current document.
United Kingdom and Ireland Association of Cancer Registries (UKIACR) publishes data related to performance indicators, including stage complete by cancer site groups, for each of the cancer registries.
7. Feedback
Comments on this briefing are welcomed. In particular, comments on the following items are sought:
-
additional case-mix variables to consider in future publications: the current variables are age at diagnosis, sex, cancer site and deprivation
-
use of site-specific definitions to indicate earlier stage at diagnosis: for example, should ‘early stage’ be considered stages 1, 2 and 3 for breast cancer? This is discussed in further detail in the Technical Documentation for this indicator, however additional views are sought.
Feedback can be sent to: ncrasenquiries@phe.gov.uk. This email address can be used for general enquiries to NCRAS. Please do not include sensitive or patient identifiable information.
8. Authors
Responsible statistician: Katherine Henson
Production team: Katherine Henson; Sean McPhail; Harriet Fisher; Charlotte Eversfield; Bhavisha Hirani; Chloe Bright; John Broggio; Carolynn Gildea; Marta Emmett.
Methodology development group: Dr Gary Abel; Dr Matthew Barclay; Professor Yoryos Lyratzopoulos; Dr Brian Rous; Rafael Goriwoda; Lucy Ironmonger; Dr Harriet Fisher; Dr Katherine Henson; Dr Sean McPhail.
9. Acknowledgements
This work uses data that has been provided by patients and collected by the NHS as part of their care and support. The data is collated, maintained and quality assured by the National Cancer Registration and Analysis Service, which is part of Public Health England (PHE).