Benefit sanctions statistics to October 2020 (experimental)
Updated 10 June 2021
Applies to England, Scotland and Wales

© Crown copyright 2021
This publication is licensed under the terms of the Open Government Licence v3.0 except where otherwise stated. To view this licence, visit nationalarchives.gov.uk/doc/open-government-licence/version/3 or write to the Information Policy Team, The National Archives, Kew, London TW9 4DU, or email: psi@nationalarchives.gov.uk.
Where we have identified any third party copyright information you will need to obtain permission from the copyright holders concerned.
This publication is available at https://www.gov.uk/government/statistics/benefit-sanctions-statistics-to-october-2020-experimental/benefit-sanctions-statistics-to-october-2020-experimental
The latest release of these statistics can be found in the benefit sanctions statistics collection.
This release of statistics on Benefit Sanctions includes data up to October 2020.
Statistics covered in this bulletin include data for sanction decisions during the coronavirus (COVID-19) pandemic. Although legislative changes to disapply work-search and work availability requirements were effective between 30 March 2020 and 30 June 2020 (in response to the pandemic), some sanction decisions for these types of failures could have been made during this time period because decisions are often made and processed after the date that the claimant failure occurred. This means that it was possible for sanction decisions to be recorded after legislation changes came into effect, in instances where a claimant prior to 30 March 2020 has failed to meet the work requirements set out in their claimant commitment. Additionally, sanction decisions were also possible for some failures which occurred after this date, for example, for leaving a job voluntarily without good reason or for misconduct.
Conditionality has been generally reintroduced from the 30 June, and new and revised claimant commitments for UC claimants are being reintroduced from 1 July 2020 on a phased approach and as capacity allows (3 August for New Style and Legacy JSA new claims). Claimants can only receive sanctions for failure to meet commitments once they have a new or updated tailored claimant commitment in place.
This impacts data for Universal Credit (UC) and Jobseeker’s Allowance (JSA) sanctions.
The next release will be in May 2021.
We are seeking user feedback on this HTML version of the statistical bulletin which replaces the PDF version. Send comments to: stats-consultation@dwp.gov.uk.
There should be no comparisons made across benefits.
The data sources used to produce these statistics are very different and while we have attempted to use consistent methodology, there are differences in methodological approaches between benefits. Additionally, the benefits themselves are very different and require interpretation based on the rules of the specific benefit.
1. Main stories
On JSA, if a claimant fails to attend a Work-Focused Interview, their claim can be closed. However, because UC replaces a number of benefits, claims are not closed if a claimant fails to attend a Work-Focused Interview. In the period from November 2019 to October 2020, 91% of UC full service adverse decisions occurred due to failure to attend or participate in a Work-Focused Interview.
The statistics show:
- prior to legislation changes made on 30 March 2020, 1.91% of UC full service claimants subject to conditionality at the point where the sanction was applied had a deduction taken from their UC full service award as a result of a sanction. In November 2020, this proportion was 0.13%. This is:
- down 0.06 percentage points from August 2020
- down 2.02 percentage points in the latest 12 months
- over the course of the roll-out of UC (live and full service), the balance of individuals in conditionality groups subject to sanction as a proportion of the caseload has changed.
- in November 2020, 61% of UC claimants were in the conditionality groups that could be subject to sanction. This proportion:
- has decreased from 81% in August 2015 to 59% in March 2020, and has since been fluctuating between 61% and 67%
- increased temporarily to 67% in May 2020, coinciding with an increase to the UC caseload during the coronavirus (COVID-19) pandemic
For further information regarding how this is calculated, see the ‘’Sanction Rates’’ section of the background information and methodology document.
Experimental rate of UC full service claimants receiving less benefit due to a sanction
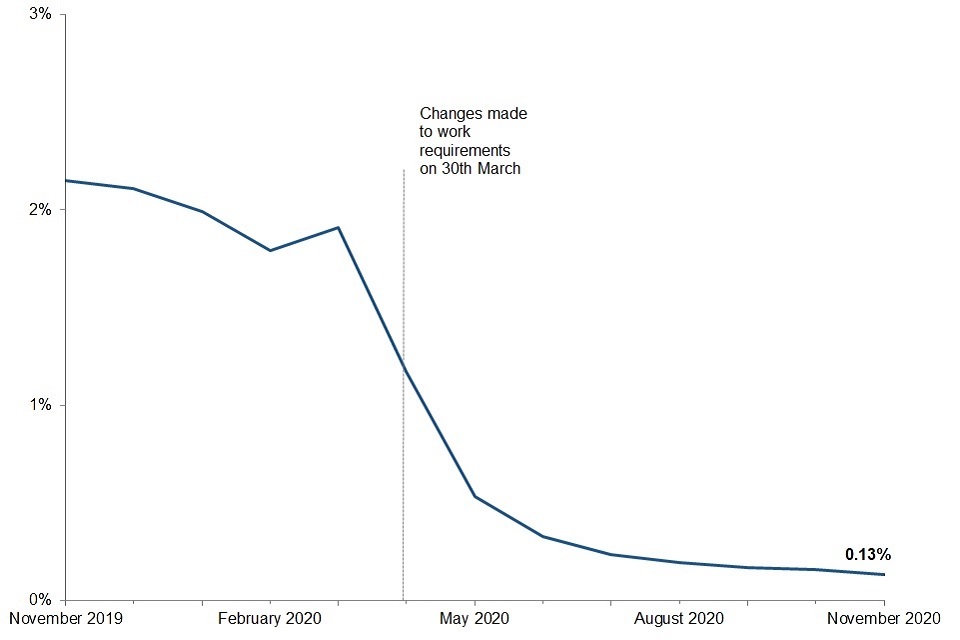
Source: Sanction Decisions Stat-Xplore tables.
The data shows:
- numbers of claimants on JSA and Employment and Support Allowance (ESA) Work Related Activity Group (WRAG) have steadily reduced due to migration to UC (live and full service), and therefore the number of sanctions is now very low for JSA and ESA (WRAG)
- the percentage of JSA claimants with a drop in payment due to a sanction in June 2020 was less than 0.01%. This is:
- down 0.02 percentage points from March 2020
- down 0.05 percentage points in the latest 12 months
- the percentage of ESA (WRAG) claimants with a drop in payment due to a sanction in June 2020 was 0.01%. This is:
- down 0.01 percentage points from March 2020
- down 0.07 percentage points in the latest 12 months
2. What you need to know
If you do not meet one or more conditions of your benefit claim without good reason, your benefit could be stopped or reduced. This is a benefit sanction. However, not everyone that is initially referred for failing to meet the conditions of their claim will receive a sanction. Where a claimant’s benefit is reduced, the claimant may be eligible for a hardship payment.
Further information about the sanctions process and source of these statistics can be found in the background information and guidance documents. Figures in this bulletin are rounded in accordance with the DWP rounding policy for statistics, details of which can be found in the “Rounding” section of the background information and methodology document. Unrounded figures from the underlying data available on Stat Xplore or in accompanying tables may not sum exactly to the rounded totals accordingly.
Statistics covered in this bulletin include data for sanction decisions during the coronavirus (COVID-19) pandemic. Although legislative changes to disapply work-search and work availability requirements were effective between 30 March 2020 and 30 June 2020 (in response to the pandemic), some sanction decisions for these types of failures could have been made during this time period because decisions are often made and processed after the date that the claimant failure occurred. This means that it was possible for sanction decisions to be recorded after legislation changes came into effect, in instances where a claimant prior to 30 March 2020 has failed to meet the work requirements set out in their claimant commitment. Additionally, sanction decisions were also possible for some failures which occurred after this date, for example, for leaving a job voluntarily without good reason or for misconduct.
Conditionality has been generally reintroduced from the 30 June, and new and revised claimant commitments for UC claimants are being reintroduced from 1 July 2020 on a phased approach and as capacity allows (3 August for New Style and Legacy JSA new claims). Claimants can only receive sanctions for failure to meet commitments once they have a new or updated tailored claimant commitment in place.
This impacts data for Universal Credit (UC) and Jobseeker’s Allowance (JSA) sanctions.
Users can also:
- produce their own tables and access demographic breakdowns using Stat-Xplore
- access supporting tables
The data in this publication is the latest available for each of the following sets of statistics.
UC sanction statistics
The UC live service statistics in this release date from August 2015, whilst the UC full service statistics in this release date from May 2016 except for the statistics for UC full service rate statistics in this release which date from April 2019.
JSA sanction statistics
The JSA statistics in this release date from the regime change on 22 October 2012 when new rules were brought in.
Data from before the regime change (April 2000 to 21 October 2012) is available on Stat-Xplore and in the supporting tables.
Further information on the regime change can be found in the background information and methodology document.
ESA sanction statistics
The ESA statistics in this release date from the regime change on 3 December 2012 when new rules were brought in.
Data from before the regime change (October 2008 to 2 December 2012) is available on Stat-Xplore and in the supporting tables.
Further information on the regime change can be found in the background information and methodology document.
Income Support (IS) sanction statistics
These are not included in this publication, but are available on Stat-Xplore.
Migration of Claimants to UC Full Service
The move of legacy claimants onto full service will continue until migration is completed. As of April 2019, 100% of UC live service claimants have transferred onto full service and we are now including statistics relating to UC full service decisions in this publication.
Definitions
Sanction decisions
A claimant is referred to a sanction Decision Maker when they do not meet a condition of their benefit. The Decision Maker looks at the available information about the claimant and their referral and decides on an outcome. The decision made can be:
- Adverse – they decide to sanction the claimant
- Non-Adverse – they decide not to sanction the claimant
- Cancelled – they decide that the referral was not appropriate and cancel it
- Reserved – a decision to sanction the claimant cannot be made, since the claimant is not currently on benefit, so the sanction cannot be applied. The claimant will be re-referred to a Decision Maker if they begin to claim benefit again
Within this publication, we refer to all of these outcomes as decisions. Many sanction decisions can be made during the course of a claim where the claimant has failed to meet the conditions of their benefit claim more than once.
Sanction stages
Each JSA, ESA (WRAG) or IS sanction decision can have a maximum of four stages, beginning with the Original Decision made by a Decision Maker. If the claimant does not agree that their benefit should be reduced, they may request a Decision Review, Mandatory Reconsideration, and Appeal. UC has a maximum of three stages as there is no Decision Review.
In the statistics, only the latest decision is kept, meaning that any previous decisions for each sanction referral are updated with every publication.
Sanction durations
We count the length of time that a claimant is receiving less benefit because they were being sanctioned and calculate the median. The median is the middle number when all of the sanction lengths have been arranged from smallest to largest. Durations are counted up to and including the last month in which a deduction is taken. If someone has multiple sanctions which are served without a break in deductions, this will be counted as one sanction in the statistics. The underlying figures can be found in the supporting tables.
Sanction rates
We calculate the number of people who are receiving less benefit because they were sanctioned as a proportion of the total number of people in receipt of each benefit at a point in time (i.e. on a specific day of the month). These figures are calculated differently to the decisions figures, which are based on the number of decisions made in a full month. The underlying figures can be found in the supporting tables.
Destinations
We track what happens to claimants after they receive an original, adverse sanction decision. The figures show the amount of time spent on different working age benefits (UC, JSA, ESA (WRAG) and IS) in the 180-day period following the decision. In addition, we have developed statistics to show who has had a period of earnings after their sanction. Further information can be found in the destinations methodology document.
UC full service
At present, we only hold data on original, adverse sanction decisions for claimants on UC full service and cannot differentiate between non-adverse, reserved and cancelled outcomes. Prior to May 2016, UC full service was being implemented as a trial in a small area of the UK only (Sutton, Southwark, Croydon, Hounslow and Musselburgh) so data on original, adverse decisions is included from May 2016 onwards.
UC live service
New claims to UC live service ceased in January 2018, and since then the remaining live service cases have been gradually migrated to UC full service. This has resulted in a gradual decrease in the number of live service sanction decisions. By 1 April 2019, the systems that were used to administer live service cases were shut down. Due to this, data for any original UC live service sanction decisions has been frozen from this point.
3. Universal Credit Full Service
There should be no comparisons made across benefits.
The data sources used to produce these statistics are very different and while we have attempted to use consistent methodology, there are differences in methodological approaches between benefits. Additionally, the benefits themselves are very different and require interpretation based on the rules of the specific benefit.
Statistics covered in this bulletin include data for sanction decisions during the coronavirus (COVID-19) pandemic. Although legislative changes to disapply work-search and work availability requirements were effective between 30 March 2020 and 30 June 2020 (in response to the pandemic), some sanction decisions for these types of failures could have been made during this time period because decisions are often made and processed after the date that the claimant failure occurred. This means that it was possible for sanction decisions to be recorded after legislation changes came into effect, in instances where a claimant prior to 30 March 2020 has failed to meet the work requirements set out in their claimant commitment. Additionally, sanction decisions were also possible for some failures which occurred after this date, for example, for leaving a job voluntarily without good reason or for misconduct.
Conditionality has been generally reintroduced from the 30 June, and new and revised claimant commitments for UC claimants are being reintroduced from 1 July 2020 on a phased approach and as capacity allows (3 August for New Style and Legacy JSA new claims). Claimants can only receive sanctions for failure to meet commitments once they have a new or updated tailored claimant commitment in place.
This impacts data for Universal Credit (UC) and Jobseeker’s Allowance (JSA) sanctions.
These figures are for full service claimants only and do not include live service data; full service data and live service data come from different sources, which is why they have been reported separately for decisions. Note that rates are calculated in a manner that is not affected. For further information, see the UC background information and methodology document.
The migration to UC full service will continue until legacy benefits have ceased. As of April 2019, 100% of UC live service claimants have transferred onto full service and we are now including statistics relating to UC full service decisions in this publication.
Data for numbers of original adverse decisions has been included from May 2016, for UC full service. This is because prior to this time, UC full service was being implemented as a trial in a small area of the UK only (Sutton, Southwark, Croydon, Hounslow and Musselburgh). More information about this is available in our UC background information and methodology document.
It should be noted that references to full service adverse decisions describe original, adverse decisions only. We are currently unable to provide statistics on original non-adverse, reserved or cancelled decisions, as this information is not captured on the front end system. We are looking at ways of improving the way we collect sanctions information in UC full service.
3.1 UC full service: Sanction decisions and reasons – Experimental Statistics
UC full service adverse sanction decisions by month, May 2016 to October 2020
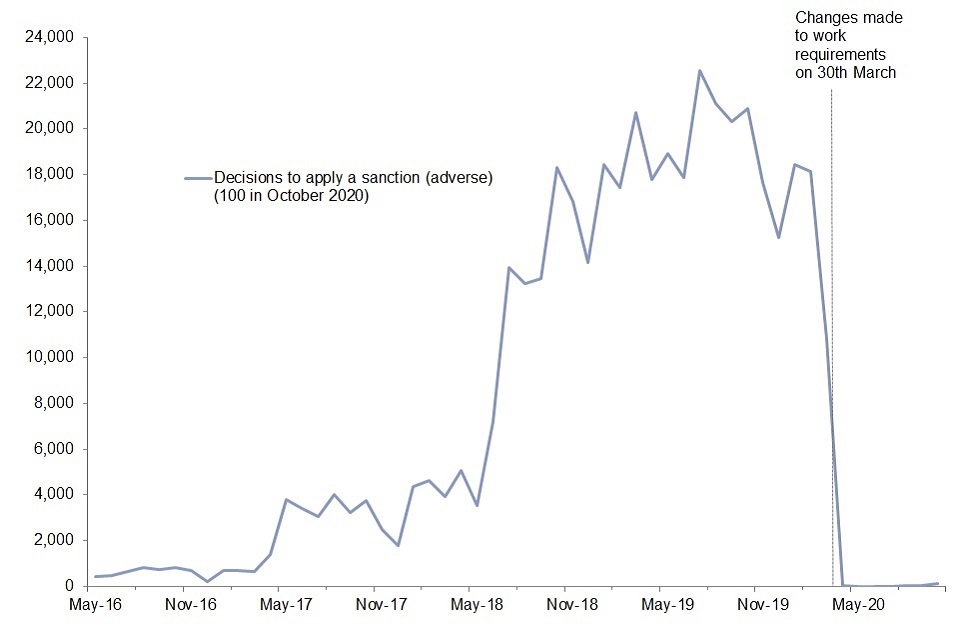
Source: Benefit Sanction Statistics data tables.
The numbers of adverse sanction decisions reached a peak in July 2019 after following an upward trend as UC full service was rolled out and the UC caseload built up. In March 2020 the number of adverse sanction decisions decreased to 11,000. The number of adverse sanction decisions continued to drop following the legislative changes to work requirements on 30 March (in response to the coronavirus (COVID-19) pandemic).
The changed legislation period came to an end on 30 June 2020, and there were 100 adverse decisions made in October 2020.
Summary of original UC full service adverse decision reasons from November 2019 to October 2020
| Original adverse decisions made by reason group | Latest Year | Latest Year (%) | Latest Quarter |
|---|---|---|---|
| Work-Focused Interviews | 72,820 | 90.5 | 150 |
| Availability for Work | 4,710 | 5.9 | 0 |
| Employment Programmes | 1,720 | 2.1 | 0 |
| Reasons for Leaving Previous Employment | 1,010 | 1.2 | 10 |
| Other | 210 | 0.3 | 0 |
| Total | 80,460 | 100 | 170 |
Notes:
- Note that these are original, adverse decisions, not all decisions as with other benefits.
- Disclosure control has been applied to this data for confidentiality purposes. Due to this, totals may not be the sum of the individual data breakdown.
- For a full breakdown of the adverse decision reasons, see the methodology document.
- Proportions are not given for the latest quarter, where the overall number of sanction decisions is low. This has been done because the disclosure control applied to the data could cause a misleading representation when calculating percentages.
Failure to attend or participate in a Work-Focused Interview accounted for 91% of all adverse decisions in the last year. Availability for Work was the next most common sanction reason, accounting for 6% of adverse decisions in the last year.
4. Universal Credit Live Service
There should be no comparisons made across benefits.
The data sources used to produce these statistics are very different and while we have attempted to use consistent methodology, there are differences in methodological approaches between benefits. Additionally, the benefits themselves are very different and require interpretation based on the rules of the specific benefit.
New claims to UC live service ceased in January 2018, and since then the remaining live service cases have been gradually migrated to UC full service. This has resulted in a gradual decrease in the number of live service sanction decisions. At the end of March 2019, the systems that were used to administer live service cases were shut down and no further original sanction decisions were made on this service. The UC live service decisions measures found in this section have continued to be updated to capture any outstanding decisions information for mandatory reconsiderations and appeals.
As the numbers for UC live service mandatory reconsiderations and appeals have continued to decrease, they have been impacted by the disclosure controls that are applied to this data for confidentiality purposes. As a result, we have taken the decision to freeze all UC live service sanction statistics, with their final update having been published in the version of this bulletin released on 10 November 2020. If you have any concerns or feedback on this decision please contact the Employment Programmes and Sanction Statistics team at epass.team@dwp.gov.uk.
4.1 UC live service: Sanction decisions and reasons – Experimental Statistics
UC live service sanction decisions by month, August 2015 to July 2020
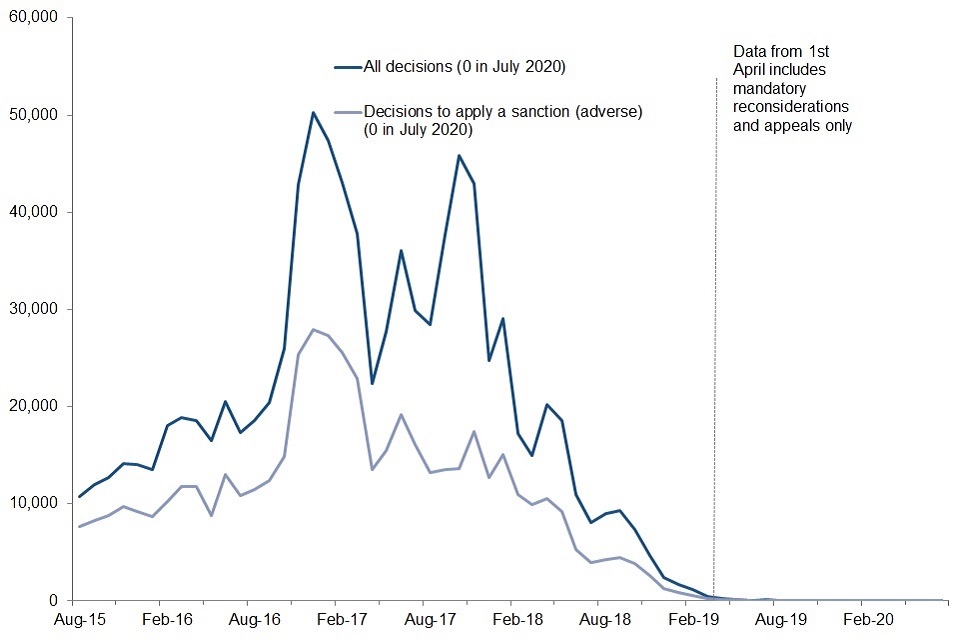
Notes:
- Data from 1 April 2019 includes mandatory reconsiderations and appeals only.
- UC live service sanction statistics have now been frozen, with the final update having been published in the version of this bulletin released on 10 November 2020.
Source: Sanction Decisions Stat-Xplore tables.
The total number of monthly decisions has varied since August 2015, with peaks in December 2016 (50,000) and October 2017 (46,000) and falling to 0 in July 2020.
The volume of decisions processed has fallen based on the fact that UC live service has closed to new claims, and that the entire caseload has migrated to UC full service.
Summary of UC live service decision outcomes at each stage, August 2015 to July 2020
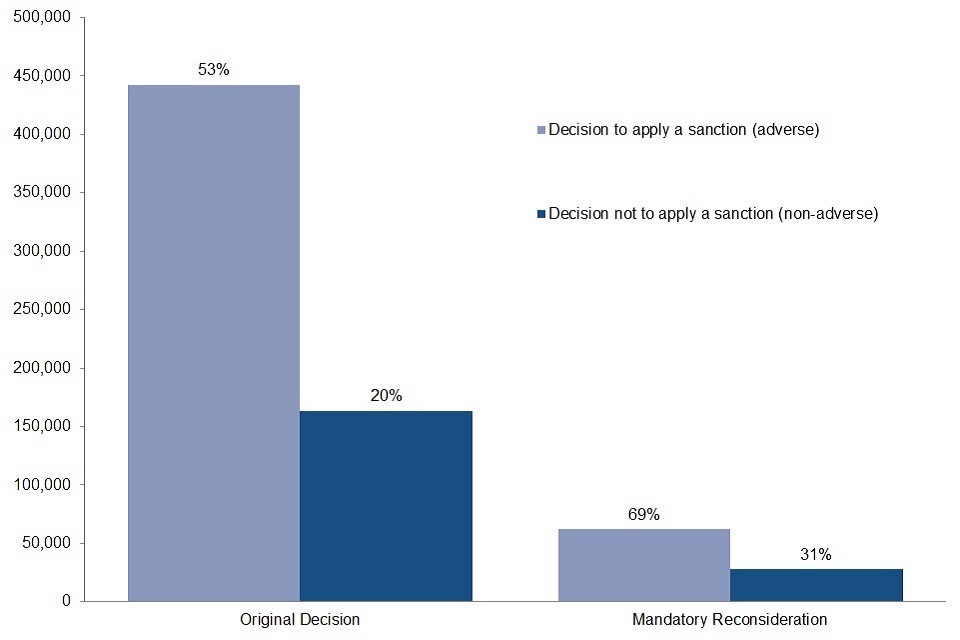
Notes:
- UC live service sanction statistics have now been frozen, with the final update having been published in the version of this bulletin released on 10 November 2020.
Source: Sanction Decisions Stat-Xplore tables.
53% of original decisions have resulted in a sanction being applied and 69% of mandatory reconsiderations resulted in a sanction being upheld since August 2015.
Summary of UC live service decision reasons from August 2019 to July 2020
| All decisions made by reason group | Latest Year | Latest Year (%) | Latest Quarter |
|---|---|---|---|
| Work-Focused Interviews | 30 | 53.3 | 0 |
| Availability for Work | 10 | 18.3 | 0 |
| Employment Programmes | 10 | 20.0 | 0 |
| Reason for Leaving Previous Employment | 0 | 0.0 | 0 |
| Other | 0 | 0.0 | 0 |
| Total | 60 | 100 | 0 |
Notes:
- Disclosure control has been applied to this data for confidentiality purposes. Due to this, totals may not be the sum of the individual data breakdowns.
- 100% of UC live service claimants were transferred onto UC full service by April 2019. There are no original decisions on UC live service past this point, hence any changes beyond this point refer to mandatory reconsiderations and appeals only.
- Proportions are not given for the latest quarter, where the overall number of sanction decisions is low. This has been done because the disclosure control applied to the data could cause a misleading representation when calculating percentages.
- For a full breakdown of the adverse decision reasons see the methodology document.
- UC live service sanction statistics have now been frozen, with the final update having been published in the version of this bulletin released on 10 November 2020.
Failure to attend or participate in a Work-Focused Interview accounted for 53% of all UC live service sanction decisions from August 2019 to July 2020.
4.2 UC live service: Destinations of claimants receiving a benefit sanction - Experimental Statistics
Distribution of number of months spent by UC claimants earning or on working age benefits in the 180 days (6 months) following a sanction decision
Notes:
- Decisions made from 1 August 2015 to 28 February 2019 for UC live service are included. There were no original adverse sanction decisions made on UC live service after 28 February 2019.
- UC live service sanction statistics have now been frozen, with the final update having been published in the version of this bulletin released on 10 November 2020.
Source: Benefit Sanction Statistics data tables.
After receiving a UC live service sanction decision, claimants spent an average (mean) of 153 days out of the following 180 days in receipt of benefit (UC, JSA, ESA (WRAG) or IS). On average (mean), only 2 of the 180 days were spent on a benefit that was not UC.
In the 180 days following a UC live service sanction decision, 4.9% of claimants were not in receipt of any of the tracked benefits (UC, JSA, ESA (WRAG) or IS). 76.2% of claimants spent over 150 days (5 months) in receipt of benefit and 70.3% of claimants spent the full 180 days in receipt of benefit.
After receiving a benefit sanction decision, UC live service claimants spent an average (mean) of 51 days out of the following 180 days earning, with 9.0% of claimants earning for the full 180 days after they had been sanctioned. See the methodology document for further information on how earnings are calculated.
5. Universal Credit Live and Full Service
There should be no comparisons made across benefits.
The data sources used to produce these statistics are very different and while we have attempted to use consistent methodology, there are differences in methodological approaches between benefits. Additionally, the benefits themselves are very different and require interpretation based on the rules of the specific benefit.
Methodology improvements, updates and suspension of measures
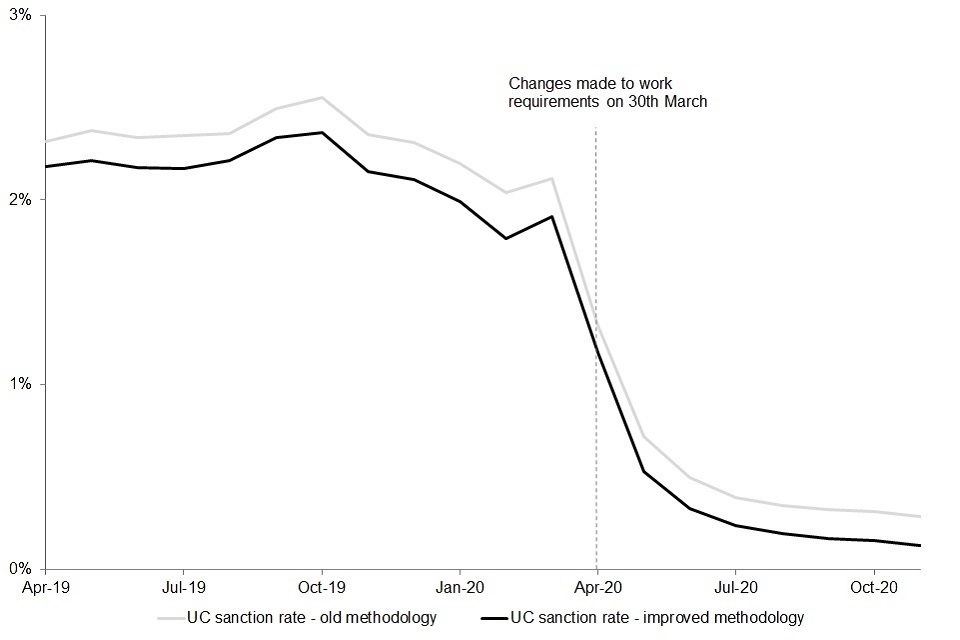
The benefit sanction rates presented in this bulletin are experimental statistics, and as such we are continuously seeking to understand more about the data in order to improve the methods used during calculations. While undertaking a methodology review, it has been identified that the monthly UC sanction rate has been over-counted in previous releases due to the method being used to distinguish open UC full service sanctions in the data; a simpler methodological approach was adopted to establish sanction durations, which made some assumptions surrounding overturned sanctions and claimants flowing into non-payment. Our enhanced understanding of the data means that we have now been able to improve the UC sanction rate methodology to more accurately identify open UC full service sanctions, and as a result we have implemented a methodological improvement and revised the UC sanction rate statistics in this release. While the over-count impacts the previously published statistics across the UC sanction rate time series, the overall story remains the same.
While carrying out a detailed investigation of the sanctions data to improve the methodology, it has been identified that the complex code used to process the data for UC sanction durations statistics was not performing as expected. This was complicated further by the combination and substantially different methods of processing data from the separate UC full service and UC live service systems. The measures affected are the sanction duration and median sanction length. While we consult with data engineers and architects to understand the complex data, and conduct further in depth investigations into the code, both of these series have been suspended for UC live service and UC full service as of the November 2020 release.
We are carrying out further investigative work on sanction durations, and aim to revise the complete series for sanction duration and median sanction length statistics on the basis of the improved methodology as soon as possible.
Investigations into the UC full service rate code and methodology have highlighted that the methodology currently used to calculate the UC rate differs from that described in versions of the release published before November 2020, with open sanctions already being included in the measure for UC full service. Investigations to establish if this is also the case for UC live service are ongoing, so we are continuing to suspend UC live service data from the rate and are publishing sanction rates for UC full service from April 2019. We will reinstate the UC live service rate as soon as possible, following the finalisation of investigations and successful completion of quality assurance processes.
Figures for UC full service adverse decisions, UC live service decisions and destinations and all legacy benefit measures are unaffected.
Impacts to sanction statistics during the coronavirus (COVID-19) pandemic
Statistics covered in this bulletin include data for sanction decisions during the coronavirus (COVID-19) pandemic. Although legislative changes to disapply work-search and work availability requirements were effective between 30 March 2020 and 30 June 2020 (in response to the pandemic), some sanction decisions for these types of failures could have been made during this time period because decisions are often made and processed after the date that the claimant failure occurred. This means that it was possible for sanction decisions to be recorded after legislation changes came into effect, in instances where a claimant prior to 30 March 2020 has failed to meet the work requirements set out in their claimant commitment. Additionally, sanction decisions were also possible for some failures which occurred after this date, for example, for leaving a job voluntarily without good reason or for misconduct.
Conditionality has been generally reintroduced from the 30 June, and new and revised claimant commitments for UC claimants are being reintroduced from 1 July 2020 on a phased approach and as capacity allows (3 August for New Style and Legacy JSA new claims). Claimants can only receive sanctions for failure to meet commitments once they have a new or updated tailored claimant commitment in place.
This impacts data for Universal Credit (UC) and Jobseeker’s Allowance (JSA) sanctions.
5.1 UC live and full service: Benefit sanction rates – Experimental Statistics
The sanction rate is calculated as the proportion of people on each benefit at a point in time (meaning on the same day that the claimant count is recorded) with a deduction from their benefit due to a sanction. This is different to the data on sanction decisions, which uses the total number of decisions across a whole month.
Investigations into the UC full service rate code and methodology have highlighted that the methodology currently used to calculate the UC rate differs from that described in versions of the release published before November 2020, with open sanctions already being included in the measure for UC full service.
In February 2021, the methodology used for calculating the Universal Credit sanction rate was refined in order to more accurately distinguish open sanctions in the data. This impacted the monthly sanction rate for Universal Credit across the entire time series, though the story remained the same. As such, care should be taken when comparing to statistics released before February 2021.
UC live service data has been temporarily suspended from this section, and statistics have been provided from April 2019 for full service only. For further information, see details at the start of section 5.
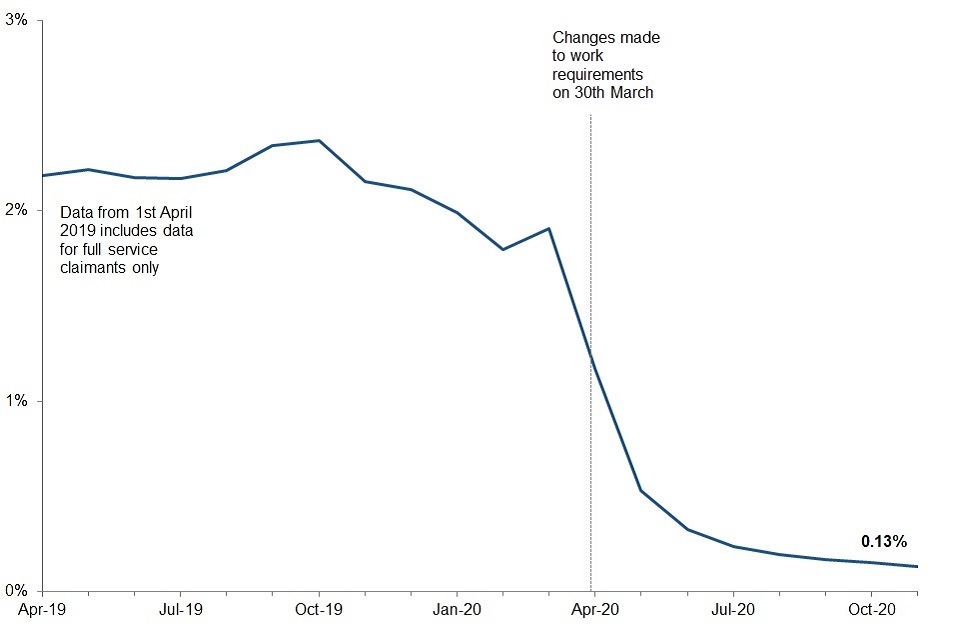
UC full service claimants with a sanction deduction, as a proportion of UC claimants, April 2019 to November 2020.
Source: Sanction Decisions Stat-Xplore tables.
Prior to legislation changes made on 30 March 2020, 1.91% of UC full service claimants subject to conditionality at the point where the sanction was applied had a deduction taken from their UC full service award as a result of a sanction. In November 2020, this proportion was 0.13%.
The experimental monthly rate of UC full service claimants with a sanction deduction has remained largely stable from April 2019 until March 2020. At this time there was a sharp downwards trend, which coincided with an increase to the UC caseload during the coronavirus (COVID-19) pandemic.
Over the course of the roll-out of UC, the balance of individuals subject to sanction as a proportion of the caseload has changed. In November 2020, 61% of the UC caseload were in the conditionality groups that could be subject to sanction, compared to 81% in August 2015.
5.2 UC live and full service: Benefit sanction durations – Experimental Statistics
While carrying out a detailed investigation of the sanctions data to improve the methodology, it has been identified that the complex code used to process the data for UC sanction durations statistics was not performing as expected. This was complicated further by the combination and substantially different methods of processing data from the separate UC full service and UC live service systems. The measures affected are the sanction duration and median sanction length. While we consult with data engineers and architects to understand the complex data, and conduct further in depth investigations into the code, both of these series have been suspended for UC live service and UC full service as of the November 2020 release.
We are carrying out further investigative work on sanction durations, and aim to revise the complete series for sanction duration and median sanction length statistics on the basis of the improved methodology as soon as possible.
6. Jobseeker’s Allowance
There should be no comparisons made across benefits.
The data sources used to produce these statistics are very different and while we have attempted to use consistent methodology, there are differences in methodological approaches between benefits. Additionally, the benefits themselves are very different and require interpretation based on the rules of the specific benefit.
6.1 JSA: Benefit sanction rates – Experimental Statistics
The sanction rate is calculated as the proportion of people on each benefit at a point in time (meaning on the same day that the claimant count is recorded) with a deduction from their benefit due to a sanction. This is different to the data on sanction decisions, which uses the total number of decisions across a whole month.
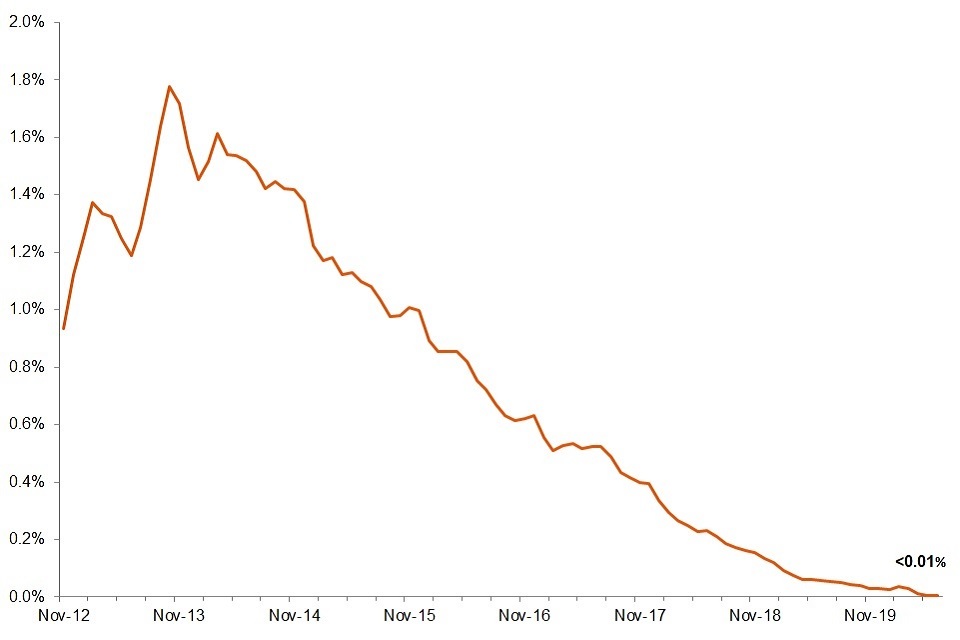
JSA claimants with a sanction deduction, as a proportion of JSA claimants, November 2012 to June 2020
Notes:
- JSA Rate contains ended sanctions only.
Source: Benefit Sanction Statistics data tables.
In June 2020, less than 0.01% of people on JSA had a deduction taken from their payment as a result of a sanction.
The experimental monthly rate of JSA claimants with a sanction deduction has decreased steadily over the past six years from a peak of 1.78% in October 2013, in line with the decrease in JSA sanction decisions.
6.2 JSA: Sanction decisions and reasons – Official Statistics
Statistics covered in this bulletin include data for sanction decisions during the coronavirus (COVID-19) pandemic. Although legislative changes to disapply work-search and work availability requirements were effective between 30 March 2020 and 30 June 2020 (in response to the pandemic), some sanction decisions for these types of failures could have been made during this time period because decisions are often made and processed after the date that the claimant failure occurred. This means that it was possible for sanction decisions to be recorded after legislation changes came into effect, in instances where a claimant prior to 30 March 2020 has failed to meet the work requirements set out in their claimant commitment. Additionally, sanction decisions were also possible for some failures which occurred after this date, for example, for leaving a job voluntarily without good reason or for misconduct.
Conditionality has been generally reintroduced from the 30 June, and new and revised claimant commitments for UC claimants are being reintroduced from 1 July 2020 on a phased approach and as capacity allows (3 August for New Style and Legacy JSA new claims). Claimants can only receive sanctions for failure to meet commitments once they have a new or updated tailored claimant commitment in place.
This impacts data for Universal Credit (UC) and Jobseeker’s Allowance (JSA) sanctions.
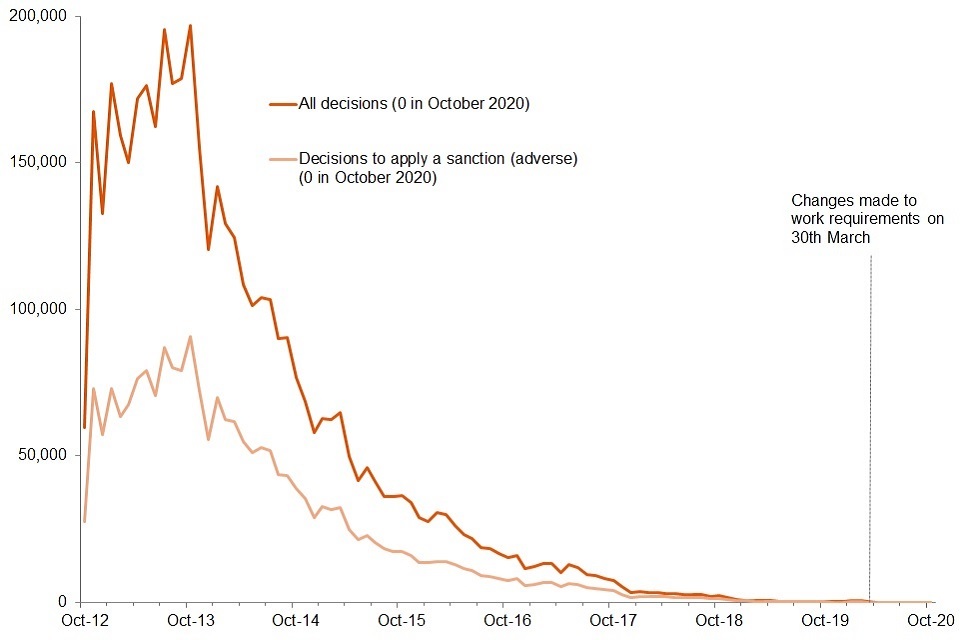
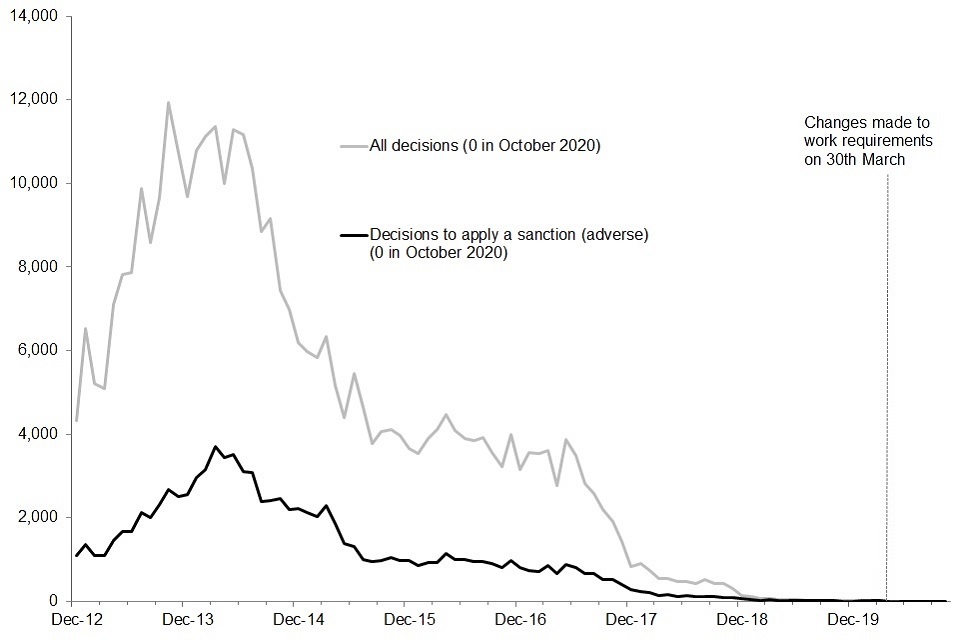
Sanctions decisions, October 2012 to October 2020
Source: Sanction Decisions Stat-Xplore tables.
The fall in decisions is in part due to the fall in JSA claimants as more people move to UC. There was an increase in JSA sanction decisions made in the earlier months of 2020 and also in August 2020. This resulted from processing backlogs of sanction decisions relating to referrals made under the reason of “failure to attend a place on a training scheme or employment programme without good reason”. Over the last 6 years, the total number of decisions per month has declined. Following the legislative changes in response to the coronavirus (COVID-19) pandemic the number of sanction decisions dropped further. JSA sanction decisions have remained low, with 0 in October 2020.
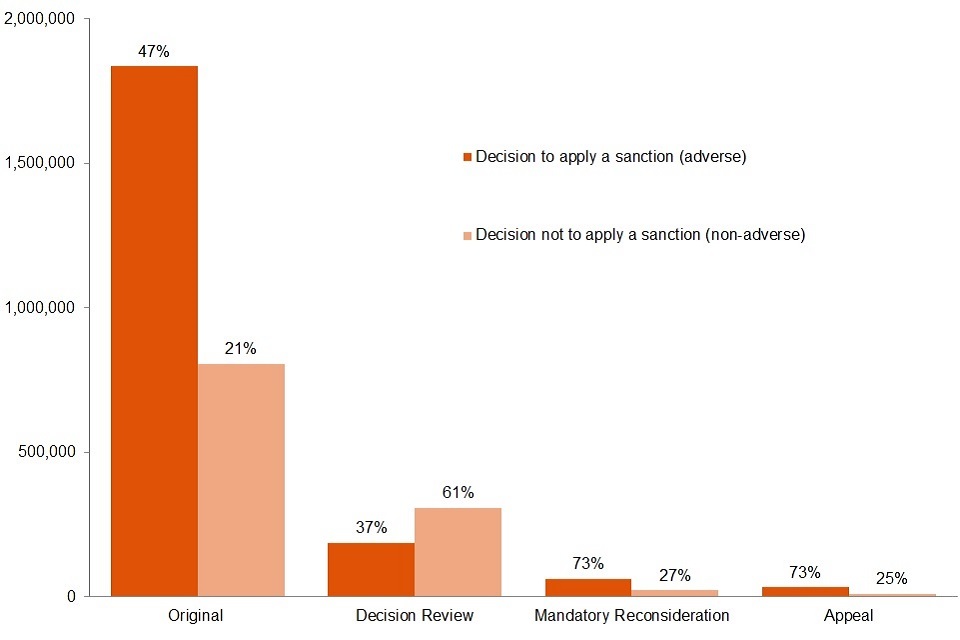
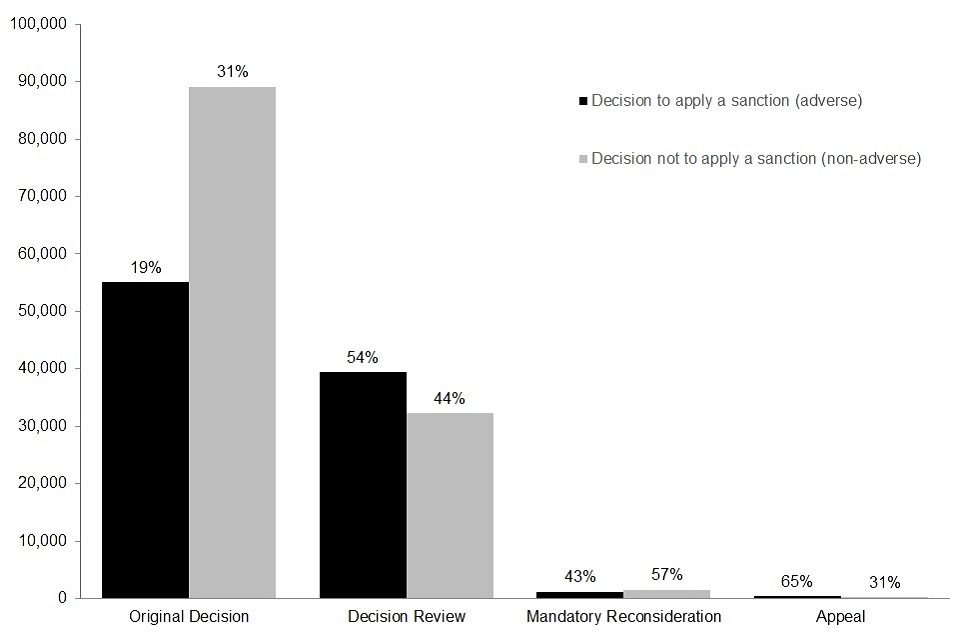
Summary of decision outcomes at each stage, October 2012 to October 2020
Source: Sanction Decisions Stat-Xplore tables.
Original decisions currently account for 86% of all decisions made since October 2012. Since October 2012, 47% of original decisions have resulted in a sanction being applied. Since the introduction of the Mandatory Reconsideration in November 2013, Appeals have dropped from a peak of 4,600 in October 2013 to only 5 in the last year.
Summary of decision reasons, November 2019 to October 2020
| All decisions made by reason group | Latest Year | Latest Year (%) | Latest Quarter |
|---|---|---|---|
| Work Programme | 10 | 0.9 | 0 |
| Work-Focused Interview | 230 | 14.0 | 0 |
| Availability for Work | 470 | 29.0 | 0 |
| Reason for Leaving Previous Employment | 0 | 0.0 | 0 |
| Other Employment Programmes | 900 | 56.0 | 50 |
| Other | 0 | 0.0 | 0 |
| Total | 1,620 | 100 | 50 |
Notes:
- Disclosure control has been applied to this data for confidentiality purposes. Due to this, totals may not be the sum of the individual data breakdowns.
- For a full breakdown of the adverse decision reasons, see the methodology document.
- Proportions are not given for the latest quarter, where the overall number of sanction decisions is low. This has been done because the disclosure control applied to the data could cause a misleading representation when calculating percentages.
The trend in JSA sanction decisions also coincides with the end of the Work Programme. Less than 1% of all JSA sanction decisions in the last year were due to Work Programme sanction referrals. These have been falling since October 2013, making the total number of JSA sanction decisions fall. Referrals to the Work Programme ended in March 2017.
56% of sanction decisions in the last year were for failing to attend a place on a training scheme or employment programme, followed by 29% due to Availability for Work referrals.
6.3 JSA: Benefit sanction durations – Experimental Statistics
The figures for benefit sanction durations are calculated based on sanctions that have ended, using the number of weeks that a claimant has a drop in their benefit payments to determine the length of the sanction. This means that if someone has multiple sanctions which are served without a break in deductions, this will be counted as one sanction in the statistics.
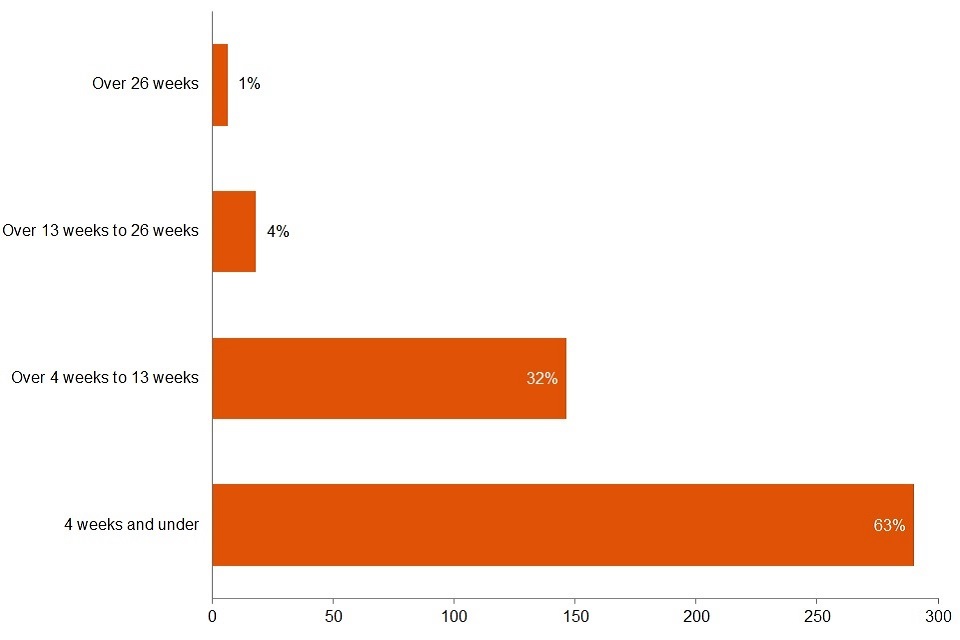
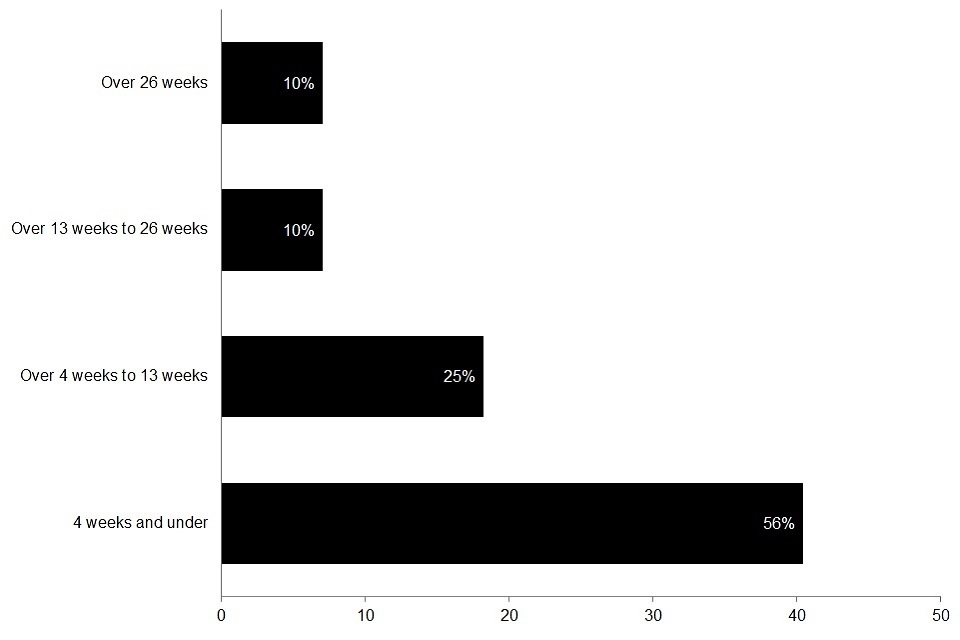
JSA sanctions completed by length of sanction (thousands), October 2012 to June 2020
Notes:
- Please note that percentages may not sum due to rounding.
Source: Benefit Sanction Statistics data tables.
95% of ended JSA sanctions lasted 13 weeks or less since October 2012. The average (median) JSA sanction lasted 28 days. See the methodology document for further information on why a median has been used.
Since October 2012, 63% of all sanctions that ended lasted 4 weeks or less, a further 32% lasted between 5 and 13 weeks. 5% lasted over 13 weeks. In the period from October 2012 to October 2020, 21% of all decisions were made on the referral reason group Availability for Work. A further 19% of all decisions in the same time period were made on the referral reason group Work-Focused Interviews. For a first-time failure, sanctions issued under this referral reason last 4 weeks. This helps to explain why such a large proportion of sanctions last 4 weeks and under.
6.4 JSA: Destinations of claimants receiving a benefit sanction – Experimental Statistics
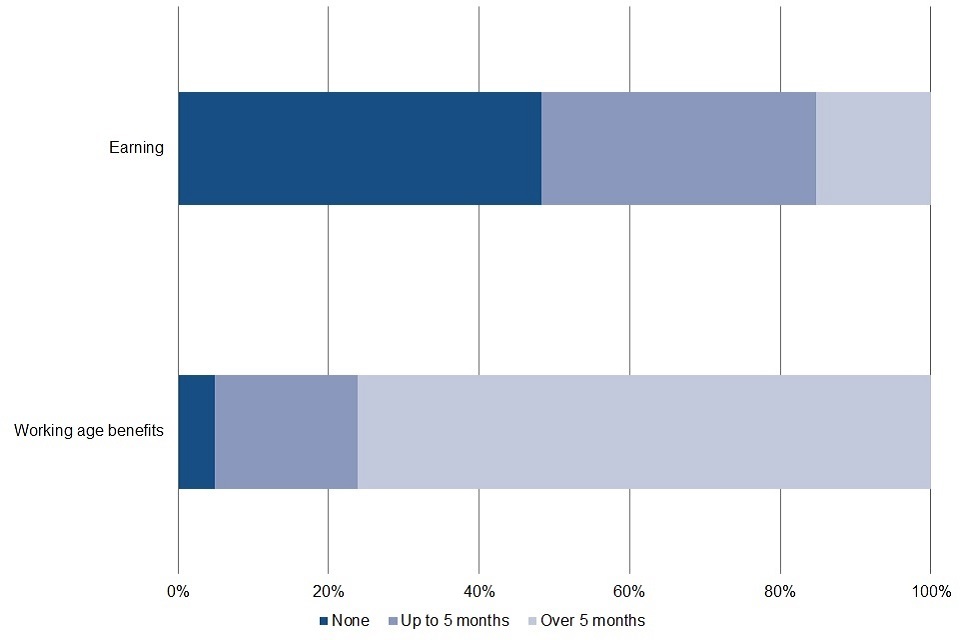
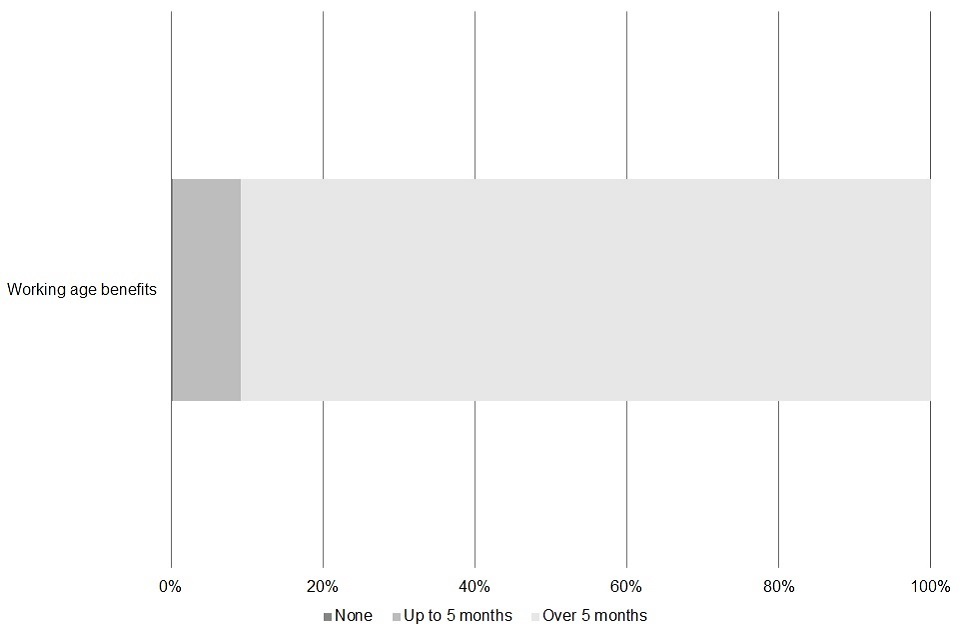
Distribution of number of months spent by JSA claimants on working age benefits or earning in the 180 days (6 months) following a sanction decision.
Notes:
- Decisions made from 22 October 2012 to 31 March 2020 for JSA are included.
Source: Benefit Sanction Statistics data tables.
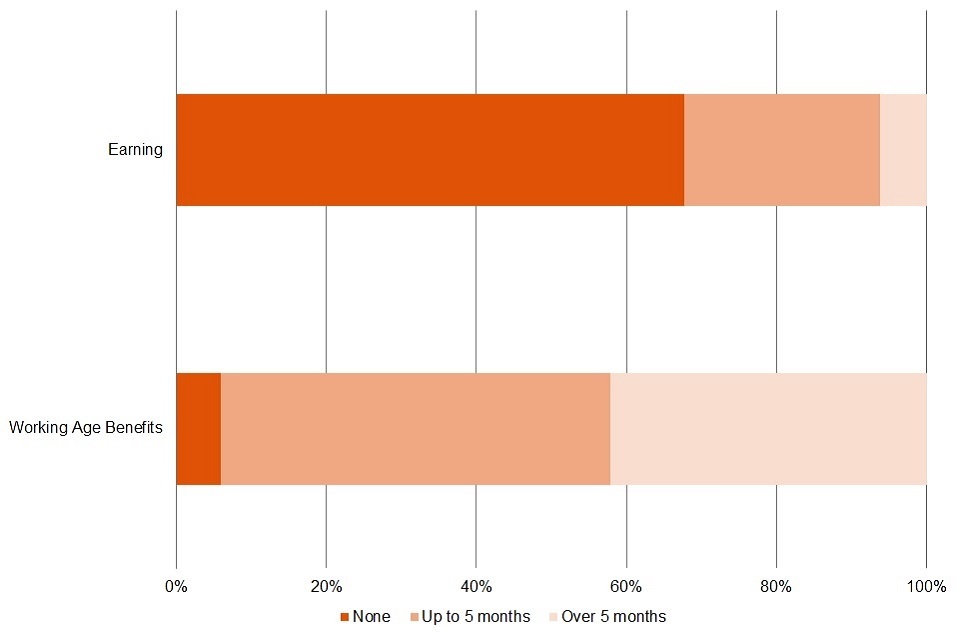
After receiving a JSA sanction decision, claimants spent an average (mean) of 111 days out of the following 180 days in receipt of benefit (JSA, UC, ESA (WRAG) or IS). On average (mean), 14 of the 180 days were spent on a benefit that was not JSA.
In the 180 days following a JSA sanction decision, 5.9% of claimants were not in receipt of any of the tracked benefits (JSA, UC, ESA (WRAG) or IS). 42.1% of claimants spent over 150 days (5 months) in receipt of benefit and 26.9% of claimants spent the full 180 days in receipt of benefit.
After receiving a benefit sanction decision, JSA claimants spent an average (mean) of 28 days out of the following 180 days earning, with 2.5% of JSA claimants earning for the full 180 days after they had been sanctioned. See the methodology document for further information on how earnings are calculated.
7. Employment and Support Allowance (Work Related Activity Group)
There should be no comparisons made across benefits.
The data sources used to produce these statistics are very different and while we have attempted to use consistent methodology, there are differences in methodological approaches between benefits. Additionally, the benefits themselves are very different and require interpretation based on the rules of the specific benefit.
As part of a claim to ESA, a Work Capability Assessment (WCA) is carried out. If the claimant’s capability for work is limited by their health condition or disability, and they are eligible to remain on ESA, the claimant is placed in one of two groups:
- the Work Related Activity Group (WRAG)
- the Support Group
Those in the Support Group do not have to attend interviews and are not subject to sanctions.
Those in the WRAG group may be expected to attend regular interviews with their work coach. They may also be expected to undertake Work Related Activity (WRA) to give them the best prospects of moving into work when they are able. Any WRA should be reasonable and appropriate for the claimant, based on their health condition or disability.
7.1 ESA (WRAG): Benefit sanction rates – Experimental Statistics
The sanction rate is calculated as the proportion of people on each benefit at a point in time (this means on the same day that the claimant count is recorded) with a deduction from their benefit due to a sanction. This is different to the data on sanction decisions, which uses the total number of decisions across a whole month.
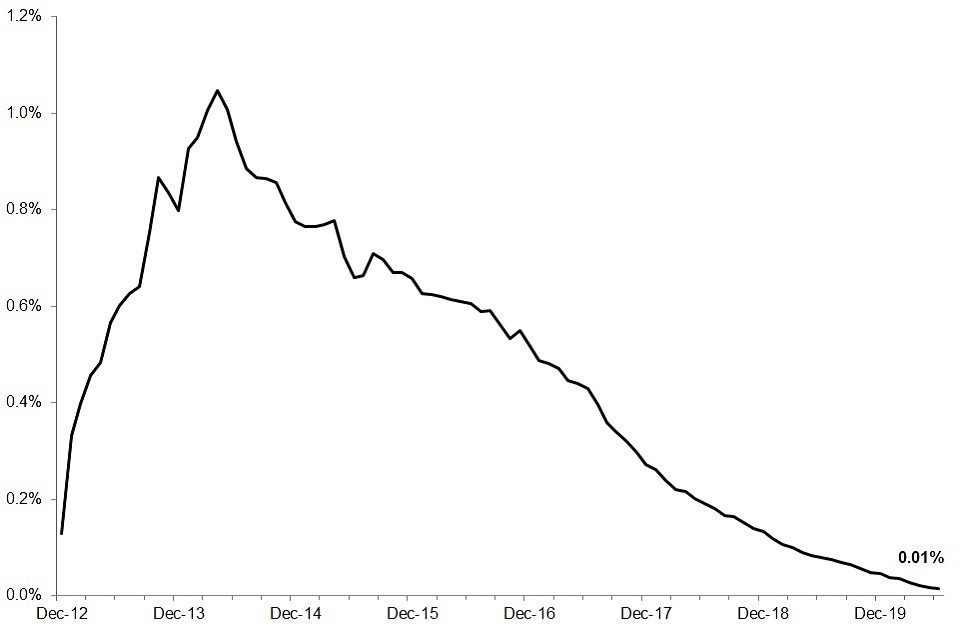
ESA (WRAG) claimants with a sanction deduction, as a proportion of all ESA (WRAG) claimants, December 2012 to June 2020
Notes:
- ESA (WRAG) rate contains ended sanctions only.
Source: Benefit Sanction Statistics data tables.
In June 2020, 0.01% of people in the ESA (WRAG) had a deduction taken from their personal allowance as a result of a sanction.
The experimental monthly rate of ESA (WRAG) claimants with a sanction deduction has fallen steadily from its peak of 1.05% in April 2014.
7.2 ESA (WRAG): Sanction decisions and reasons – Official Statistics
Sanction decisions, December 2012 to October 2020
Source: Sanction Decisions Stat-Xplore tables.
The total number of ESA (WRAG) sanction decisions has continued to fall since May 2017, to 0 in October 2020. It is expected that as UC full service continues to roll out and claimants move from ESA (WRAG) to UC, the ESA (WRAG) sanctions will remain low (in-line with the fall in the number of ESA (WRAG) claimants).
ESA (WRAG) has a high proportion of decisions that are subsequently changed. As the data is overwritten by the latest decisions each quarter, the number of adverse decisions in the last month of the previous quarter can drop by over 30%.
Summary of decision outcomes at each stage, December 2012 to October 2020
Source: Sanction Decisions Stat-Xplore tables.
19% of original decisions since December 2012 have resulted in a sanction being applied.
Summary of decision reasons, November 2019 to October 2020
| All decisions made by reason group | Latest Year | Latest Year (%) | Latest Quarter |
|---|---|---|---|
| Failure to Participate in Work-Related Activity | 10 | 4.7 | 0 |
| Failure to Attend Mandatory Interview | 110 | 98.1 | 0 |
| Total | 110 | 100 | 0 |
Notes:
- Disclosure control has been applied to this data for confidentiality purposes. Due to this, totals may not be the sum of the individual data breakdowns.
- For a full breakdown of the adverse decision reasons, see the methodology document.
- Proportions are not given for the latest quarter, where the overall number of sanction decisions is low. This has been done because the disclosure control applied to the data could cause a misleading representation when calculating percentages.
Trends are driven by work related activity sanction decisions. 92% of sanction decisions for ESA (WRAG) relate to failure to participate in work related activity since December 2012. There has been a change in this trend over time, as claimants have moved from ESA (WRAG) to UC following a change in circumstance or have been diverted to UC instead of ESA (WRAG). In the latest year, 98% of all sanction decisions were made due to failure to attend a mandatory interview.
7.3 ESA (WRAG): Benefit sanction durations – Experimental Statistics
The figures for benefit sanction durations are calculated based on sanctions that have ended, using the number of weeks that a claimant has a drop in their benefit payments to determine the length of the sanction. This means that if someone has multiple sanctions which are served without a break in deductions, this will be counted as one sanction in the statistics.
ESA sanctions completed by length of sanction (thousands), December 2012 to June 2020
Notes:
- Please note that percentages may not sum due to rounding.
Source: Benefit Sanction Statistics data tables.
81% of ended ESA (WRAG) sanctions lasted 13 weeks or less since December 2012. The average (median) ESA (WRAG) sanction lasted 28 days. See the methodology document for further information on why a median has been used.
Since December 2012, over half (56%) of all sanctions that ended lasted 4 weeks or less, a further 25% lasted between 5 and 13 weeks and 19% lasted over 13 weeks.
ESA (WRAG) sanctions are open-ended until the claimant complies with the interview requirement or work related activity that they failed to attend or participate in.
Once the claimant re-complies, a fixed-length sanction is imposed of 1, 2 or 4 weeks. This means that a sanction of longer than 4 weeks will be due to a claimant failing to re-comply, or where an individual has multiple sanctions which are served without a break in deductions.
7.4 ESA (WRAG): Destinations of claimants receiving a benefit sanction – Experimental Statistics
Distribution of number of months spent by ESA (WRAG) claimants on working age benefits in the 180 days (6 months) following a sanction decision
Notes:
- Decisions made from 3 December 2012 to 31 March 2020 for ESA (WRAG) are included.
Source: Benefit Sanction Statistics data tables.
After receiving an ESA (WRAG) sanction decision, claimants spent an average (mean) of 171 days out of the following 180 days in receipt of benefit (ESA (WRAG), UC, JSA or IS). On average (mean), only 5 of the 180 days were spent on a benefit that was not ESA (WRAG).
In the 180 days following an ESA (WRAG) sanction decision, 0.2% of claimants were not in receipt of any of the tracked benefits (ESA (WRAG), UC, JSA or IS). 90.8% of claimants spent over 150 days (5 months) in receipt of benefit and 85.0% of claimants spent the full 180 days in receipt of benefit.
8. About these statistics
The statistics in this publication are for Great Britain. We also publish a number of background and methodology documents.
Other National and Official Statistics
Read about other National and Official Statistics produced by the Department for Work and Pensions (DWP).
Users can also:
- produce their own tables and access demographic breakdowns using Stat-Xplore
- access supporting tables
- find further information about the sanctions process, source of these statistics and the publication rounding policy in the background information and methodology documents
Changes, revisions and known issues
The following information is about changes, revisions and known issues with the statistics.
Statistics covered in this bulletin include data for sanction decisions during the coronavirus (COVID-19) pandemic. Although legislative changes to disapply work-search and work availability requirements were effective between 30 March 2020 and 30 June 2020 (in response to the pandemic), some sanction decisions for these types of failures could have been made during this time period because decisions are often made and processed after the date that the claimant failure occurred. This means that it was possible for sanction decisions to be recorded after legislation changes came into effect, in instances where a claimant prior to 30 March 2020 has failed to meet the work requirements set out in their claimant commitment. Additionally, sanction decisions were also possible for some failures which occurred after this date, for example, for leaving a job voluntarily without good reason or for misconduct.
Conditionality has been generally reintroduced from the 30 June, and new and revised claimant commitments for UC claimants are being reintroduced from 1 July 2020 on a phased approach and as capacity allows (3 August for New Style and Legacy JSA new claims). Claimants can only receive sanctions for failure to meet commitments once they have a new or updated tailored claimant commitment in place.
This impacts data for Universal Credit (UC) and Jobseeker’s Allowance (JSA) sanctions.
Improved UC full service sanction rate methodology
The benefit sanction rates presented in this bulletin are experimental statistics, and as such we are continuously seeking to understand more about the data in order to improve the methods used during calculations. While undertaking a methodology review, it has been identified that the monthly UC sanction rate has been over-counted in previous releases due to the method being used to distinguish open UC full service sanctions in the data; a simpler methodological approach was adopted to establish sanction durations, which made some assumptions surrounding overturned sanctions and claimants flowing into non-payment. Our enhanced understanding of the data means that we have now been able to improve the UC sanction rate methodology to more accurately identify open UC full service sanctions, and as a result we have implemented a methodological improvement and revised the UC sanction rate statistics in this release. While the over-count impacts the previously published statistics across the UC sanction rate time series, the overall story remains the same.
Comparison of UC full service sanction rate when using the old and new methodologies, April 2019 to November 2020
Suspension of UC sanction durations and median statistics
While carrying out a detailed investigation of the sanctions data to improve the methodology, it has been identified that the complex code used to process the data for UC sanction durations statistics was not performing as expected. This was complicated further by the combination and substantially different methods of processing data from the separate UC full service and UC live service systems. The measures affected are the sanction duration and median sanction length. While we consult with data engineers and architects to understand the complex data, and conduct further in depth investigations into the code, both of these series have been suspended for UC live service and UC full service as of the November 2020 release.
We are carrying out further investigative work on sanction durations, and aim to revise the complete series for sanction duration and median sanction length statistics on the basis of the improved methodology as soon as possible.
Figures for UC full service adverse decisions, UC live service decisions and destinations and all legacy benefit measures are unaffected.
Partial suspension of UC sanction rate statistics
Investigations into the UC full service rate code and methodology have highlighted that the methodology currently used to calculate the UC rate differs from that described in versions of the release published before November 2020, with open sanctions already being included in the measure for UC full service. Investigations to establish if this is also the case for UC live service are ongoing, so we are continuing to suspend UC live service data from the rate and are publishing sanction rates for UC full service from April 2019. We will reinstate the UC live service rate as soon as possible, following the finalisation of investigations and successful completion of quality assurance processes.
Figures for UC full service adverse decisions, UC live service decisions and destinations and all legacy benefit measures are unaffected.
Migration from UC live service to UC full service
New claims to UC live service ceased in January 2018, and since then the remaining live service cases have been gradually migrated to UC full service. This has resulted in a gradual decrease in the number of live service sanction decisions. By 1 April 2019, the systems that were used to administer live service cases were shut down. Due to this, data for any original UC live service sanction decisions has been frozen from this point. Users should be mindful that this is also evident in the combined UC live and full service sanctions durations and rate data, and caution should be taken when comparing data before and after 1 April 2019. Work is currently underway to develop more data for UC full service, and the aim is to release this as and when it is available.
Migration of JSA and ESA claims to UC full service
In the May 2019 release, it was noted that JSA and ESA (WRAG) claims were closed when claimants were migrated to UC full service, resulting in both an increase in the number of claimants included in the JSA and ESA (WRAG) rate and retrospective changes to previously published rates.
Comparison across different benefits
Users should be aware that there are differences between sanctions policy across benefits that will affect comparisons. Whilst the same methodology has been used to produce these statistics the benefits themselves are very different and require interpretation based on the rules of the specific benefit. The sanctions process means that the outcome of a sanction is subject to retrospective changes which should be considered when using the decision data.
Interpretation of data and the sanction process
Care must be taken when interpreting the duration charts and figures as, for fair comparisons, sufficient time must have passed before longer duration categories can be achieved, for example, sanctions lasting 27 weeks or more starting in January 2016 would not begin to be cleared until July 2016. Deductions can end for a number of reasons, such as the claimant leaves benefit, transfers to a different conditionality group, or the claimant is earning enough on UC that they no longer have any standard allowance from which a deduction can be taken. These statistics include those sanctions which subsequently go on to be overturned. Claimants whose sanction is overturned will be repaid any deduction. When a claimant leaves benefit following a sanction start, but before the sanction is served, the claim end date is taken to be the sanction end date. In the cases where a sanction end date is the same date as the sanction start (the claimant serves zero days of sanction), the cases are not counted as a sanction served and are excluded from the data.
Contact information and feedback
Authors: Tonia Lewis, Martyn Rath and Michael Willows
Lead Statistician: Tracy Hills
For more information on sanction statistics, contact the Employment Programmes and Sanction Statistics team at epass.team@dwp.gov.uk.
DWP would like to hear your views on our statistical publications. If you use any of our statistics publications, we would be interested in hearing what you use them for and how well they meet your requirements. Please email DWP at stats-consultation@dwp.gov.uk.
Users can also join the “Welfare and Benefit Statistics” community at StatsUserNet. DWP announces items of interest to users via this forum, as well as replying to users’ questions.
ISBN: 978-1-78659-295-8