Below Average Resources: for financial years ending 2001 to 2023
Updated 29 January 2026

© Crown copyright 2026
This publication is licensed under the terms of the Open Government Licence v3.0 except where otherwise stated. To view this licence, visit nationalarchives.gov.uk/doc/open-government-licence/version/3 or write to the Information Policy Team, The National Archives, Kew, London TW9 4DU, or email: psi@nationalarchives.gov.uk.
Where we have identified any third party copyright information you will need to obtain permission from the copyright holders concerned.
This publication is available at https://www.gov.uk/government/statistics/below-average-resources-for-financial-year-2022-to-2023/below-average-resources-for-financial-year-2022-to-2023
We will review the impact of the changes to the Family Resources Survey and Households Below Average Income statistics before producing further updates to the Below Average Resources Official Statistics in Development. For more information see the Family Resources Survey release strategy.
1. Introduction
The Department for Work and Pensions (DWP) is developing a new poverty measure named ‘Below Average Resources’ (BAR) based on the approach proposed by the Social Metrics Commission (SMC).
The Office for Statistics Regulation (OSR) Review of Income-Based Poverty Statistics recommended that the DWP assess how the SMC’s proposals can be implemented to enhance the public value of our statistics. The OSR recognised that a basket of main poverty measures is required to meet varying user needs, but that signposting and coherence between different statistics could be improved to help users navigate the varying measures.
The BAR measure is an Official Statistics in Development that was published for the first time in January 2024 in Below Average Resources: Developing a new poverty measure. That publication sets out the context and methodology of BAR in more detail, and provides a comprehensive comparison with current measures in Households below average income (HBAI).
The Department for Work and Pensions sought user feedback on the BAR poverty measure through an analytical consultation running from 18 January to 11 April 2024. The consultation response was initially planned for publication in July but was postponed in line with pre-election guidance. The consultation response has now been published.
This publication is focused on updating the baseline to include data for 2022 to 2023 on which to base the required future development work as set out in the consultation response but does not include any substantial changes to the measure compared to the initial publication.
2. What you need to know
The Below Average Resources statistics are Official Statistics in Development based on the approach proposed by the SMC. Unlike HBAI which measures net equivalised disposable household income, BAR uses a broader approach, Total Resources Available. The BAR approach provides a more expansive view of available resources (both savings and inescapable costs) than the income measurement adopted under HBAI, and also includes some methodological changes proposed by the SMC.
Official Statistics in Development are Official Statistics that are undergoing development or evaluation; they may be new or existing statistics, and will be tested with users, in line with the standards of trustworthiness, quality, and value in the Code of Practice for Statistics. The DWP will seek user feedback alongside the publications to inform the ongoing development of the statistics to enhance their public value.
Once fully developed, the BAR measure will add value alongside existing DWP poverty measures, like HBAI, UK’s primary source of poverty estimates.
Where we refer to poverty in this report, we mean poverty as defined by the BAR approach.
Estimates are based on the Family Resources Survey (FRS). The data in this report are primarily from interviews conducted between April 2022 and March 2023. The achieved sample size was 25,000 households compared to around 16,000 households during FYE 2022. More information on the FRS fieldwork for this year can be found in the FRS Background Information and Methodology report. Data from previous years have also been used, as the poverty line is created based on a 3-year average, and to provide a historical series.
A range of ODS supported tables are available alongside this release, breaking down the results presented in this report for different demographic characteristics. All tables can be downloaded via the BAR release page.
Overview of measurement framework
The Social Metrics Commission (SMC) focuses on ‘poverty now’, that is the extent to which families have resources currently available to meet immediate needs. The Total Resources Available (TRA) to the family are calculated on a weekly basis, similarly to how incomes are calculated on a weekly basis in the DWP’s HBAI publication. In addition to calculating the TRA, the SMC proposed a wider framework including the need to include those not captured by household surveys like the FRS.
As set out in the first publication Below Average Resources: Developing a new poverty measure, DWP will focus on development of the measure using the FRS data initially. It is essential to develop a robust core measure for calculating TRA, with significant further development work required to achieve this. This will be necessary ahead of any further work to consider the wider measurement framework components, such as poverty persistence and lived experience indicators, as well as potential changes to wider data sources.
Diagram 1: The current BAR measurement framework (Boxes 1 and 2. These are sequential, with Box 1 actions followed by Box 2, but are displayed separately here for interpretability)
Box 1 – Total Resources Available (TRA) calculation

This diagram shows the Total Resources Available (TRA) calculation. It shows that TRA is calculated as Net Income, plus Other resources available i.e. Weekly measure of liquid assets, minus Inescapable family-specific costs i.e. childcare, disability, recurring hosing costs, others that require further research, minus Debt i.e. obligated weekly debt repayments. The debt information is greyed out to demonstrate that it is not used in the current realisation of the measure due to a lack of suitable data.
Box 2 – Estimating poverty based on Total Resources Available

This diagram shows how the poverty threshold is calculated and the overcrowding adjustment applied. The diagram shows that the Total Resources Available (TRA) values from three years (t, t-1, t-2) are equivalised. The smoothed equivalised median TRA (averaged across three years) is then calculated and the poverty threshold calculated from this as 54% of the smoothed equivalised median TRA. Family specific poverty thresholds are then calculated using reverse equivalisation. After this, for those in overcrowded housing, their TRA is calculated as their TRA minus the cost of renting an additional room. Every family’s TRA is then compared to their poverty threshold to determine poverty status.
Total Resources Available
Box 1 (Diagram 1) shows the calculation of the Total Resources Available (TRA). The calculation of Net Income is on the same basis as for HBAI on an After Housing Costs (AHC) basis.
The TRA additionally accounts for other available resources from liquid assets (e.g., accessible savings), deductions due to obligated debt repayments (though these are not included in the current realisation of the measure) and inescapable family-specific costs relating to childcare costs and extra costs of disability. Further inescapable family-specific recurring housing costs for mortgage capital repayments are also included, compared to HBAI AHC which includes only the interest element of mortgage repayments.
The TRA calculation is undertaken at the ‘sharing unit’ level (rather than at the household level, as for HBAI). The sharing unit is defined as individuals within a household who are related. Whilst narrower than a household, this new approach is wider than a ‘benefit unit’. For further detail on benefit unit and household definitions see the FRS methodology report.
The sharing unit is based on anyone self-reporting being related to another individual in the household (e.g. including foster, step, in law and other relatives).
Estimating poverty based on Total Resources Available
Box 2 (Diagram 1) sets out the methodology for determining poverty estimates based on the Total Resources Available (TRA) calculated in Box 1 (Diagram 1).
The SMC propose a relative poverty measure, based on the position that poverty is experienced with reference to others in society as norms will change over time. However, the SMC also note that social norms and trends take time to adapt to changes in overall economic conditions, and therefore propose ‘smoothing’ the measure by calculating the poverty threshold based on a three-year average.
To calculate the poverty threshold, the equivalised TRA for sharing units is calculated for the current and previous two years. The equivalised median TRA estimates for each of the three years are then averaged to determine the smoothed median equivalised TRA (i.e. a lagged three-year rolling average of equivalised median TRA). Individuals are defined as being in poverty in a particular year if their equivalised TRA for that year is below 54% of the smoothed equivalised median TRA (smoothed over that year and the two previous years). Under the BAR approach, this will be referred to as being in ‘low resources’, similarly to HBAI referring to being below the corresponding threshold as being in low income.
The SMC adopted this approach because their aim was to create a measure that provided a more accurate picture of the composition of individuals in poverty and how both levels and composition change over time, and because it concluded that the choice of poverty thresholds is somewhat arbitrary.
After this calculation, one further adjustment is made to account for housing adequacy. If individuals are classed as being in overcrowded accommodation (see background and methodology note for definitions), their TRA value is updated to deduct the regional cost of renting another room. If the equivalised TRA value falls below the poverty threshold after this adjustment has been made, these individuals are also counted as being in low resources.
Changes since last publication
There have been no substantial methodological changes this year, but there have been changes to the underlying code. These include:
- an update to the variable used to calculate total liquid assets, a component of TRA. From when it became available in 2019/20, TOTCAPB4 is now used in place of TOTCAPB3. Further details of this change can be found in the FRS methodology report
- an update to the method of estimating of the extra costs of disability that are relevant to each sharing unit. Disability benefits administered by Social Security Scotland (Adult Disability Payment and Child Disability Payment) are now included in the calculation of the extra costs of disability, alongside Disability Living Allowance, Personal Independence Payment, and Attendance Allowance
Several changes to improve code robustness have also been made. In particular:
- logic to account for leap years in the conversion between annual and weekly amounts has been applied more consistently across the code
- code to prevent the misinterpretation of non-response codes in mortgage principal calculations has been added
- corrections to the application of deflators
- switch from the use of after housing-costs deflators to before-housing-costs deflators where appropriate
Full methodology details can be found in our 2024 Background and Methodology note.
3. Poverty Trends
All individuals
Figure 1: Percentage of all individuals in low resources, FYE 2001 to FYE 2023
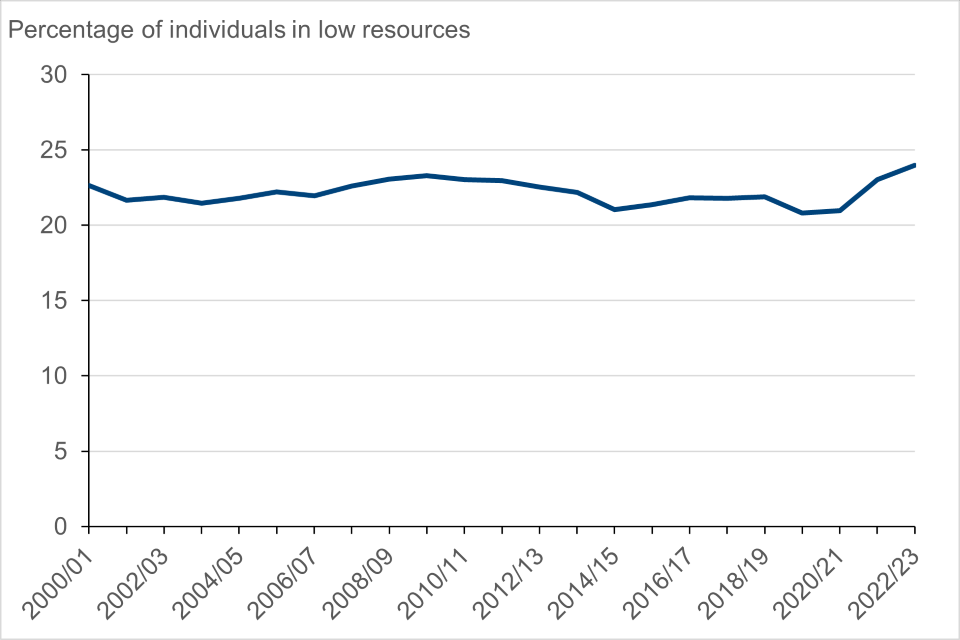
Between FYE 2022 and FYE 2023, the percentage of individuals in low resources rose by 1 percentage point to 24%.
Age Groups
Figure 2: Percentage of individuals in low resources by age group, FYE 2001 to FYE 2023
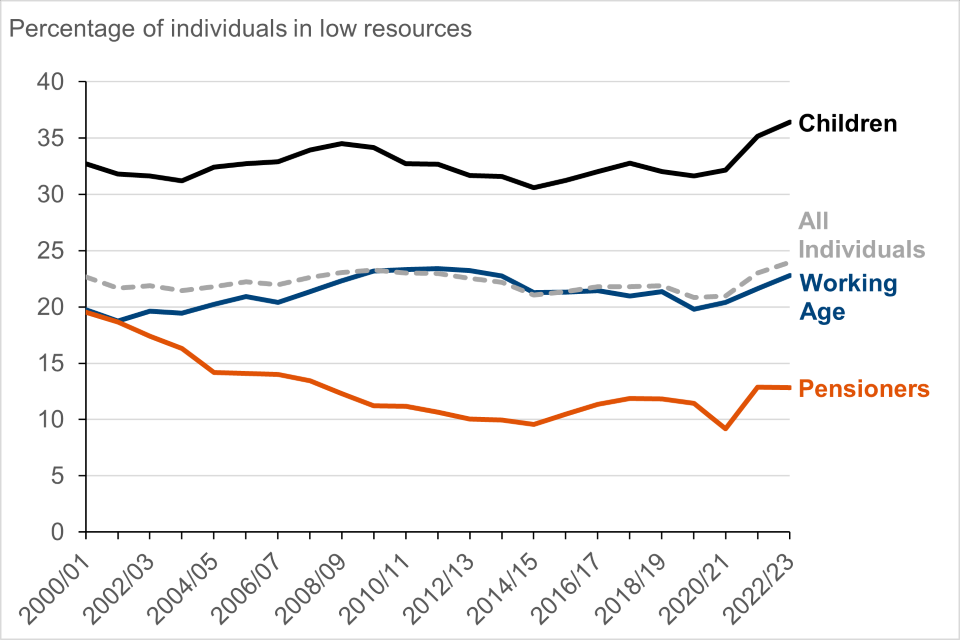
Between FYE 2022 and FYE 2023, the percentage of children in low resources rose by 1 percentage point to 36%.
Between FYE 2022 and FYE 2023, the percentage of working-age individuals in low resources rose by 1 percentage point to 23%.
Between FYE 2022 and FYE 2023, the percentage of pensioners in low resources did not change.
Disability
Figure 3: Percentage of individuals in low resources by disability status of sharing unit, FYE 2001 to FYE 2023
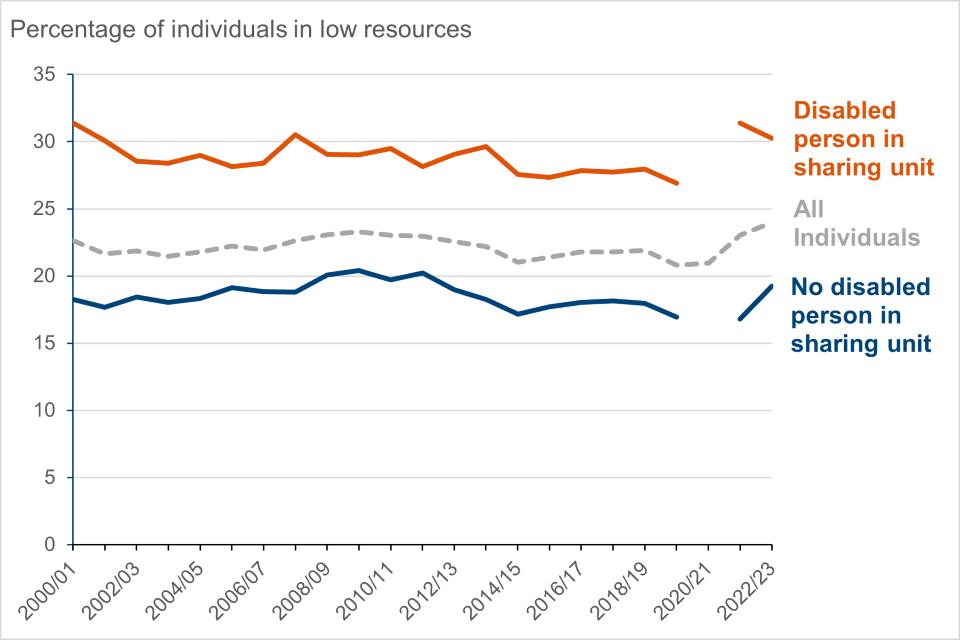
Between FYE 2022 and FYE 2023, the percentage of individuals in low resources living in sharing units where someone is disabled fell by 1 percentage point to 30%.
Between FYE 2022 and FYE 2023, the percentage of individuals in low resources living in sharing units where no one is disabled rose by 2 percentage points to 19%.
Ethnicity
Figure 4: Percentage of individuals in low resources by ethnicity of the head of the household, FYE 2001 to FYE 2023
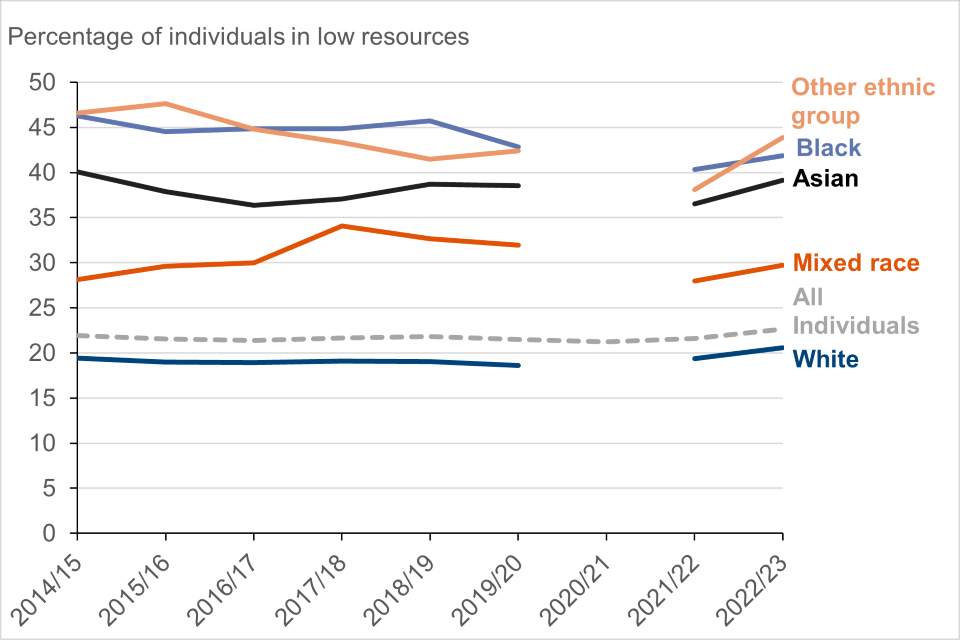
Ethnicity figure notes:
- estimates are made using a three-year rolling average. This is an established method used to smooth out observed variation in single year estimates for these groups, which are subject to smaller sample sizes
- single year estimates for FYE 2021 were unavailable due to data quality issues. Therefore, the three-year averages encompassing that year (for example, three-year periods ending FYE 2022 and FYE 2023) are calculated with the single year FYE 2021 omitted, averaging across two years of data instead
- harmonised standards for ethnicity questions were fully adopted across the UK from 2012 to 2013. This combined with the three-year averaging means estimates start from the period ending FYE 2015
- ethnicity information is based on the head of the household
Between FYE 2022 and FYE 2023, the percentage of individuals in low resources rose for all ethnic groups. The largest increases were seen in Asian/ Asian British and other ethnic groups which rose by 3 and 6 percentage points respectively.
Benefit Unit Type
Figure 5: Percentage of individuals in low resources by type of benefit unit, FYE 2001 to FYE 2023
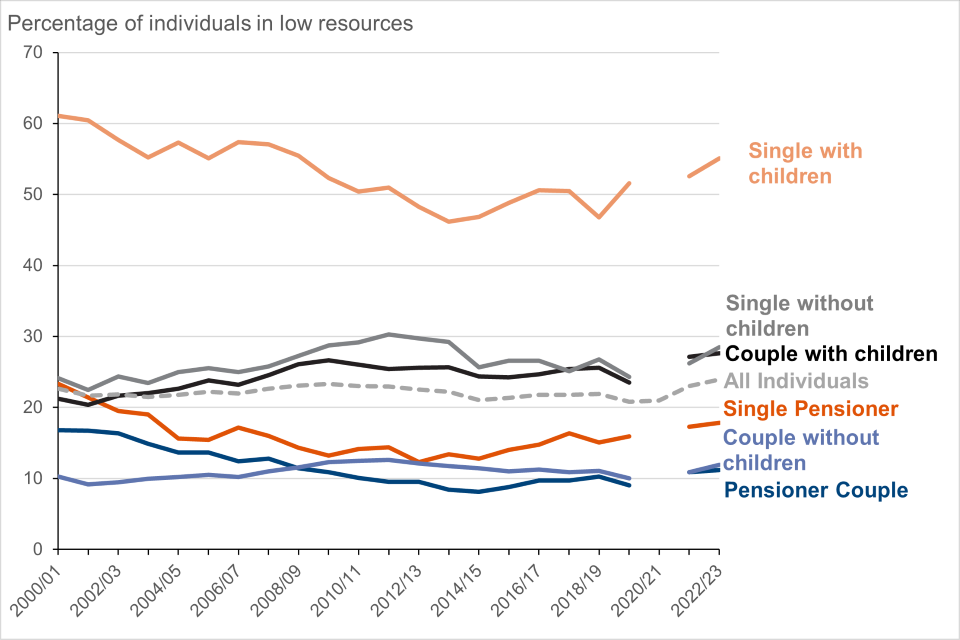
Between FYE 2022 and FYE 2023, the percentage of individuals in low resources rose for all benefit unit types. The largest increases were seen in single, non-pensioner benefit units, where both those with and without children rose by 2 percentage points to 55% and 28% respectively.
Individuals in couple, non-pensioner benefit units also saw a rise in the percentage in low resources, although not as substantial. The percentage of individuals in couple, non-pensioner benefit units with and without children both rose by 1 percentage point between FYE 2022 and FYE 2023, to 28% and 12% respectively.
Benefit units where at least one adult is pension age rose by the least between FYE 2022 and FYE 2023. The percentage of single pensioner benefit units in low resources rose by 1 percentage point to 18%, however the percentage of pensioner couples in low resources stayed consistent at 11%.
Tenure Type
Figure 6: Percentage of individuals in low resources by tenure type, FYE 2001 to FYE 2023
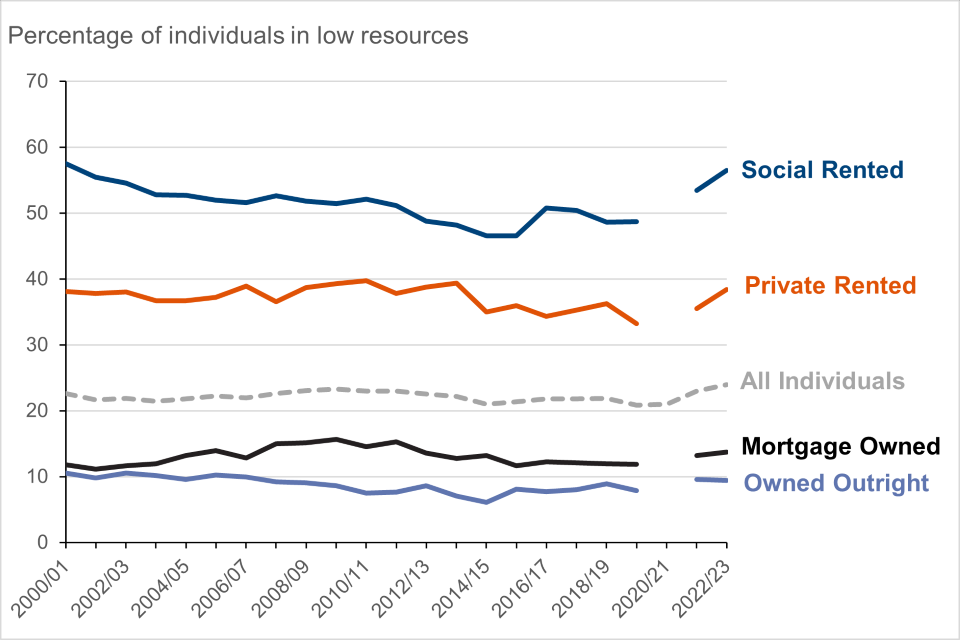
Between FYE 2022 and FYE 2023, the percentage of individuals who live in socially rented housing in low resources rose by 3 percentage points to 56%.
Between FYE 2022 and FYE 2023, the percentage of individuals who live in private rented housing in low resources rose by 3 percentage points to 38%.
Between FYE 2022 and FYE 2023, the percentage of individuals who own their house with a mortgage in low resources rose by 1 percentage point to 14%.
Between FYE 2022 and FYE 2023, the percentage of individuals who own their house outright in low resources fell to 9%.
Economic Status
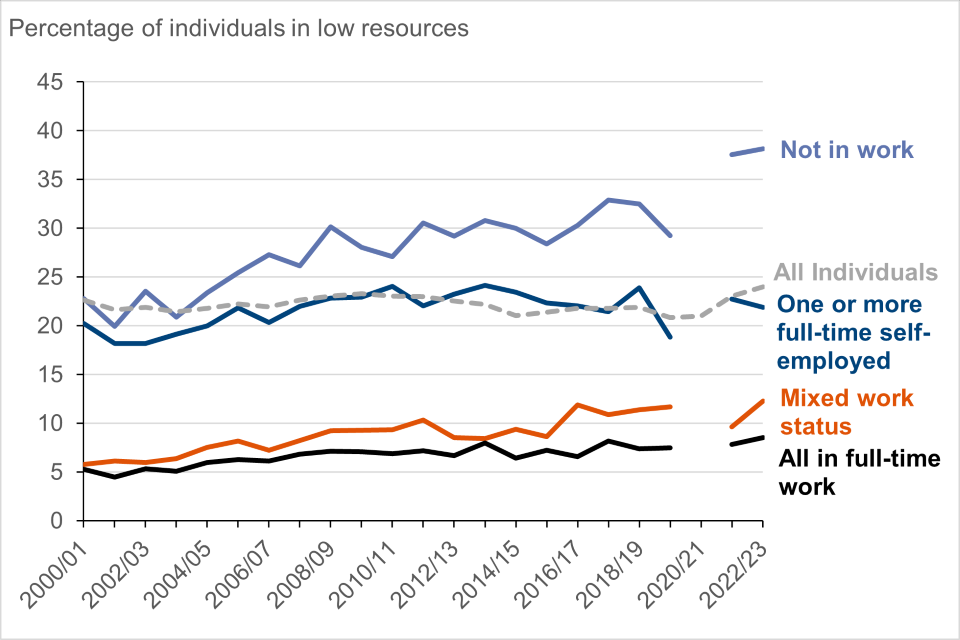
Figure 7: Percentage of individuals in low resources by economic status of benefit unit, FYE 2001 to FYE 2023
Economic status figure notes:
- ‘Mixed work status’ refers to an aggregation of the following groups: ‘Couple with one full-time work and one part-time work’, ‘Couple with one full-time work and one not working’, ‘No one in full-time work with one or more in part time work’
- ‘Not in work’ refers to an aggregation of the following groups: ‘No one in work with one or more aged 60 or over’, ‘No one in work with one or more unemployed’, ‘No one in work with other inactive’
Between FYE 2022 and FYE 2023, the percentage of benefit units where all adults are not in work in low resources rose by 1 percentage point to 38%.
Between FYE 2022 and FYE 2023, the percentage of benefit units with a mixed work status in low resources rose by 3 percentage points to 12%.
Between FYE 2022 and FYE 2023, the percentage of benefit units with all adults working full-time in low resources rose by 1 percentage point to 9%.
Between FYE 2022 and FYE 2023, the percentage of benefit units with one or more full-time self-employed in low resources fell by 1 percentage point to 22%.
Country
Figure 8: Percentage of individuals in low resources by country, FYE 2001 to FYE 2023
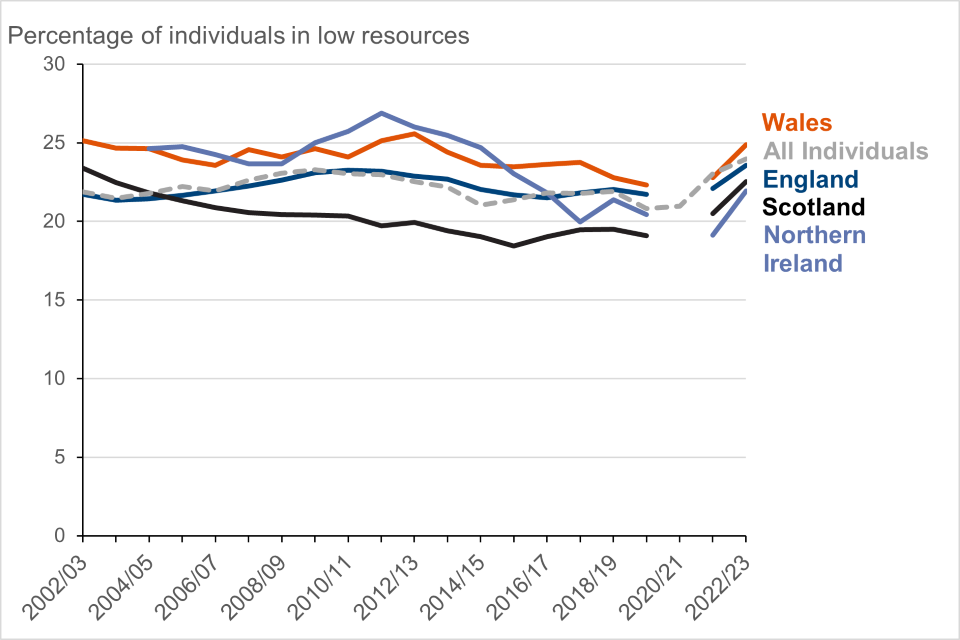
Country figure notes:
- estimates are made using a three-year rolling average. This is an established method used to smooth out observed variation in single year estimates for these groups, which are subject to smaller sample sizes
- single year estimates for FYE 2021 were unavailable due to data quality issues. Therefore, the three-year averages encompassing that year (for example, three-year periods ending FYE 2022 and FYE 2023) are calculated with the single year FYE 2021 omitted, averaging across two years of data instead
- estimates are presented for FYE 2003 to FYE 2023, although not all years are labelled on the x-axis for interpretability
- data for Northern Ireland is only available from FYE 2003 and poverty estimates are only provided from the three years to FYE 2006 onwards due to three-year averaging
Between FYE 2022 and FYE 2023 the percentage of individuals in poverty rose for all countries in the UK. The largest increase was seen in Northern Ireland which rose by 3 percentage points to 22%. Poverty rates in Scotland, England, and Wales all rose by 2 percentage points in this period to 23%, 24%, and 25% respectively.
4. About these statistics
The status of Below Average Resources
The BAR measure is an Official Statistic in Development.
Official Statistics in Development are Official Statistics that are undergoing development or evaluation. They may be new or existing statistics, and will be tested with users, in line with the standards of trustworthiness, quality, and value in the Code of Practice for Statistics. The DWP will seek user feedback alongside the publications to inform the ongoing development of the statistics to enhance their public value.
Definitions for terminology used throughout the report can be found in our Background and Methodology note.
5. Signposting to related statistics
The OSR review published in May 2021 recommended that income-based poverty statistics should improve the way they reference other data sources via signposting. This section has been expanded with additional links to sources to provide clearer and more detailed signposting to other income-based poverty statistics. This information will be reviewed and updated annually.
Households Below Average Income
The DWP publishes Households Below Average Income (HBAI) Accredited Official Statistics annually, with analysis based on data from the Family Resources Survey (FRS). These statistics estimate the number and percentage of individuals living in low-income households in the UK. Measures of material deprivation and household food security are also included in the HBAI publication to provide a broader view on aspects related to poverty. The HBAI publication meets the DWP’s statutory obligation to publish a measure of relative and absolute low income for children, and low income and material deprivation for children under section 4 of the Welfare Reform and Work Act 2016.
Other DWP National and Official Statistics
Details of other National and Official Statistics produced by the Department for Work and Pensions can be found on the DWP website with a schedule of statistical releases over the next 12 months and a list of the most recent releases.
In accordance with the Code of Practice for Statistics, all DWP National Statistics are also announced on the government statistics website, and in the DWP statistics release calendar.
Other official income statistics
The UK has two main, official data sources of household income statistics: the Family Resources Survey (FRS) run by the Department for Work and Pensions (DWP) and the Household Finances Survey (HFS) run by the Office for National Statistics (ONS).
The FRS estimates underpin this publication and Households Below Average Income (HBAI) series, which is the UK’s primary source of poverty estimates. With a larger sample size, it is also the main source on household incomes. HFS data are used to produce ONS’s Household Disposable Income Inequality (HDII) and Effects of Taxes and Benefits (ETB) series, these outputs are the main source for considering the overall financial well-being of households.
The two sources of data are complementary but there are some important methodological differences between them, which means that their income estimates can be different. For example, the FRS focuses on respondents’ weekly incomes at the time of interview, whereas HFS focuses more on annual income. The treatment of pension contributions also differs, with ONS’s estimate of Gross Household Income being calculated before pension contributions. Further details are available in the income and earnings statistics guide.
The ONS interactive tool is an additional resource which can be used to identify sources of statistics on income and earnings, and their key features. Alongside the HDII and ETB series, two other DWP publications which may be of particular interest to users with an interest in income-based poverty are:
- Income Dynamics (ID) which looks at changes in household income including a measure of persistent low income, based on Understanding Society data;
- Children in Low Income Families provides data on the number and proportion of children living in low-income families, Before Housing Costs (BHC), across the United Kingdom by local area
Social Metrics Commission Report
The Social Metrics Commission published their latest report in November 2024. These statistics cover data up to FYE 2023.