Sponsored museums annual performance indicators 2011-12
The data is collected by the museums through sample surveys, with the exception of the information on educational visits and total visits, which are based on actual counts.
Documents
Details
The highlight data for 2011/12
This report contains figures on the following key performance indicators from 17* of the Department’s sponsored museums and galleries.
(* From 2011-12 The performance indicator data for the Museum of Science and Industry in Manchester is included in the figures for the National Museum of Science and Industry (Science Museum Group).)
Total visits by museum: There were 44.5 million visits to 17 of the Department’s sponsored museums in 2011/12, an increase of 1.5% on 2010/11. The following chart shows visit numbers by museum.
Figure 1: Total visits by museum 2010/11 - 2011/12
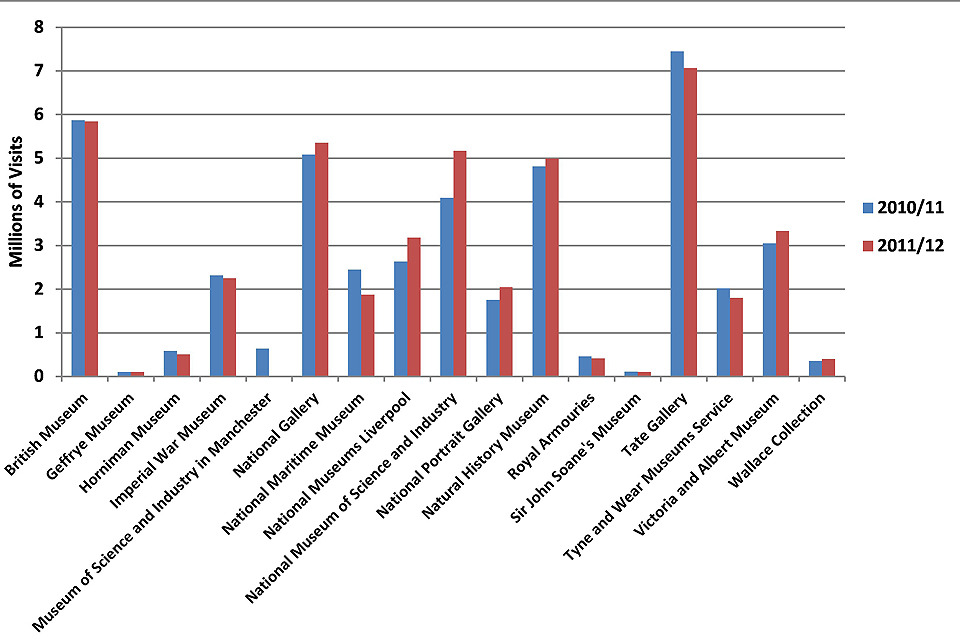
Total visits by museum 2010/11 - 2011/12
Total visit numbers over the last 10 years: The following chart shows total visit numbers for the 17 museums for the last 10 years. Total visits to the 17 museums have increased by 32% between 2002/03 and 2011/12 (from 33.6 million to 44.5 million)
Figure 2: Total number of visits to sponsored museums 2002/03 – 2011/12
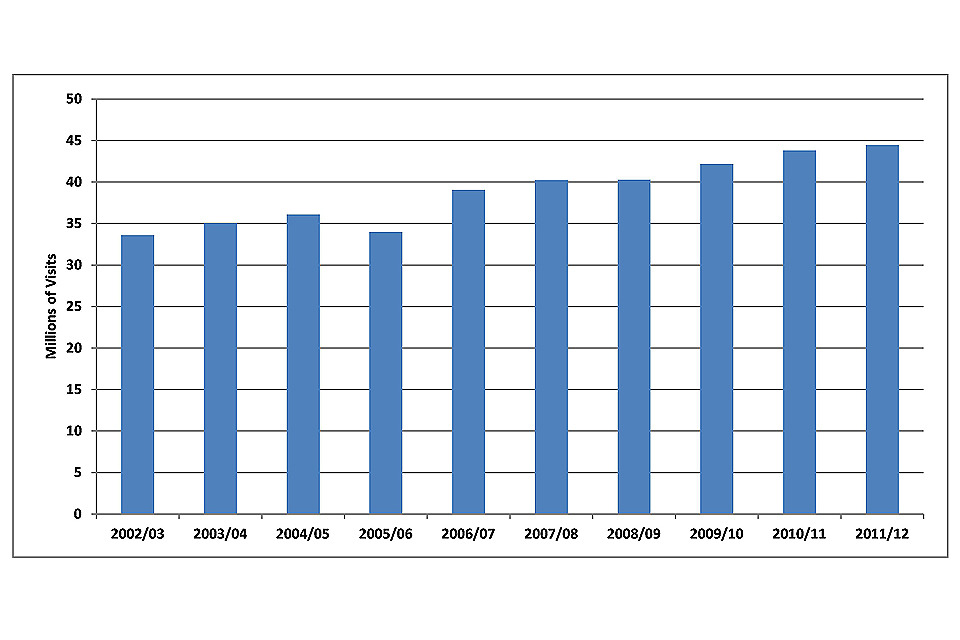
Total number of visits to sponsored museums 2002/03 – 2011/12
Find out further information on visits to museums which previously charged. Child visits: There were 8.8 million visits by children under 16 in 2011/12, an increase of 6% from 2010/11. The following chart shows child visit numbers by museum.
Figure 3: 2011/12 Number of visits by children under 16 by museum
2011/12 Number of visits by children under 16 by museum
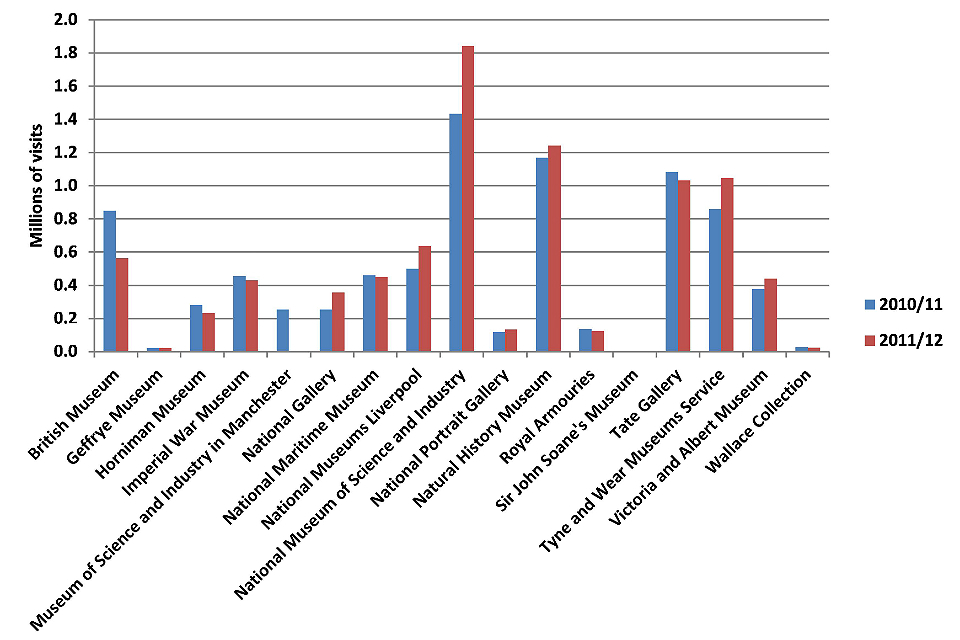
Note: The number of child visits to the Sir John Soane’s Museum is too small compared with the other museums to appear on this figure, these were 3,735 for 2010/11 and 3,848 for 2011/12. Number of educational visits: There were just over 2.0 million facilitated and self-directed visits to the museums/galleries by children under 16 in formal education in 2011/12, an increase of 3% from 2010/11. The following chart shows facilitated and self-directed visit numbers by children under 16 in formal education by museum.
Figure 4: Number of facilitated and self-directed visits to the museum/gallery by children under 16 in formal education 2010/11 - 2011/12

Number of facilitated and self-directed visits to the museum/gallery by children under 16 in formal education 2010/11 - 2011/12
Note: The number of facilitated and self-directed visits to the Sir John Soane’s Museum Museum is too small compared with the other museums to appear on this figure, these were 1,511 for 2010-11 and 1,772 for 2011/12.
Overseas visits: There were 18.8 million visits in 2011/12, representing 42% of all visits.
Figure 5: Percentage of overseas and UK visits in 2010/11 and 2011/12

Percentage of overseas and UK visits in 2010/11

Percentage of overseas and UK visits in 2011/12
Visits by adults from lower socioeconomic groups: There were 3.3 million visits in 2011/12, a decrease of 9% from 2011/12. The following chart shows visit numbers by museum.
Figure 6: Visits by adults aged 16 and over from NS-SEC groups 5-8 by museum in 2011/12

Visits by adults aged 16 and over from NS-SEC groups 5-8 by museum in 2011/12
Pre-release access
The list below details officials who have received privileged early access to this report. In line with best practice, the list has been kept to a minimum and those given access for briefing purposes had a maximum of 24 hours:
- Ed Vaizey, Minister for Culture, Communications and Creative Industries
- Simon Oliver (Press Office, DCMS)
- Paul Maley (Policy, DCMS)
For QA and sign-off
The responsible analyst for this release is Penny Allen. For general enquiries telephone: 020 7211 6000
Due to data issues identified during quality assurance we are delaying the publication of the next release by 2 weeks to Thursday 14th November.