Chapter 5: Productivity
Updated 3 September 2026

© Crown copyright 2026
This publication is licensed under the terms of the Open Government Licence v3.0 except where otherwise stated. To view this licence, visit nationalarchives.gov.uk/doc/open-government-licence/version/3 or write to the Information Policy Team, The National Archives, Kew, London TW9 4DU, or email: psi@nationalarchives.gov.uk.
Where we have identified any third party copyright information you will need to obtain permission from the copyright holders concerned.
This publication is available at https://www.gov.uk/government/statistics/agriculture-in-the-united-kingdom-2025/chapter-5-productivity
Summary
Key results for 2025 compared to 2024:
-
Total Factor Productivity is estimated to have increased by 0.9% between 2024 and 2025. This was driven by an increase in the volume of outputs, offsetting a small increase in the volume of inputs.
-
The volume of all outputs increased by 1.8%, with an increase of 2.7% in total crop output and an increase of 1.5% in total livestock output.
-
The volume of all inputs increased by 0.9%. There was a mixture of increases and decreases in volume across intermediate consumption with an overall increase of 2.3%.
Figure 5.1: Summary of key indices 2024 to 2025 (1973 = 100)
Enquiries: farmaccounts@defra.gov.uk
| Item | 2024 | 2025 |
|---|---|---|
| All outputs | 133.1 | 135.5 |
| All inputs | 87.1 | 87.9 |
| Total Factor Productivity | 152.7 | 154.2 |
Source: Total Factor Productivity of the agricultural industry
Introduction
This chapter presents the estimate of Total Factor Productivity (TFP) of the UK agricultural industry for 2025, also published separately at Total Factor Productivity of the agricultural industry - GOV.UK. It also presents volume indices for inputs and outputs. These figures include updates to the figures published in Agriculture in the United Kingdom 2024 following data updates.
TFP is a measure of how well inputs are converted into outputs, giving an indication of the efficiency and competitiveness of the agricultural industry. Although external factors such as weather conditions or disease outbreaks may have a short-term impact on productivity, it is developments that improve productivity over a longer period that constitute one of the main drivers of agricultural income.
TFP estimates are derived from the aggregate farm accounts data used to calculate UK Total Income from Farming (TIFF) presented in Chapter 4: Accounts.
Long term trends
Figure 5.2: Long term trends in TFP of the UK agricultural industry 1973 to 2025 (1973 = 100)
Enquiries: farmaccounts@defra.gov.uk
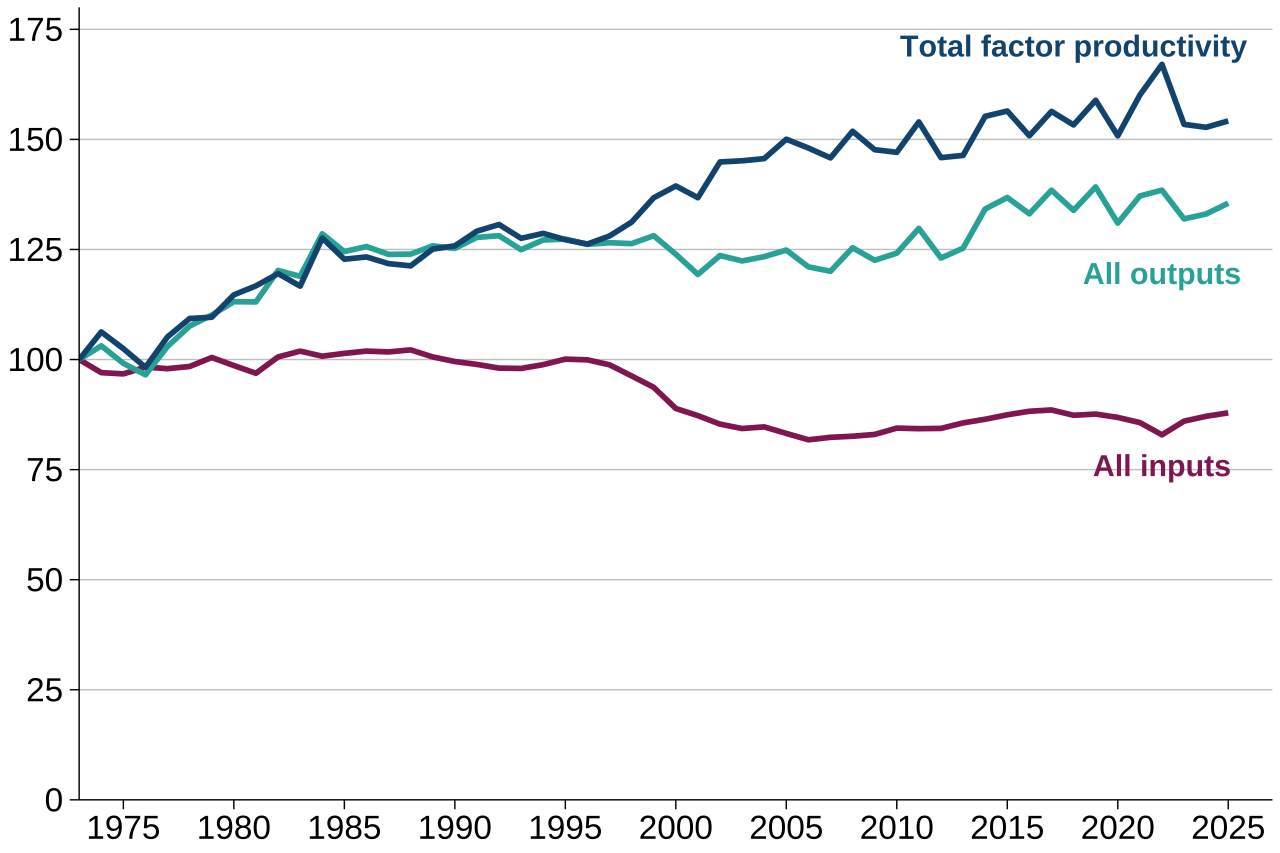
Text description of Figure 5.2: Figure 5.2 is a line chart showing the trend in Total Factor Productivity from 1973 to 2025. The chart is presented as an index (1973 = 100). Data is shown for all inputs, all outputs and Total Factor Productivity.
Source: Total Factor Productivity of the agricultural industry
TFP of the agricultural industry in the United Kingdom increased by 0.9% between 2024 and 2025. This was driven by an increase in the volume of outputs which offset a small increase in the volume of inputs. As shown in Figure 5.2, this continues the pattern of annual fluctuations seen from around the year 2000 onwards. Despite this annual variability, the long-term trend is still one of slow but overall improvement in TFP.
Since the series began in 1973, TFP has increased by 54%, driven by an increase in the volume of all outputs of 36% and a decrease in the volume of all inputs of 12%.
Annual changes, 2024 to 2025
All outputs
‘All outputs’ represents the change in volume (expressed as an index based to 1973) of all outputs sold off the farm, excluding transactions within the agricultural industry. Therefore, gross fixed capital formation of livestock, transactions within the industry e.g. inter/intra farm transfer of wheat, barley etc. and contract work (agricultural services) are excluded from the calculation.
Table 5.1: Volume indices for outputs 2024 to 2025 (1973 = 100)
Enquiries: farmaccounts@defra.gov.uk
| Item | 2024 | 2025 | Annual Change |
|---|---|---|---|
| Output of cereals | 147.5 | 152.2 | 3.2% |
| Output of industrial crops | 203.4 | 198.1 | -2.6% |
| Output of forage plants | 99.3 | 99.3 | 0.0% |
| Output of vegetables and horticultural products | 80.8 | 82.5 | 2.1% |
| Output of potatoes | 92.4 | 100.5 | 8.7% |
| Output of fruit | 85.2 | 86.2 | 1.2% |
| Output of other crop products | 120.4 | 117.6 | -2.3% |
| Total crop output | 129.2 | 132.8 | 2.7% |
| Output of livestock (meat) | 129.0 | 127.9 | -0.9% |
| Output of livestock products | 110.8 | 116.5 | 5.1% |
| Total livestock output | 121.9 | 123.7 | 1.5% |
| Diversification | 636.5 | 640.4 | 0.6% |
| All outputs | 133.1 | 135.5 | 1.8% |
Notes
- Potato prices and yield information were previously obtained from the AHDB who stopped producing data midway through 2021. From 2022 we have estimated yields based on input from sector representatives, devolved administrations and coverage of the sector in the farming press.
Source: Total Factor Productivity of the agricultural industry
The volume of all outputs increased by 1.8% between 2024 and 2025. This was the result of an increase in both total livestock output (+1.5%) and total crop output (+2.7%) volumes.
The biggest change within total livestock output was in the output of livestock products, which increased by 5.1%. This was driven by increases in the volumes of milk and eggs (+5.6% and +4.9% respectively). Both items saw increases in prices in 2025 with farmgate milk prices increasing by 6.8% to 44 pence per litre and UK egg packer to producer prices increasing by 2.2% to 148 pence per dozen. Higher prices and low feed costs contributed to an increase in production in both commodities, as producers responded to improved margins. Milk production for human consumption increased by 5.0% to 15.8 billion litres and eggs for human consumption increased by 5.2% to 1.1 billion dozen.
The largest volume increase in total crop output was output of potatoes which increased by 8.7%. After a poor harvest and high prices in 2024, the UK area of potatoes in June increased by 7.2% to 127 thousand hectares, increasing production in 2025. The second largest volume increase was in output of cereals, driven by a 12% increase in the output volume of wheat. In 2025, the UK area of wheat in June increased by 9.1% to 1.7 million hectares, which increased production by 7.3% to 12.0 million tonnes despite a 1.7% decrease in yields.
Inputs
‘All inputs and entrepreneurial labour’ represents the change in volume (expressed as an index based to 1973) of all goods and services purchased and consumed, excluding transactions within the agricultural industry.
Table 5.2: Volume indices for inputs 2024 to 2025 (1973 = 100)
Enquiries: farmaccounts@defra.gov.uk
| Item | 2024 | 2025 | Annual Change |
|---|---|---|---|
| Seeds | 137.3 | 141.3 | 2.9% |
| Energy | 50.1 | 50.4 | 0.5% |
| Fertilisers | 72.0 | 68.7 | -4.6% |
| Plant protection products | 295.5 | 303.6 | 2.7% |
| Veterinary expenses | 128.1 | 127.1 | -0.8% |
| Animal feed | 134.2 | 141.9 | 5.7% |
| Total maintenance | 56.0 | 56.0 | -0.1% |
| Bank charges | 100.0 | 100.0 | 0.0% |
| Other goods and services | 139.8 | 143.8 | 2.8% |
| Intermediate consumption | 106.8 | 109.2 | 2.3% |
| Consumption of fixed capital | 126.5 | 126.6 | 0.1% |
| All labour | 50.3 | 49.8 | -1.1% |
| Land | 94.7 | 95.0 | 0.4% |
| All inputs and entrepreneurial labour | 87.1 | 87.9 | 0.9% |
Notes
- Bank charges has replaced the name of the item FISIM (Financial Intermediary Services Indirectly Measured) for clarity following feedback on our statistical release.
Source: Total Factor Productivity of the agricultural industry
The volume of all inputs and entrepreneurial labour increased by 0.9% between 2024 and 2025. This increase was driven by increases in animal feed (+5.7%), seeds (+2.9%) and plant protection products (+2.7%) that, together with other smaller increases, offset the 4.6% decrease in fertilisers.
Animal feed includes compound animal feed and straight animal feed. In 2025, the total volume of animal feed increased by 5.7% from 2024, driven by rises in both compound feed (+2.4%) and straight feed (+14%) volumes. Strong demand from the cattle and sheep sectors drove increased volumes of feed due to high milk, beef and lamb commodity prices and increased milk production.
The volume of seeds used in a year is influenced by planting timing and conditions and crop areas. In 2025 the volume of seeds increased 2.9%, driven by increases in the UK areas of arable crops at June such as wheat (+9.1%), oats (+8.8%) and potatoes (+7.2%), as well as vegetables grown outdoors (+6.7%).
In 2025, the volume of plant protection products increased by 2.7% in response to increases in the UK June areas of wheat and potatoes, despite the dry weather in spring and summer reducing overall disease and pest pressure.
The volume of fertilisers purchased decreased by 4.6% in 2025, attributed to farmers adjusting buying patterns in response to price rises. In 2025 the annual price index for fertilisers increased by 11%, following falls in 2023 and 2024 from the highs seen in 2022. However, it should be noted that many farmers forward-buy fertiliser on contract, and purchasing patterns are not necessarily indicative of usage patterns in the same year.
Partial productivity
Partial productivity shows the impact key inputs have on productivity. It measures total outputs against a part of the inputs.
Table 5.3: Partial factor productivity 2024 to 2025 (1973 = 100)
Enquiries: farmaccounts@defra.gov.uk
| Item | 2024 | 2025 | Annual Change |
|---|---|---|---|
| Productivity by intermediate consumption | 124.6 | 124.1 | -0.5% |
| Productivity by capital consumption | 105.2 | 107.1 | 1.8% |
| Productivity by labour | 264.4 | 272.2 | 3.0% |
| Productivity by land | 140.6 | 142.6 | 1.5% |
Source: Total Factor Productivity of the agricultural industry
Figure 5.3: Long term trends in partial productivity indicators 1973 to 2025 (1973 = 100)
Enquiries: farmaccounts@defra.gov.uk
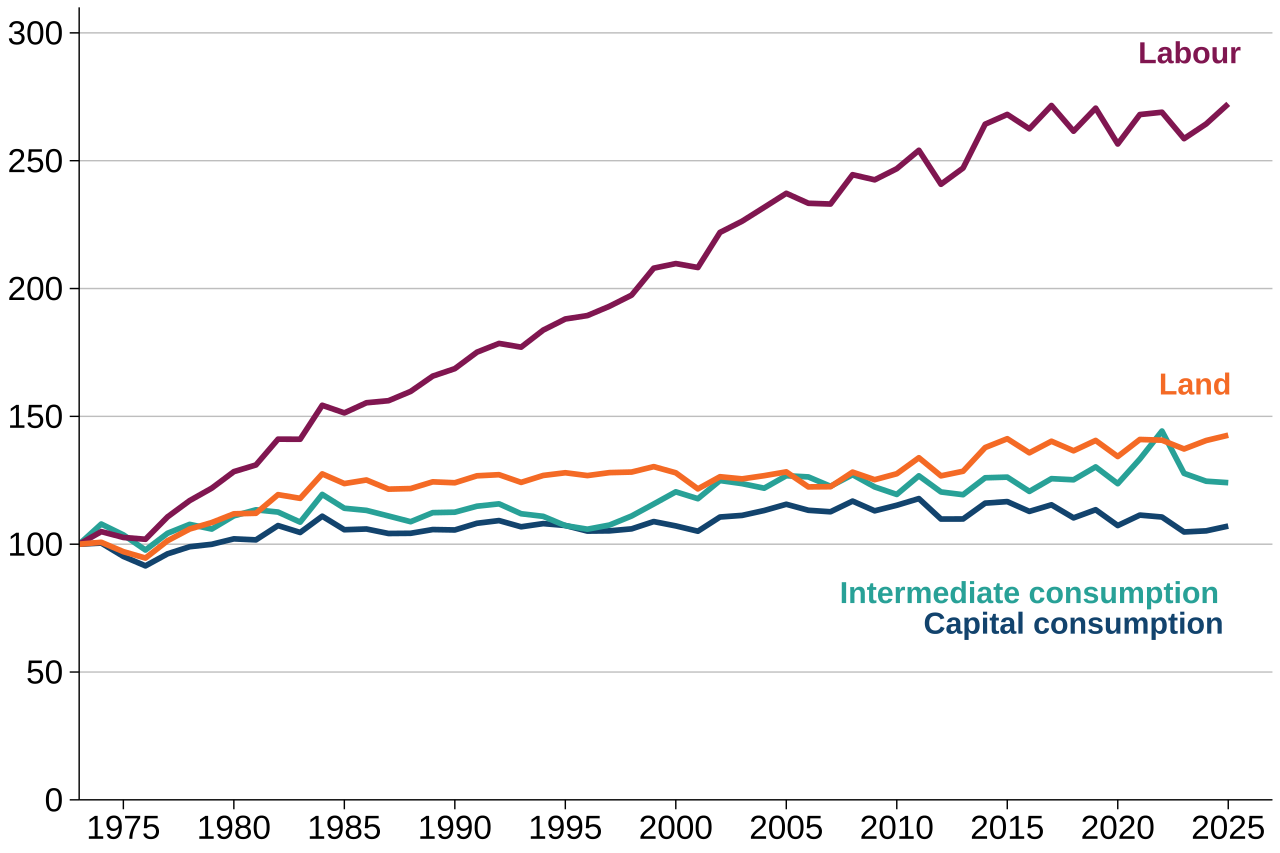
Text description of Figure 5.3: Figure 5.3 is a line chart showing the long term trend in partial productivity indicators from 1973 to 2025. The chart is presented as an index (1973 = 100). Data is shown for labour, land, intermediate consumption and capital consumption.
Source: Total Factor Productivity of the agricultural industry
Table 5.3 and Figure 5.3 show that labour is the key input driving productivity gains. Productivity by labour shows a steady increase over the whole period since 1973. Labour volumes are now approximately half of what they were in 1973. However, more recent growth in labour productivity is due to increased output rather than a reduction in labour volume.
Revisions
Figures for 2025 are provisional and subject to revision.
As a result of more data becoming available over time there have been minor revisions to earlier years in this release. These revisions are intended to enhance the precision of these estimates. Sometimes additional revisions are necessary to refine the methodology or correct historical errors.
There have been small changes to data from 2010 - 2024 as published in Agriculture in the United Kingdom 2024. This is as result of minor methodological changes which have been made to streamline our data processing. TFP, as outlined elsewhere in this release, is primarily focused on trends and these methodological changes have not impacted the trend in TFP from 2010, which has been one of increased productivity.