Adult social care workforce survey: December 2021 report
Published 17 December 2021
Applies to England

© Crown copyright 2021
This publication is licensed under the terms of the Open Government Licence v3.0 except where otherwise stated. To view this licence, visit nationalarchives.gov.uk/doc/open-government-licence/version/3 or write to the Information Policy Team, The National Archives, Kew, London TW9 4DU, or email: psi@nationalarchives.gov.uk.
Where we have identified any third party copyright information you will need to obtain permission from the copyright holders concerned.
This publication is available at https://www.gov.uk/government/statistics/adult-social-care-workforce-survey-december-2021/adult-social-care-workforce-survey-december-2021-report
This report documents key findings from the responses collected from almost 9,000 adult social care settings in England through the workforce survey. This represents a response rate of 27% of all Care Quality Commission (CQC)-registered care homes and 44% of all CQC-registered domiciliary care providers.
Most respondents to the survey reported an increase in challenges in the 4 key areas of recruiting staff, retaining staff, morale and accessing agency staff, over the last 6 months.
The positions reported as being hard to recruit were also reported as hard to retain. For domiciliary care providers the role most commonly reported as challenging to recruit and to retain was ‘personal assistant or home care worker’. For care homes this was ‘senior care worker’.
The main reason given for these shortages is that respondents feel pay and working conditions in the care sector are uncompetitive, when compared to outside sectors. Vaccination as a condition of deployment was also cited as a potential issue for care homes.
Introduction
The workforce survey was a voluntary survey completed by CQC-registered care homes and domiciliary care providers via the Capacity Tracker. It ran for a month from 13 September 2021 to 14 October 2021 and aimed to gain insight into the scale of workforce challenges and specific areas of concern.
For more details on the Capacity Tracker data collection and the methodology for the monthly statistics please see adult social care in England statistics: background quality and methodology
This is being published as an ad-hoc analysis as part of the Department of Health and Social Care (DHSC) monthly statistics for adult social care (England). This is a collection that provides a monthly overview on a range of information on social care settings, including care home staffing ratios. Data for both this publication and the regular monthly statistics are taken from Capacity Tracker.
In total, 8,941 settings responded to the survey, of which 4,051 were care homes and 4,440 were domiciliary care providers. This represents a response rate of 27% of all CQC-registered care homes and 44% of all CQC-registered domiciliary care providers.
These statistics cover newly published information regarding respondents’ views on:
- retaining staff
- recruiting staff
- maintaining staff morale
- accessing agency staff
- assistance from government
Data tables summarising results from this survey can be found in the spreadsheet accompanying this publication, with data split by care type. A regional breakdown is provided for the 4 summary questions that begin each section.
For more information and links to other published sources of adult social care data please see the ‘About this data’ section below.
The overall situation
Respondents were asked “Compared to April 2021, how would you describe the current level of workforce challenges in your service or location for…?”
- retaining staff
- recruiting staff
- maintaining staff morale
- accessing agency staff
These questions were the first question for each of the 4 sections. Results are summarised in table 1 below. The most challenging area reported by respondents was recruiting staff, which was reported to be more challenging than in April 2021 by 81.9% of non-N/A respondents.
Table 1: responses to “Compared to April 2021, how would you describe the current level of workforce challenges in your service or location for…?”
| Question | More challenging | About the same | Less challenging | Response rate (with number) |
|---|---|---|---|---|
| Retaining staff | 70.3% | 25.0% | 4.5% | 98% (8765) |
| Recruiting staff | 81.9% | 15.1% | 2.5% | 97% (8677) |
| Maintaining morale | 70.6% | 24.5% | 4.4% | 98% (8735) |
| Accessing agency staff | 77.9% | 16.6% | 2.4% | 58% (5238) |
Totals may not add up to 100% as answers of ‘unsure’ and ‘don’t know’ have been omitted. Full breakdowns are available in sheets 1.1, 2.1, 3.1 and 4.1 of the accompanying workforce survey data tables.
Retention
70.3% of non-N/A respondents reported that retaining staff was more challenging than April 2021. 25.0% reported that it was about the same and 4.5% reported this was less challenging than April 2021 (table 1). At a regional level, the results were as follows.
Table 2: responses to “Compared to April 2021, how would you describe the current level of workforce challenges in your service or location for retaining staff?” by region
| Region | More challenging |
|---|---|
| East of England | 70.9% |
| London | 56.0% |
| Midlands | 70.3% |
| Yorkshire and the North East | 70.5% |
| North West | 69.5% |
| South West | 76.7% |
| South East | 72.4% |
Data from sheet R1 of the accompanying workforce survey data tables.
Respondents were asked about the reasons for increased staff retention challenges, for this question respondents could select one reason as a response.
Amongst care homes, the top 3 reasons believed to be the main cause of staff leaving were:
- better pay outside of the care sector (25.9%)
- do not wish to be vaccinated (14.7%)
- better hours and working conditions outside the care sector (13.4%)
Amongst domiciliary care providers, the top 3 reasons believed to be the main cause of staff leaving were:
- better pay outside of the care sector (29.1%)
- better hours and working conditions outside the care sector (11.5%)
- feeling burnt out/stress (10.2%)
The response of ‘less pressurised role’ implies that staff wanted to move to a less pressurised role. It was mentioned that the responsibility associated with care work resulted in high levels of pressure for staff.
Figure 1: responses to “What do you believe is the main cause for staff leaving?”
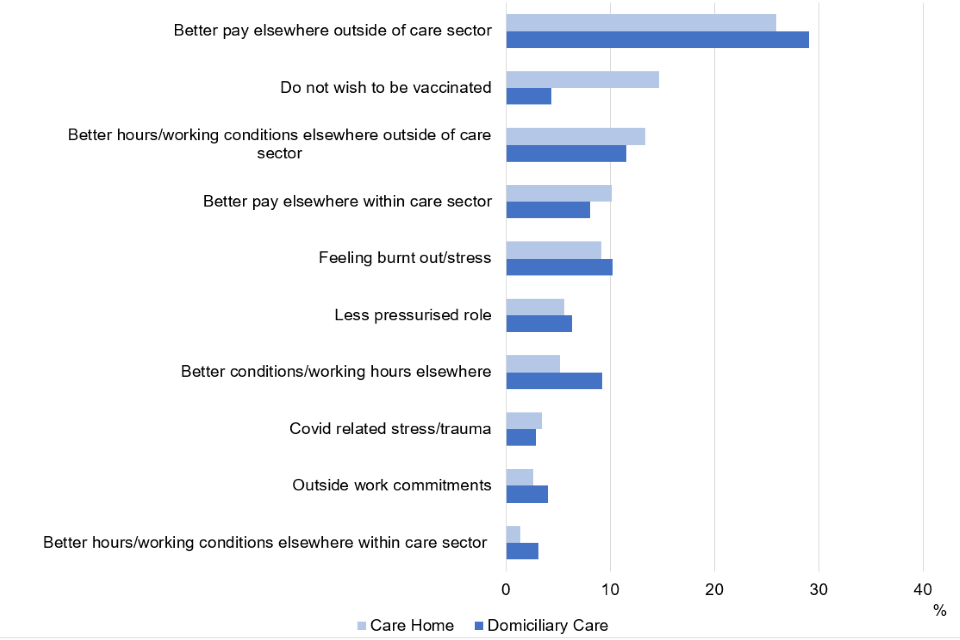
Respondents select one response. 86% response rate (7,677). Selected data from sheet 1.3 of data tables, low percentage response have been omitted to enable clear presentation.
The orders of popularity of results were broadly similar when respondents could select all responses which they felt were applicable (available in sheet 1.2 of the accompanying workforce survey data tables).
Respondents were also asked if there were certain roles in which staff retention was especially difficult. For this question respondents could select all roles they felt were applicable.
The most commonly reported role which care homes were finding particularly hard to retain was ‘senior care worker’, 50.6% of care homes selected this role as one of their responses. General and nursing care workers and registered nurses were also highly reported as being challenging to retain.
The most commonly reported role which domiciliary care providers were finding particularly hard to retain was ‘personal assistant and senior care worker’, with 68.7% of domiciliary care providers selecting this role as one of their answers senior care workers and support and outreach staff were also commonly reported as particularly challenging to retain.
Figure 2: responses to “Are there specific roles that are harder to retain? If so, which roles?
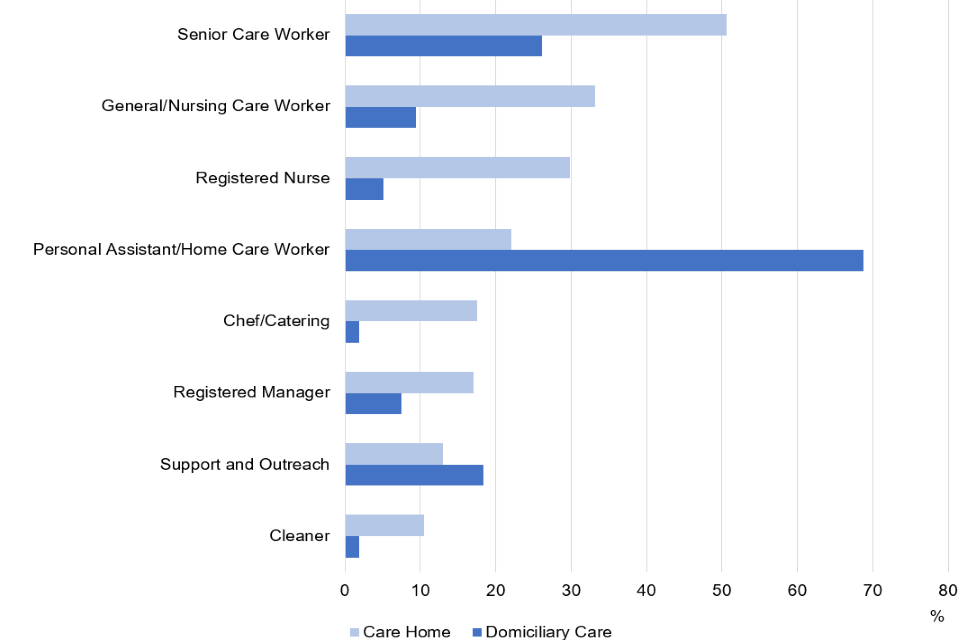
Respondents select all responses that apply. Percentage is the percentage of respondents who reported the issue as one of their responses. 84% response rate (7,492). Data from sheet 1.4 of the accompanying workforce survey data tables. Responses with less than 10% for both care types are omitted.
Recruitment
81.9% of non-N/A respondents reported that recruiting staff was more challenging than April 2021; 15.1% reported that it was about the same; and 2.5% reported this was less challenging than April 2021 (table 1). At a regional level, the results were as follows.
Table 3: responses to “Compared to April 2021, how would you describe the current level of workforce challenges in your service or location for recruiting staff?” by region
| Region | More challenging |
|---|---|
| East of England | 82.9% |
| London | 68.0% |
| Midlands | 81.4% |
| Yorkshire and the North East | 82.5% |
| North West | 81.3% |
| South West | 89.5% |
| South East | 82.9% |
Data from sheet R2 of the accompanying workforce survey data tables
Respondents were asked about the number and the quality of applications they had received recently. The majority of respondents said that both the number and quality of applicants were lower or much lower than in April 2021.These results were comparable across both care types and are shown below in figure 3. A full breakdown is available in sheets 2.2 and 2.3 of the workforce survey data tables.
Figure 3: responses to “If you are recruiting, compared to April 2021, how do the number and quality of applications compare?” – weighted average of care homes and domiciliary care providers
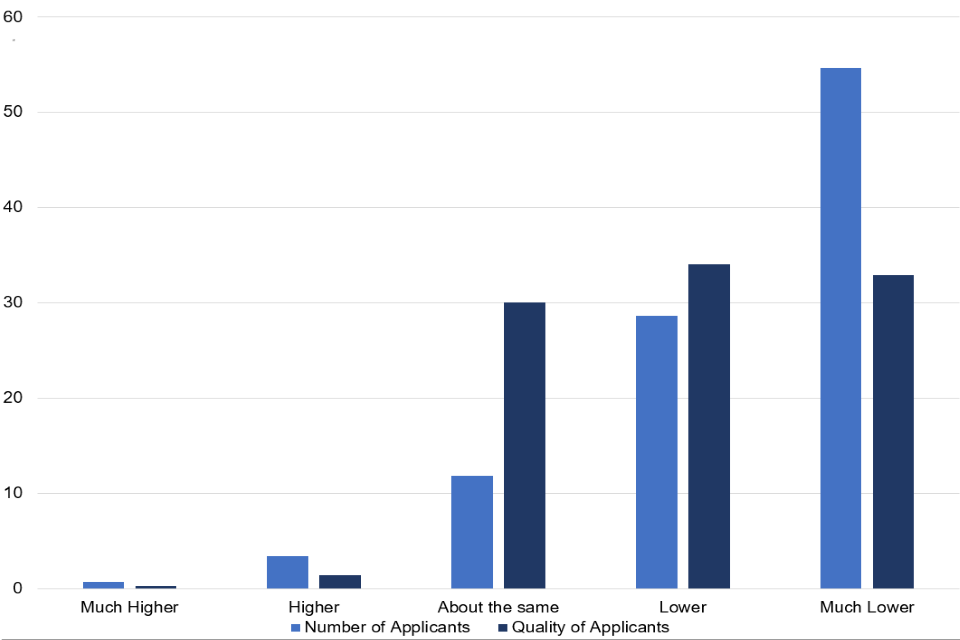
Respondents select one response. Both questions had a 95% response rate (8,524 and 8,495). Number of applicants responses from workforce survey data table section 2.2. Quality of applicants responses from the accompanying workforce survey data table, sheet 2.3.
Respondents were asked if there were specific roles which it was difficult to recruit for. This broadly matched the results in the previous section on difficult to retain roles.
Again, the most commonly reported role which care homes were finding particularly hard to recruit for was ‘senior care worker’, 51.5% of care homes selected this role as one of their responses. This was followed by ‘general and nursing care worker’ and ‘registered nurse’.
The most commonly reported role which domiciliary care providers were finding particularly hard to recruit for was again ‘personal assistant/home care worker’, 70.3% of domiciliary care providers selected this role as one of their responses. After this the highest reported roles were again ‘senior care worker’ and ‘support and outreach’. This question allowed respondents to select all roles which were applicable. The full breakdown of hard to recruit roles is in accompanying workforce survey data table sheet 2.4.
Staff morale
70.6% of non-N/A respondents reported that maintaining staff morale was more challenging than April 2021; 24.5% reported that it was about the same; and 4.4% reported this was less challenging than April 2021, with the morale situation being marginally worse for care homes (table 1). At a regional level, the results were as shown below in table 4.
Table 4: responses to “Compared to April 2021, how would you describe the current level of workforce challenges in your service or location for maintaining morale?” by region
| Region | More challenging |
|---|---|
| East of England | 68.6% |
| London | 58.2% |
| Midlands | 70.3% |
| Yorkshire and the North East | 71.1% |
| North West | 72.3% |
| South West | 79.1% |
| South East | 70.5% |
Data available from sheet R3 of the accompanying workforce survey data tables.
Respondents were asked about the current level of challenges in maintaining morale and the consequences of a more challenging morale situation.
The main reported consequences for both care homes and domiciliary care providers were ‘Staff not willing or able to take on additional hours’, ‘Staff less energised or aren’t able to do more’, and ‘Staff indicating thinking of leaving’.
Table 5: responses to “What are the main consequences of a more challenging morale situation?”
| Response | Care home | Domiciliary care |
|---|---|---|
| Staff not willing or able to take on additional hours | 30.0% | 38.1% |
| Staff less energised or aren’t able to do more | 22.6% | 19.6% |
| Staff indicating thinking of leaving | 21.6% | 17.3% |
| Staff not willing or able to take on additional responsibilities | 5.6% | 5.9% |
| Staff wellbeing worries | 15.8% | 14.8% |
Respondents select one response. 85% response rate (7,599). Totals may not add to 100% as responses of ‘unsure’ or ‘don’t know’ have been omitted. Full data available in sheet 3.3 of the accompanying workforce survey data tables.
Accessing agency staff
For questions on accessing agency staff, over half of all responses were ‘N/A’, indicating that the respondent was not utilising agency staff, or that they were not using agency staff in April 2021, and therefore have nothing to compare against.
77.9% of respondents who did not put ‘N/A’ reported that accessing agency staff was more challenging than April 2021; 16.6% reported that it was about the same; and 2.4% reported this was less challenging than April 2021 (table 1). Agency staff issues were generally reported as higher in care homes over domiciliary care.
Respondents were also asked for the frequency of use of agency staff and the specific challenges care settings were facing when using agency staff. At a regional level, the results were as shown below in table 6.
Table 6: responses to “Compared to April 2021, how would you describe the current level of workforce challenges in your service or location for accessing agency staff?” by region
| Region | More challenging |
|---|---|
| East of England | 76.7% |
| London | 57.3% |
| Midlands | 75.4% |
| Yorkshire and the North East | 81.7% |
| North West | 77.6% |
| South West | 87.9% |
| South East | 81.4% |
Data is available in sheet R4 of the accompanying workforce survey data tables.
Figure 4: responses to “If you are using agency staff, compared to April 2021, how frequently are you using them?” – weighted average of care homes and domiciliary care providers
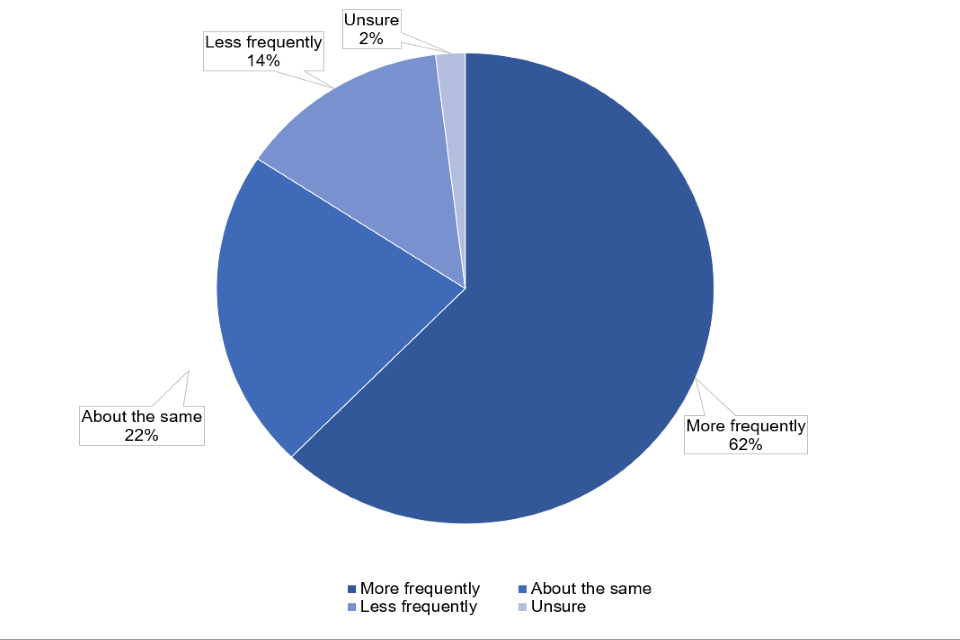
Respondents select one response. 44% response rate (3,816). Data from sheet 4.2 of the accompanying workforce survey data tables.
Survey respondents were asked about specific challenges they faced when using agency staff. Domiciliary care providers reported finding agency staff more expensive as the main issue, whereas care homes found that having to call multiple agencies was the biggest problem. A full breakdown of this question is available in sheet 4.4 of the accompanying workforce survey data tables.
Assistance from government
The survey included a single question asking all respondents which form of government assistance with recruitment or staffing they would find the most useful. For this question respondents could select all options that applied to them. From the 11 options given, the highest reported options were as follows:
- better recognition of the sector by government (70.9%)
- add all care workers to skills shortage list (46.2%)
- speed up recruitment process (41.0%)
These results are for both domiciliary care providers and care homes. A full breakdown, including by care type, is available in sheet 5.1 in the accompanying workforce survey data tables.
Free text analysis: government assistance
The survey enabled respondents to provide a free text answer to the question “What form of government assistance with recruitment or staffing would you find the most useful?” – this gave 360 distinct responses.
A final free-text question asked respondents “Do you have any significant issues with workforce capacity that you feel have not been covered in the above answers?” – this gave 1,990 distinct answers.
The most basic form of free text response analysis involves a term count. The term frequency of some of the most common words is shown below.
Due to the low sample number only term count and bigram analysis have been considered appropriate and have been carried out on the free text responses.
Prior to analysis responses were cleaned to remove duplicate responses, stopwords such as ‘is’, ‘a’ and ‘the’, and words which would appear often but would not add to the analysis such as ‘care’ and ‘staff’. This was done to increase the usefulness of the results of analysis. These curated wordcount lists were used for both term frequency and bigram analysis.
For the question “What form of government assistance with recruitment or staffing would you find the most useful?”, only 360 distinct free text responses were provided. As a result, only a term count is provided for this question.
Table 3: frequency of most common words in the analysis of the 360 distinct free text responses to “What form of government assistance with recruitment or staffing would you find the most useful?”
| Rank | Word | Frequency |
|---|---|---|
| 1 | pay | 213 |
| 2 | better | 85 |
| 3 | can | 67 |
| 4 | sector | 64 |
| 5 | work | 59 |
| 6 | increase | 56 |
| 7 | funding | 49 |
From 360 distinct responses, the word ‘pay’ is mentioned 213 times. This does not include mentions of words with same meaning as pay, such as ‘wages’ (30 mentions) or ‘paid’ (28 mentions). This serves to highlight the prominence of pay rates as a reported issue.
Free text analysis: any other issues not mentioned
The terms with a frequency of over 100 are shown below in this wordcloud. The size of the word related to the frequency of the term.
Due to the nature of the question, words seen in this cloud can be thought of as representing an issue that respondents are facing.
Again, ‘pay’ can be seen to be a highly mentioned issue. It can also be noted that both ‘COVID’ and ‘pandemic’ individually appear in this cloud. Comparisons with the NHS were somewhat frequent as was the mention of recognition.
Figure 5: a wordcloud of some of the terms mentioned most frequently in response to the question “Do you have any significant issues with workforce capacity that you feel have not been covered in the above answers?”

A ‘bigram’ is a string of 2 words. For example, ‘social care’, and ‘care staff’ are both bigrams. Bigrams can be used to provide context for the most used words following frequency analysis. By providing the words most used in conjunction with each other, more insight can be gained. Following this the most common bigrams, from the curated wordlist used above.
Table 4: most common bigrams in the analysis of the 1990 distinct free text responses to “Do you have any significant issues with workforce capacity that you feel have not been covered in the above answers?”
| Rank | Word 1 | Word 2 |
|---|---|---|
| 1 | Local | Authority |
| 2 | Better | Pay |
| 3 | Support | Workers |
| 4 | Hourly | Rate |
| 5 | Service | Users |
| 6 | Minimum | Wage |
| 7 | Per | Hour |
| 8 | COVID | 19 |
| 9 | Low | Pay |
| 10 | Can | Pay |
About this data
These statistics are being published as a part of a wider landscape of statistics on adult social care. The Government Statistical Service (GSS) compiles a UK adult social care database of official statistics on adult social care across the 4 nations of the UK. This is updated on a monthly basis.
The UK Statistics Authority (UKSA) conducted a review of adult social care statistics in England which called for:
- better leadership and collaboration across different organisations publishing official statistics. This publication has been produced in collaboration with other statistics providers of COVID-19 adult social care data and DHSC will endeavour to work with various stakeholders as more data is published through this publication
- addressing of gaps in available data, particularly in privately funded care. This bulletin aims to plug some of that gap by including data on residents privately funding their care in addition to those funded by local authorities
- improving existing official statistics. These statistics are being badged as experimental statistics and more data will be added iteratively based on user needs
Other sources of adult social care COVID-19 data
These statistics are being published as a part of a wider landscape of statistics on adult social care. The GSS compiles a UK adult social care database of official statistics on adult social care across the four nations of the UK. This is updated monthly.
DHSC adult social care statistics
This report is being published as part of the DHSC in adult social care settings, which provides insight into how COVID-19 has impacted the social care sector and its response to the pandemic.
Data for both this publication and the adult social care statistics are taken from the Capacity Tracker.
The adult social care statistics include some data on care home staffing levels. In order to measure the workforce pressures on providers during the pandemic, each provider is asked to assess their workforce pressures based on their agreed staffing ratios.
The workforce survey complements the regular collection by providing the opportunity to have a deeper exploration of workforce issues which is possible in an ad-hoc survey but would be too burdensome for the regular collection.
Skills for Care
Skills for Care publish a range of workforce intelligence regarding adult social care in England.
This includes the annual state of the workforce report which provides an analysis of the adult social care workforce in England and the characteristics of those working in it.
Skills for care also publish monthly tracking information for key workforce measures relevant to the COVID-19 pandemic, including total staff, vacancies, occupancy rates and sickness.
Feedback
For feedback and any further questions, please contact asc.statistics@dhsc.gov.uk.