Abstract of DWP benefit rate statistics 2020
Published 26 January 2021
Applies to England, Scotland and Wales

© Crown copyright 2021
This publication is licensed under the terms of the Open Government Licence v3.0 except where otherwise stated. To view this licence, visit nationalarchives.gov.uk/doc/open-government-licence/version/3 or write to the Information Policy Team, The National Archives, Kew, London TW9 4DU, or email: psi@nationalarchives.gov.uk.
Where we have identified any third party copyright information you will need to obtain permission from the copyright holders concerned.
This publication is available at https://www.gov.uk/government/statistics/abstract-of-dwp-benefit-rate-statistics-2020/abstract-of-dwp-benefit-rate-statistics-2020
The latest release of these statistics can be found in the Abstract of DWP benefit rate statistics collection.
1. Summary
The Abstract of DWP benefit rates statistics is an annual publication produced by the Department for Work and Pensions (DWP). The purpose of the publication and data tables is to provide a reference source for people who are interested in:
-
benefit up-rating
-
the value of benefits compared to prices and earnings
The aim is to provide answers to questions like:
- how does the value of state benefits compare to prices?
- are state benefits worth more or less today compared to previous years, in terms of average earnings?
2. Key findings
In April 2020, most working age benefit rates were raised by 1.7% in line with the Consumer Prices Index.
Universal Credit standard allowances have since been temporarily raised by the Social Security (Coronavirus) (Further Measures) Regulations.
Both the Basic and New State Pensions were uprated in line with the Triple lock commitment. The basis of the increase in 2020 was earnings growth of 3.9%.
Pension Credit was also uprated by 3.9%.
3. Benefit up-rating
This section explains policy changes and highlights the factors involved in benefits up-rating from 1974 until 2019. Benefits have been uprated by a variety of methods during this period, including:
- forecasts
- indices of prices and earnings
- one-off payments
- targeting of particular components of a benefit
- revisions to the eligibility rules governing the benefit
Price inflation and earnings growth indices in benefit up-rating since 1974
Over time, there have been various changes to the components of the indices that have been used to uprate benefits. The major changes have been:
In 1974 long-term benefits such as pensions and long-term sick and disabled benefits were linked to the higher of one of two annual increases, as measured by the Retail Prices Index (RPI) and the Average Earnings Index.
In 1976 a forecast was used to estimate the movements in price inflation and earnings growth.
Long-term benefits were linked to the prices index only in 1979.
A historical basis was used to calculate the price increases in 1983. ROSSI was introduced in 1983, calculated as RPI (all items) less housing costs, to uprate income-related benefits.
In 1992 the definition of ROSSI changed to New ROSSI which is calculated as RPI (all items) less rent, local taxes and mortgage interest payments.
Since 1983 benefits have been uprated in relation to the RPI, ROSSI or New ROSSI. The actual increase in particular benefits depends on the index applied and on policy decisions as to the appropriate rate for the benefit.
In 2010 the Chancellor announced that from April 2011 most DWP administered benefits would be uprated in line with the Consumer Prices Index (CPI). Also, the government reiterated previous commitments to restore the link between earnings and the up-rating of the Basic State Pension. The government has since applied a ‘Triple lock’ guarantee: that the Basic State Pension will increase by the highest of the growth in average earnings, price inflation or 2.5%. To date, the earnings measure used by the Triple lock calculation has been Average Weekly Earnings (AWE).
Up-rating of State Pension under the Triple lock guarantee since April 2011
| Year | Up-rating percentage | Basis for up-rating |
|---|---|---|
| April 2011 | 4.6% | Price Inflation (RPI) |
| April 2012 | 5.2% | Price Inflation (CPI) |
| April 2013 | 2.5% | 2.5% Minimum |
| April 2014 | 2.7% | Price Inflation (CPI) |
| April 2015 | 2.5% | 2.5% Minimum |
| April 2016 | 2.9% | Earnings Growth |
| April 2017 | 2.5% | 2.5% Minimum |
| April 2018 | 3.0% | Price Inflation (CPI) |
| April 2019 | 2.6% | Earnings Growth |
| April 2020 | 3.9% | Earnings Growth |
Source: Abstract of DWP benefit rate statistics
The new State Pension (nSP) was introduced on 6 April 2016 for people reaching State Pension Age (SPA) from that date. People who had already reached SPA continued to be entitled to the Basic State Pension and Additional State Pension, where applicable. There are transitional arrangements in place to ensure that the amount of state pension an eligible individual receives is not less than under the previous system, based on their National Insurance record to 5 April 2016. The nSP (excluding Protected Payments) is required by statute to rise in line with average growth in earnings. nSP is also currently subject to the Triple lock commitment.
For people who reached SPA before 6 April 2016, Pension Credit has 2 elements:
- the Guarantee Credit, which provides a minimum level of income
- the Savings Credit, which aims to provide an additional amount for people aged 65 and over who have made some provision for their retirement
The Savings Credit element was removed for people reaching SPA from 6 April 2016 when nSP was introduced.
Legislation requires the Standard Minimum Guarantee (SMG) in Guarantee Credit to be uprated at least in line with earnings. Between 2016 and 2019, the SMG has risen at least in line with earnings and in 2020 went up by 3.9%.
Since April 2011, benefits to meet the additional costs of disability were increased in line with CPI price inflation, as were most discretionary benefits and tax credits for working age people.
Between 2013 and 2015, most discretionary benefits and tax credits for working age people were increased by 1% each year.
Under the Welfare Reform and Work Act 2016, most discretionary benefits and tax credits for working age people were frozen at the April 2015 rates for four years. When the Benefit Freeze ended in April 2020, the benefits were raised by 1.7%, in line with CPI price inflation.
See the data tables (table 4.0) for historical values of inflation and earning measures used for up-rating.
Coronavirus (COVID-19) pandemic and other impacts
The key impact of the coronavirus (COVID-19) pandemic on 2020 benefit rates has been a temporary increase applied to Universal Credit standard allowance above the initial Up-rating Order. Please see Social Security (Coronavirus) (Further Measures) Regulations 2020.
Rates of Universal Credit standard allowance for 2020
| Standard Allowance | Monthly Rate set by initial Social Security Benefits Up-rating Order 2020 | Temporary Monthly Rate as set by Further Measures |
|---|---|---|
| Single claimant aged under 25 | £256.05 | £342.72 |
| Single claimant aged 25 or over | £323.22 | £409.89 |
| Joint claimants both aged under 25 | £401.92 | £488.59 |
| Joint claimants where either is aged 25 or over | £507.37 | £594.04 |
Source: Social Security (Coronavirus) (Further Measures) Regulations 2020
The coronavirus (COVID-19) pandemic has also affected the ONS’ ability to capture survey data used in its indices. The furlough scheme has also suppressed the level of earnings growth as at April. The ONS has set out the impact of this on their inflation and earnings statistics.
For their price indices reference please see section 3 of Coronavirus and the effects on UK prices.
For the earnings data please see section 6 of Employee earnings in the UK: 2020.
4. The value of benefits compared to price inflation and earnings growth
Rates of the principal benefits for each up-rating can be found in the accompanying Excel data tables at the Abstract of DWP benefit rate statistics page.
The accompanying data tables show:
- the rate of the benefit at each up-rating date
- the percentage increase since the previous up-rating
- the percentage increase in prices between up-rating periods
- the value of the benefit at April 2020 prices at the date of up-rating
- its average value at April 2020 prices over the period between up-ratings
- its value as a percentage of average earnings at the date of up-rating
For reasons of comparison and maintaining time series before CPI was created, where applicable, both the CPI and RPI are used to convert the values of each benefit to April 2020 prices in the enclosed tables.
How do the values of state benefits compare to price inflation?
Basic State Pension rates for a single person since 2009 expressed in April 2020 prices
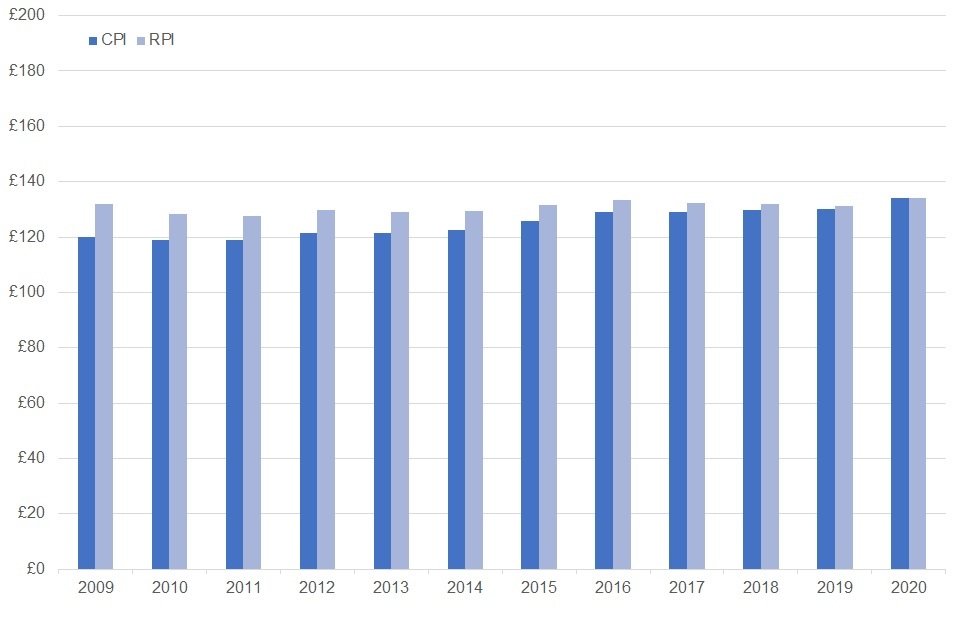
Source: Abstract of DWP benefit rate statistics
Since the introduction of the Triple lock guarantee in April 2011, the value of the Basic State Pension has either exceeded or kept pace with CPI inflation.
The data tables published alongside this publication take the key state benefits at each benefit up-rating date and show the rate of benefit in payment for key claimant types. As prices generally rise each year, it is difficult to look at these benefit rates and sensibly compare them over time. Hence, the tables use various different measures of price inflation to convert all benefit rates to April 2020 prices. The benefit rates then become comparable across time in terms of the purchasing power of the benefit payment. Two price indices are used:
- the Retail Prices Index (RPI)
- the Consumer Prices Index (CPI)
Read an explanation showing Implications of the differences between the Consumer Prices Index and Retail Prices Index from the Office for National Statistics (ONS).
Relevant to this is a recent analysis published by ONS called Shortcomings of the Retail Prices Index as a measure of inflation.
Please also see: A consultation on the Reform to Retail Prices Index (RPI) Methodology which sets out the latest thinking on the future of the RPI.
The ROSSI Index is defined as the RPI with all items except housing costs. It was used by DWP for the up-rating of income-related benefits between November 1983 and 1991. Housing costs were defined as mortgage interest, dwelling insurance and ground rent, local taxes, water charges, repairs and maintenance and DIY materials for repairs and decorations. The items excluded accounted for 7% of the items in the RPI. Since the up-rating of April 1992 until April 2010, a revised version of the ROSSI index (New ROSSI) was used to uprate income-related benefits. The index is composed of the RPI (all items), excluding rents, local taxes and mortgage interest payments. The New ROSSI series has been discontinued as of January 2017. For further information, see the Clarification of publication arrangements for the Retail Prices Index and related indices from ONS.
Many benefits have been historically uprated in line with these indices since 1974. Hence, the real value of benefit payments (at April 2020 prices, relative to RPI) has remained fairly stable since then. Benefits such as State Pension and Pension Credit have seen some moderate growth in real value since 1974, due to up-rating policies linked to earnings in some years and policies to protect the income of those over State Pension age.
The level of price inflation measured by CPI is usually lower than RPI. Until 2011, most DWP benefits were uprated by RPI or ROSSI, meaning their real values relative to CPI increased in this period. Since April 2011, CPI has been the government’s preferred measure of prices and has been used to uprate benefits.
As noted above, the Welfare Reform and Work Act 2016 held the rate of most working age benefits at 2015 to 16 levels. The benefit freeze was lifted by the April 2020 Up-rating Order.
The benefits that were impacted by the freeze include:
- Jobseeker’s Allowance
- Employment and Support Allowance
- Income Support
- Housing Benefit for those below State Pension age
- Universal Credit
Carer’s and Disability elements within the benefits listed above were not included as part of the Freeze.
The Freeze also applied to Working Tax Credit, Child Tax Credit and Child Benefit, which are the responsibility of HM Revenue and Customs (HMRC) and HM Treasury.
Jobseeker’s Allowance rates for a single person since 2009 expressed in April 2020 prices
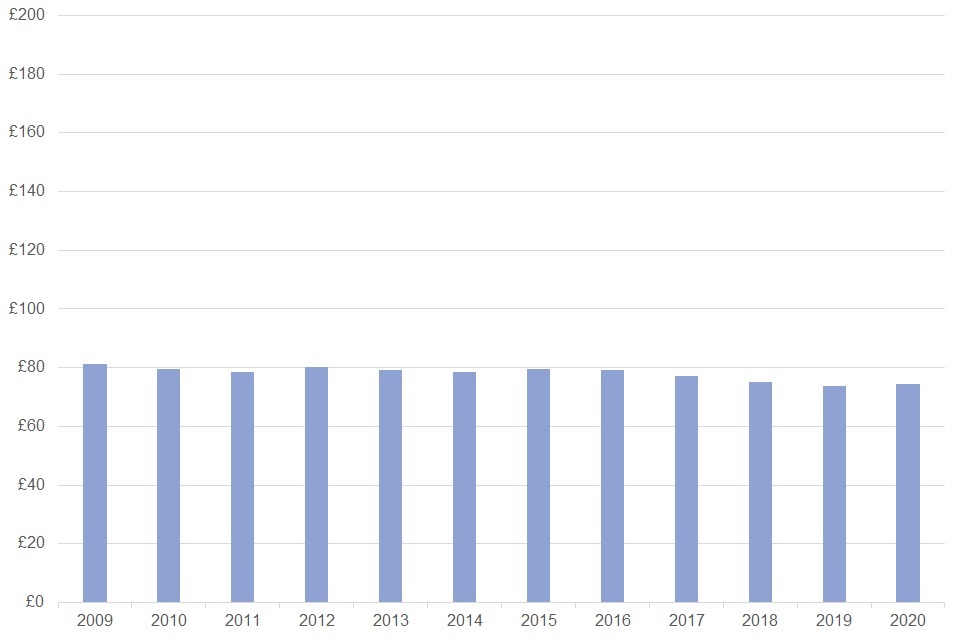
Source: Abstract of DWP benefit rate statistics
In 2015, just before the benefit freeze, JSA payments would have represented the equivalent of £79.39 in April 2020 prices, worth an extra £5.04 when compared to the rate JSA payments were set at in April 2020: £74.34.
How do state benefits today compare to average earnings?
Another way to analyse the value of state benefits across time is to compare the value of benefits to the average full-time wage. Average earnings are estimated each year using Employee earnings in the UK Statistical bulletins. This survey began in 2004, but average earnings statistics have been collected in a broadly comparable form since 1970.
The New Earnings Survey (Great Britain) (NES), which was conducted by the Office for National Statistics (ONS) each April between 1970 and 2004, gave a detailed picture of the pattern of earnings across the whole economy. Between 1970 and March 1983, the survey included full-time workers, aged 21 and over, whose earnings were unaffected by absence. From April 1983, the survey included full-time workers on adult rates, whose earnings were unaffected by absence. Employers were asked to provide information about the earnings of a 1% random sample of employees.
This survey was replaced in October 2004 by the Annual Survey of Hours and Earnings (ASHE). ASHE improved on the NES by extending the coverage of the survey sample, introducing weighting and publishing estimates of quality for all survey outputs.
The accompanying data tables show the rate of benefit as a percentage of average earnings in the same year.
As earnings have historically risen faster than prices, most benefits show a fall in value when compared to average earnings. The recent benefit freeze has also suppressed the value of most working age benefits in relation to earnings growth.
Monthly Universal Credit standard allowance for a single person over 25 expressed as a ratio relative to median earnings since 2013
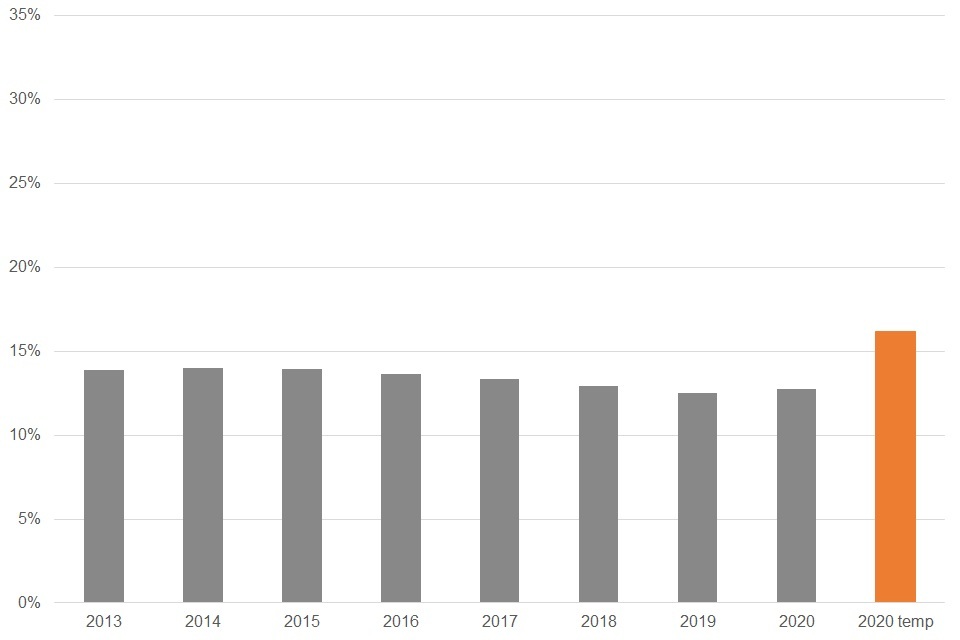
Source: Abstract of DWP benefit rate statistics
In recent years, Universal Credit rates have fallen as a proportion of median earnings. As previously mentioned, in April 2020, Universal Credit Standard Allowance was raised in line with CPI, before being temporarily increased further as a response to the coronavirus (COVID-19) pandemic.
Basic State Pension for a single person expressed as a ratio relative to median earnings since 1987
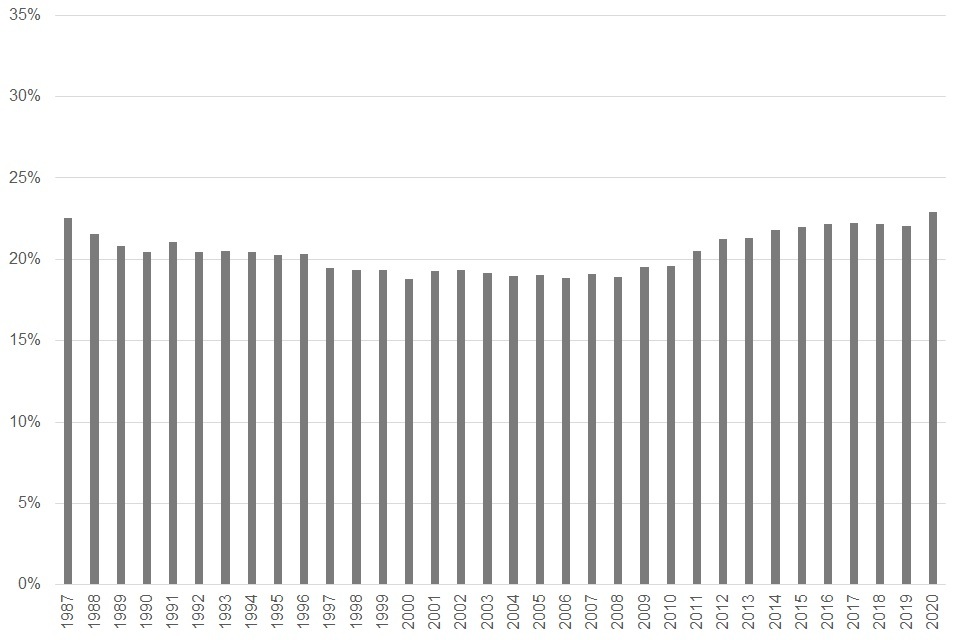
Source: Abstract of DWP benefit rate statistics
State Pension and Pension Credit have often been uprated differently. Please see the State Pension Up-rating Briefing Paper from House of Commons Library for a comprehensive summary of the differences over time.
Both benefits have shown a relatively flat profile when compared to average earnings. As noted above, since April 2011, for Basic State Pension and April 2017 for New State Pension the Triple lock guarantee has ensured that payments increase by the highest of the growth in average earnings, price increases or 2.5%.
Between 1997 and 2019, overall the value of Pension Credit has risen against earnings.
It is important to note that the reference index for up-rating is Average Weekly Earnings (AWE) which is not the same as the data source for the earnings comparison used in this release (ASHE).
Finally, please be aware that ASHE estimates for 2020 are subject to more uncertainty than usual as a result of the challenges faced in collecting data during the coronavirus (COVID-19) pandemic. Further details are available here: Employee earnings in the UK: 2020.
How do the rates of benefits compare with one another?
The data tables show the rates of the key state benefits at each up-rating and the real values (in April 2020 prices, using RPI or CPI). These real values are given at the point of up-rating. This represents the real value of that benefit (in April 2020 prices) at the date of first payment.
To give a better representation of the real value of the benefit across the whole period that rate was in force, the tables also show the real value of the benefit between up-rating periods. This calculation uses the average value of the benefit (in April 2020 prices) in each of the months the rate was used.
5. About this release
The tables accompanying this release can be found on the Abstract of DWP benefit rate statistics publication page on Gov.uk. Please note that the data tables do not include supporting commentary and users should refer to this release and the policies and statements documents for background information.
This publication was assessed by United Kingdom Statistics Authority in June 2012 and designated as a National Statistic in June 2013, in accordance with the Statistics and Registration Service Act 2007 and signifying compliance with the Code of Practice for Official Statistics.
Designation can be broadly interpreted to mean that the statistics: -
- are well explained and readily accessible
- are produced according to sound methods
- are managed impartially and objectively in the public interest
Once statistics have been designated as National Statistics, it is a statutory requirement that the Code of Practice shall continue to be observed.
6. Known issues, changes and revisions to the abstract
As of January 2017, the publication of New ROSSI figures has been discontinued. Therefore, we have taken comparative data using New ROSSI out of this publication.
Due to improvements in the methodology in the 2017 edition, previous editions are no longer directly comparable with the editions from 2017 onwards, and are therefore outdated. We removed the previous publications from the Abstract of DWP benefit rate statistics collection page. They are available on request should they be required.
This year we have removed Retail Price Index from some of the comparisons drawn in the abstract tables where those comparisons did not fit.
Where applicable, presentational changes to data tables have been made in line with the Accessibility statement for DWP statistics.
As previously mentioned, the coronavirus (COVID-19) pandemic has had an impact on the survey methods and responses used by the ONS on both its inflation (CPI and RPI) and earnings (ASHE) measures. In the case of ASHE this is further affected by the impact of the Job Retention Scheme on furloughed earnings.
7. Where to find out more
This document, supporting tables and background information can be found on the collection page.
Quality and methodology statements for the Abstract of DWP benefit rate statistics can be found under our policies and statements section.
For more information on the differences between CPI and RPI please read the Inflation and price indices.
Please also see an analysis by the ONS called Shortcomings of the Retail Prices Index as a measure of inflation.
Details of other National and Official Statistics produced by the Department for Work and Pensions can be accessed via the Statistics at DWP page.
8. Contact information and feedback
Lead Statistician: Alan Gibson, alan.gibson@dwp.gov.uk
We would very much welcome feedback on this release and on the summary’s new format as an HTML based document. Please email DWP at stats-consultation@dwp.gov.uk
ISBN: 978-1-78659-288-0