Work and Health Programme statistics to May 2020
Published 27 August 2020

© Crown copyright 2020
This publication is licensed under the terms of the Open Government Licence v3.0 except where otherwise stated. To view this licence, visit nationalarchives.gov.uk/doc/open-government-licence/version/3 or write to the Information Policy Team, The National Archives, Kew, London TW9 4DU, or email: psi@nationalarchives.gov.uk.
Where we have identified any third party copyright information you will need to obtain permission from the copyright holders concerned.
This publication is available at https://www.gov.uk/government/statistics/work-and-health-programme-statistics-to-may-2020/work-and-health-programme-statistics-to-may-2020
The latest release of these statistics can be found in the Work and Health Programme statistics collection.
European Social Fund logo
This quarterly release of experimental statistics on the Work and Health Programme includes data up to May 2020.
Statistics covered in this release include data covering the initial period of the coronavirus (COVID-19) pandemic. The measures taken during the pandemic have had an impact on the delivery of the WHP and on its performance in the most recent months reported in this release. The Department for Work and Pensions (DWP) have deployed a number of measures to deal with the unprecedented levels of demand on the department. DWP’s priority continues to be ensuring people get their benefit payments and support for those who need it the most, therefore there have been lower numbers of referrals to the WHP during this time. As face to face meetings were also suspended, DWP provided additional online signposting to the WHP, and enabled self-referrals from individuals who were eligible. Additionally, some employment sectors were unable to recruit and others saw substantial reductions in job opportunities.
The next release will be in November 2020.
We are seeking user feedback on this statistical bulletin. Send comments to: stats-consultation@dwp.gov.uk.
1. Introduction
The Work and Health Programme (WHP) was launched in England and Wales between November 2017 and April 2018. The data in this publication covers the 31 months from November 2017 to May 2020.
The WHP predominantly helps disabled people, as well as the long-term unemployed and the Early Access group (which is made up of certain priority groups) to enter into and stay in work.
People are referred by Jobcentres to work with organisations known as providers, from the public, private and voluntary sectors. The providers are paid a service delivery fee as well as outcome-related payments when a person reaches either:
- a specified level of earnings once in employment
- 6 months of being in self-employment
2. Main Stories
Statistics covered in this release include data covering the initial period of the coronavirus (COVID-19) pandemic. The measures taken during the pandemic have had an impact on the delivery of the WHP and on its performance in the most recent months reported in this release. DWP have deployed a number of measures to deal with the unprecedented levels of demand on the department. DWP’s priority continues to be ensuring people get their benefit payments and support for those who need it the most, therefore there have been lower numbers of referrals to the WHP during this time. As face to face meetings were also suspended, DWP provided additional online signposting to the WHP, and enabled self-referrals from individuals who were eligible. Additionally, some employment sectors were unable to recruit and others saw substantial reductions in job opportunities.
The statistics show:
- by May 2020, cumulatively 76% of all individuals referred have started on the WHP
- 72% of all people starting the WHP are from the Disability group
- 9% are from the Early Access group
- 19% are from the Long-term Unemployed group
- 63% of all people starting the WHP are male
- the number of monthly starts increased to a peak of 5,600 in March 2019
Since the WHP began there have been:
- 170,000 referrals for 140,000 individuals
- 110,000 starts
- 16,000 job outcomes
Note: those starting more recently have had shorter time to achieve a job outcome, therefore it is not meaningful to divide the number of job outcomes by the number of starts or referrals.
Figure 1: The number of individuals referred by eligibility group, November 2017 to May 2020

The bar chart shows that the majority of individuals referred are from the disability group (100,000), there are fewer individuals in the Long-term Unemployed group (25,000) and the fewest are in the Early Access Group (14,000)
Source: WHP statistics data tables.
The majority of individuals referred are from the Disability group.
Figure 2: The percentage of programme starts achieving a job outcome within 6 months or 12 months of starting (by cohort start month), December 2017 to November 2019

The bar chart shows that from 6 months after starting the programme to 12 months after starting the programme, the percentage of outcomes triples in nearly all monthly cohorts
Source: WHP statistics data tables.
For full data see Table 1.2b of the tables accompanying this release.
3. What you need to know
The WHP aims to provide support to help people find and keep a job. It is available to the following 3 groups:
1. Disability group – voluntary for disabled people as defined in the Equality Act (2010). This is the main group that the WHP is aimed at
2. Early Access group – voluntary and aimed at people who may need support to move into employment and are in one of a number of priority groups (for example homeless, ex-armed forces, care leavers, refugees)
3. Long-term Unemployed group – mandatory for Jobseeker’s Allowance or Universal Credit claimants who have reached 24 months of unemployment
WHP participants may be in receipt of:
- Jobseeker’s Allowance (JSA)
- Employment and Support Allowance (ESA)
- Income Support (IS)
- Universal Credit (UC)
Additionally it is possible to join WHP even if not receiving benefits, as people can be signposted to WHP by approved organisations.
WHP is delivered across England and Wales by 5 providers across 6 areas, known as Contract Package Areas (CPA).
In London and Greater Manchester, where devolution deals are in place, the WHP is commissioned and contract managed by the local authorities, known as Local Government Partners (LGP), who are match-funded by the European Social Fund (ESF).
In some areas, the government is designing WHP with the help of Local Enterprise Partnerships and City Regions. These are known as Devolution Deal Areas (DDA).
For more information about this see Table 2.2 of the tables accompanying this release.
Definitions
The following definitions are used in the statistics:
Referrals
Work coaches in Jobcentre Plus offices will send details of a person wanting to join WHP to a provider. When a provider acknowledges the referral and contact has been established with the participant, this is called a referral. WHP participants can be referred more than once. Figures presented in this publication do not include cancelled or rejected referrals.
Individuals referred
As referrals can include multiple referrals for one individual, individuals referred is the number of individual people referred. This means only the first referral per person is counted.
Starts
A start on the programme is recorded when a WHP participant attends the initial face-to-face meeting with the provider. The vast majority of starts should take place within 15 working days, although starts outside this window may occur if the customer does not attend the initial meeting within this time frame.
First earnings from employment
The point at which a participant achieves their first earnings from their first employment whilst on the programme. A participant may not necessarily go on to achieve a job outcome. Statistics on first earnings from employment do not include earnings from self-employment.
Job outcomes
A provider is classed as achieving a job outcome when a participant reaches either:
- a specified level of earnings once in employment (which varies across the different areas – see background information note for details)
- 6 months of being in self-employment
Read the background information note for further information on WHP policy and definitions.
4. Joining the Work and Health Programme
The number of monthly starts increased to a peak of 5,600 in March 2019 and remained relatively stable until a decrease was seen in the months impacted by the coronavirus (COVID-19) pandemic.
Figure 3: Monthly number of referrals and starts, November 2017 to May 2020

Time series line chart shows referrals and starts followed an increasing trend to December 2018 where both decreased. Since then these numbers have stabilised. The latest month, May 2020, shows 300 referrals, 330 individuals referred and 100 starts
Source: WHP statistics data tables.
Please note in the May 2020 publication, methodology was improved to more accurately record the number of starts. We now account for the 15 days allowed after referrals to input start activity therefore the most recent month of starts data (May 2020) is incomplete.
During the first few months of WHP, monthly referrals and starts built up as the WHP was rolled out across all areas of England and Wales.
The total number of monthly starts was on an upward trend from March 2018 (when the programme was available to all areas of the country). Referrals from the Long-term Unemployed group started in April 2018 with monthly starts reaching a peak of 5,600 in March 2019.
Referrals decreased significantly in April and May 2020 to 170 and 320 respectively. Similarly, starts on the WHP decreased to 90 in April and to 100 in May 2020.
During the coronavirus (COVID-19) pandemic DWP have deployed a number of measures to deal with the unprecedented levels of demand on the department. DWP’s priority continues to be ensuring people get their benefit payments and support for those who need it the most, therefore there have been lower numbers of referrals to the WHP during this time. As face to face meetings were also suspended, DWP provided additional online signposting to the WHP, and enabled self-referrals from individuals who were eligible.
Since the start of the programme, nationally there have been a total of:
- 170,000 referrals
- 140,000 individuals referred
- 110,000 starts
Overall, the proportion of individuals referred that have started is 76%.
For more information see Table 1.1 of the tables accompanying this release.
The majority of starts are made by people in the Disability group.
Figure 4: Starts by eligibility group, November 2017 to May 2020
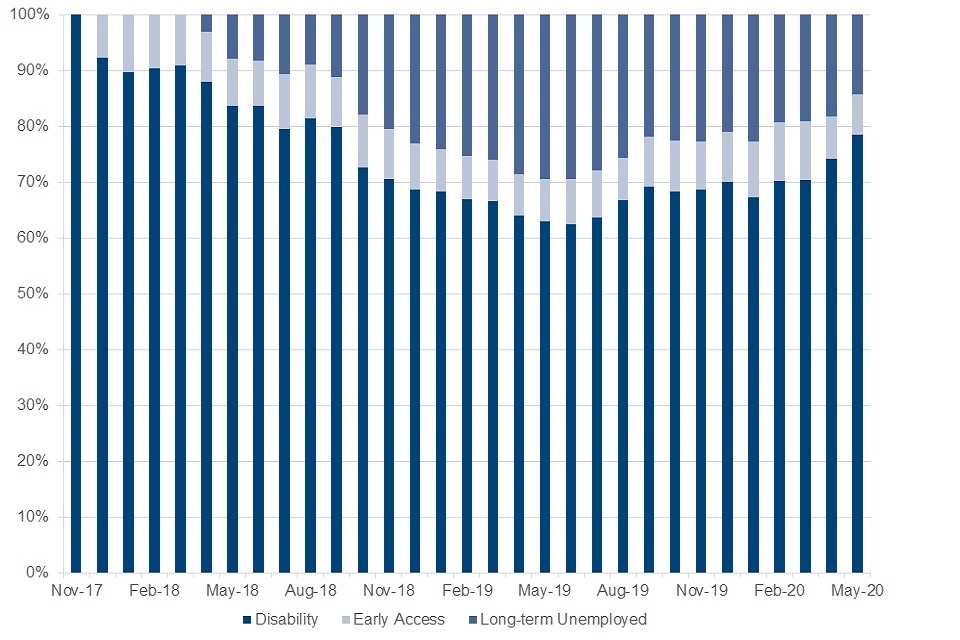
Bar chart shows that at the start of WHP, disability group accounted for the majority of starts. Since Nov 2018 the long term unemployed group has accounted for around 19% of starts, the proportion of early access participants has remained at around 9%
Source: WHP statistics data tables.
March 2018: WHP available to all areas of the country.
April 2018: Long-term Unemployed referrals began.
October 2018: More Long-term Unemployed and Disability group referrals accepted.
April and May 2020: Note that for these months, starts are lower. The measures taken during the pandemic have had an impact on the delivery of the WHP and on its performance in the most recent months.
In line with the nature of the programme, large numbers of people with disabilities or health conditions (the Disability group) are joining WHP.
People are also eligible for WHP if they are long-term unemployed, or belong to certain priority groups (known as the Early Access group).
Since the start of the programme, the majority of individuals referred (73%) and starts (72%) come from the Disability group, the proportions are comparable across all stages (referrals, individuals referred and starts). The first referrals from the Long-term Unemployed group were made in April 2018.
The Long-term Unemployed group accounts for 18% of individuals referred and 19% of starts. The Early Access group accounts for 9% of individuals referred and 9% of starts.
In the latest month (May 2020):
- 80% of starts were from the Disability group
- 7% of starts were from the Early Access group
- 13% of starts were from the Long-term Unemployed group
For full data see Table 1.1 of the tables accompanying this release.
5. Work and Health Programme referrals and starts by Area
Since March 2018, all areas are contributing to WHP, delivering referrals and starts.
Figure 5: Distribution of all WHP individuals referred and starts across areas: from November 2017 to May 2020 (National)

Starts as a proportion of individuals referred by area. Wales is highest at 81%, Home Counties at 79%, North East, North West & Local London at 78%, Central at 76%, Southern & Greater Manchester 75%, West London 70%, South London 69% & Central London 66%
Source: WHP statistics data tables
Each section within the inner ring shows how the total number of individuals referred (140,000) is distributed across each area. The outer ring shows the percentage of starts there have been for the individuals referred in each area (110,000 in total). The darker the inner segment, the earlier the area rolled out the programme. The following table lists the areas in order of date rollout from top to bottom.
Figure 6: Number of referrals and starts by area, November 2017 to May 2020 by order of rollout (earliest listed first).
| Area | Provider | Date of Rollout | Referrals | Individuals referred | Starts | % of starts to individuals |
|---|---|---|---|---|---|---|
| North West | Ingeus | 27/11/2017 | 13,700 | 11,300 | 8,800 | 78% |
| Wales | Remploy | 01/12/2017 | 10,300 | 9,100 | 7,300 | 81% |
| Central | Shaw Trust | 15/01/2018 | 24,400 | 19,600 | 14,900 | 76% |
| North East | Reed In Partnership | 15/01/2018 | 31,000 | 27,300 | 21,300 | 78% |
| Southern | Pluss | 15/01/2018 | 21,900 | 18,400 | 13,900 | 75% |
| Home counties | Shaw Trust | 15/01/2018 | 14,100 | 11,700 | 9,200 | 79% |
| Greater Manchester Combined Authority | Ingeus and The Growth Company | 29/01/2018 | 16,900 | 13,700 | 10,300 | 75% |
| West London Alliance (WL) | Shaw Trust | 26/02/2018 | 8,900 | 7,300 | 5,100 | 70% |
| Central London Forward (CL) | Ingeus | 01/03/2018 | 16,600 | 12,800 | 8,500 | 66% |
| South London Partnership (SL) | Reed In Partnership | 01/03/2018 | 4,000 | 3,300 | 2,300 | 69% |
| Local London (LL) | Maximus | 01/03/2018 | 9,500 | 8,100 | 6,400 | 78% |
Source: WHP statistics data tables. In this figure, referrals, individuals referred and starts are rounded to the nearest 100.
See the WHP methodology document for maps of Greater Manchester and London LGP areas.
Clearly, there have been proportionally more referrals and starts in the North East as this is the largest area. By the same token, the smaller proportions of referrals and starts are seen in London areas, and these were also some of the final areas to roll out the programme, as well as being some of the smallest areas.
Overall, up until May 2020, the national proportion of starts to individuals referred is around 76%. Due to differences when each area began offering services and respective sizes, these figures vary across areas. However cumulatively, the highest rate of individuals referred to starts is in Wales (81%) and the lowest rate of individuals referred to starts is in Central London (66%).
For full data see Table 2.1 and 2.2 of the tables accompanying this release.
6. Job outcomes from the Work and Health Programme
Participants are moving through the process in all areas of England and Wales.
Figure 7: The flow of participants for referrals to August 2019, for those who could achieve a Job Outcome by May 2020

Sankey of individuals referred to WHP; although a small number did not attend their first appointment, the majority did and started on WHP. Most participants haven’t achieved an outcome yet, a small but growing number of these achieved an outcome
Source: WHP statistics data tables.
Referrals after November 2019 are not presented as it is unlikely enough time has elapsed for those participants to reach the job outcomes earnings threshold (which varies across the different areas) or 6 months in self-employment. Those who were referred up to and including November 2019 have been engaged with the programme for longer and have received more support making job outcomes more likely.
69% of all individuals referred by November 2019 have started the programme, and of these, so far 16% have reached the job outcomes earnings threshold or 6 months of being in self-employment by May 2020.
31% of individuals referred by November 2019 have not gone on to start the programme; this may, for example, be due to the participant not attending.
Participants who started the programme earliest have seen the highest level of outcomes as they have longer to reach the earning threshold or 6 months of being in self-employment.
84% of the participants who have started by November 2019 have not yet reached the job outcome earnings threshold or 6 months in self-employment by May 2020, though some of these participants have had only 6 months to achieve an outcome so far.
The national WHP and the majority of the LGPs have an earnings threshold to achieve a job outcome as 16 hours per week for 26 weeks at the National Living Wage, however the threshold for the West London Alliance is the same number of hours but at the London Living Wage and the Greater Manchester Combined Authority at the Real Living Wage.
Providers are continuing to achieve first earnings from employment and job outcomes.
Figure 8: First earnings from employment by month, November 2017 to May 2020: all areas

Time series chart showing a steady increase in the number of participants achieving first earnings with the exception of a dip in January 2019 and January 2020. In the most recent month, May 2020, 580 participants achieved first earnings
Source: WHP statistics data tables.
Figure 9: Job outcomes by month, November 2017 to May 2020: all areas

Time series chart showing an overall increase in the number of job outcomes over time with some fluctuation between December 2018 and July 2019. In the most recent month, May 2020, 890 participants achieved job outcomes
Source: WHP statistics data tables.
16,000 participants have reached the job outcome earnings threshold or reached 6 months of being in self-employment and 33,000 participants have achieved first earnings from employment as of May 2020.
February 2018 saw the first participants achieve first earnings in employment. March 2018 saw the first participants reach the job outcomes earnings threshold or 6 months of being in self-employment. From March 2020 onwards, there is a decrease in the number of participants achieving first earnings in all three eligibility groups.
For full data see Table 1.4 of the tables accompanying this release.
First earnings from employment and job outcomes are less likely to have been achieved for individuals who have recently started on the programme.
Figure 10: Total first earnings from employment and job outcomes as a percentage of starts by month started, cohorts from December 2017 to November 2019

Bar chart showing that, as an overall trend, those in the Disability group who have started the programme more recently have lower percentages achieving first earnings or job outcomes
Source: WHP statistics data tables.
First earnings from employment is the point at which a participant achieves their first earning from their first employment while on the programme. These figures suggest that while not everyone goes on to achieve a job outcome, a higher proportion have earned from employment while on the programme. Note that the first earnings in employment figures don’t include those in self-employment.
Figure 11: Disability group first earnings from employment and job outcomes as a percentage of starts by month started, cohorts from December 2017 to November 2019

Bar chart showing that, as an overall trend, those in the Disability group who have started the programme more recently have lower percentages achieving first earnings or job outcomes
Source: WHP statistics data tables.
Figure 12: Early Access group first earnings from employment and job outcomes as a percentage of starts by month started, cohorts from December 2017 to November 2019

Bar chart showing that, as an overall trend, those in the Early Access group who have started the programme more recently have lower percentages achieving first earnings or job outcomes
Source: WHP statistics data tables.
Figure 13: Long-term Unemployed group first earnings from employment and job outcomes as a percentage of starts by month started, cohorts from December 2017 to November 2019

Bar chart showing that, as an overall trend, those in the Long-term Unemployed group who have started the programme more recently have lower percentages achieving first earnings or job outcomes
Source: WHP statistics data tables.
51% of starts from the first monthly cohort (December 2017) achieved first earnings from employment within 29 months of starting. From the total starts in December 2017, 47% of first earnings from employment achieved within 26 months of starting came from the Disability group and 4% came from the Early access group.
29% of starts from the first monthly cohort (December 2017) achieved a job outcome within 29 months of starting. From the total starts in December 2017, 26% of job outcomes achieved within 29 months of starting came from the Disability group and 3% came from the Early access group.
More recent start months are likely to report lower levels of first earnings from employment and job outcomes as participants haven’t had as much time on the programme. Since March 2020, there is a large decrease in the number of job outcomes achieved by all three groups.
The percentages for the Disability group cohorts mirror the trend of the percentages for the total cohorts.
Percentages are more changeable in the Early Access and Long-term Unemployed groups due to lower volumes of starts and job outcomes.
The Long-term Unemployed group began accepting referrals in April 2018, therefore there are no first earnings from employment or job outcomes before this point.
For full data see Table 1.3a and Table 1.3b of the tables accompanying this release.
First earnings from employment – standardised monthly performance measure at 6 and 12 months
Figure 14: Percentage of starts achieving first earnings from employment within 6 months of starting by eligibility group, December 2017 to November 2019

2 groups are relatively stable with around 22% of Disability group starts & 18% of Long-term Unemployed group starts achieving first earnings within 6 months. Early Access group percentage of starts achieving first earnings fluctuates more (15% to 48%)
Source: WHP statistics data tables.
Over time, the proportion of first earnings from employment achieved within 6 months of starting the programme is relatively stable at around 22% for those from the Disability group and 18% for those from the Long-term Unemployed groups.
The Early Access group shows more change in percentages over time due to lower volumes of starts and first earnings from employment. This is more apparent for the December 2017 cohort.
The Long-term Unemployed group began accepting referrals in April 2018, therefore there are no first earnings before this point.
See Table 1.2a for full data
Figure 15: Percentage of starts achieving first earnings from employment within 12 months of starting by eligibility group, December 2017 to May 2019

figure-15-percentage-of-starts-achieving-first-earnings
Source: WHP statistics data tables.
The proportion of first earnings from employment achieved by the Disability group within 12 months of starting ranges between 29% and 41%, in line with the total number of first earnings from employment achieved within 12 months of starting.
The proportion of first earnings from employment achieved by the Long-term Unemployed group within 12 months of starting ranges between 26% and 38%.
The Early Access group shows more change in percentages over time due to lower volumes of starts and first earnings from employment.
See Table 1.2a for full data
Job Outcomes – standardised monthly performance measure at 6 and 12 months
Figure 16: Percentage of starts achieving a job outcome within 6 months of starting by start month and eligibility group, December 2017 to November 2019

Around 5% of Disability & 4% of Long-term Unemployed group starts achieve a job outcome within 6 months, however the Early Access group shows more fluctuation (4% to 26%) in the percentage of starts achieving a job outcome within the same period
Source: WHP statistics data tables.
Over time, the proportion of job outcomes achieved within 6 months of starting the programme has ranged between:
- 3% and 7% for those from the Disability group
- 2% and 5% for those from the Long-term Unemployed group
The Early Access group shows more change in percentages over time due to lower volumes of starts and job outcomes. This is more apparent for December 2017 and June 2018 cohorts.
The Long-term Unemployed group began accepting referrals in April 2018, therefore there are no outcomes before this point.
For full data see Table 1.2b of the tables accompanying this release.
Figure 17: Percentage of starts achieving a job outcome within 12 months of starting by start month and eligibility group, December 2017 to May 2019

Disability group is relatively stable with between 12 & 19% of starts achieving a job outcome within 12 months. Long-term unemployed & Early access fluctuate more, with the long-term unemployed from 10 to 20% & the Early access from 13 to 39%
Source: WHP statistics data tables
The proportion of job outcomes achieved by the Disability group within 12 months of starting ranges between 12% and 19%, in line with the total number of job outcomes achieved within 12 months of starting.
The Early Access group shows more change in percentages over time due to lower volumes of starts and job outcomes.
The proportion of job outcomes achieved by the Long-term Unemployed group within 12 months of starting ranges between 10% and 20%.
For full data see Table 1.2b of the tables accompanying this release.
7. Demographics of the Work and Health Programme
The distribution of age varies by area.
Figure 18: Percentage of WHP starts by age group and area, November 2017 to May 2020

Chart shows number of starts by age and area. The biggest difference between areas is in the 18-24 age group (5-15%). In the 25-59 group the percentage ranges from 74% to 82%. In the 60+ group the percentage of starts varies less across areas (9-14%)
Source: WHP statistics data tables
Wales has the highest proportion of 18 to 24 year olds starting the programme (15%), while West London has the highest proportion of 25 to 59 year olds starting the programme (82%).
11% of all starts to WHP were from the 60+ age group. The majority (77%) of all starts come from the 25 to 59 age group. This is to be expected as WHP is aimed at working age participants.
For further age breakdowns see Table 3.1 and Table 3.2 of the tables accompanying this release.
Almost two thirds of all WHP participants are male.
Figure 19: WHP starts by gender, November 2017 to February 2020

Pie chart showing that across the WHP 63% of participants starting the programme are male and 37% are female
Source: WHP statistics data tables.
63% of all participants starting WHP are male.
Males consistently accounted for around 60% of all monthly participants since the start of the programme.
This proportion differs slightly across groups. For example, in the Early Access group, 68% of participants are male, in the Long-term Unemployed group 63% are male, and in the Disability group 62% of participants are male.
For full data see Table 3.3 and Table 3.4 of the tables accompanying this release.
8. About these statistics
This statistical summary gives an overview. Key points and trends are presented using charts and commentary. The information underlying the charts is available as supporting tables.
In line with our publications strategy, we aim to release additional breakdowns in future publications.
Details will be announced in advance, via StatsUserNet and the DWP statistics calendar.
Rounding
Volumes and amounts have been rounded as detailed in the background information and methodology document. Percentages are calculated using numbers prior to rounding and rounded to the nearest whole percentage point.
Experimental statistics
Experimental statistics are Official Statistics which are published in order to involve users and stakeholders in their development and as a means to build in quality at an early stage. All Official Statistics should comply with the UK Statistics Authority’s Code of Practice for Statistics which promotes the production and dissemination of official statistics that inform decision making.
Where to find out more
Read the WHP background information note for more Information about the statistics.
The Work and Health Programme provider guidance is used by programme providers.
Information on the Work Programme, a programme which aimed to get unemployed people into sustained employment, can be found in the collection of Work Programme statistics.
Information on Work Choice, a programme which aimed to help disabled people find, keep and progress in a job, can be found in the collection of Work Choice statistics.
Information on Specialist Employability Support, a voluntary programme which is aimed at helping disabled people with complex barriers that other support is not suitable for to find a job, can be found in the collection of Specialist Employability Support statistics.
Information on the Access to Work provision, which is aimed to support people who have a disability or long-term health condition start or stay in work, can be found in the collection of Access to Work statistics.
Users can also produce their own tables and access demographic breakdowns using Stat-Xplore.
Contact information and feedback
For more information on WHP statistics, contact tracy.hills@dwp.gov.uk
DWP would like to hear your views on our statistical publications. If you use any of our statistics publications, we would be interested in hearing what you use them for and how well they meet your requirements. Please send your comments by email to: stats-consultation@dwp.gov.uk.
Users can also join the ‘Welfare and Benefit Statistics’ community at StatsUserNet. DWP announces items of interest to users via this forum, as well as replying to users’ questions.