Wider Determinants of Health: November 2018 update commentary
Published 6 November 2018

© Crown copyright 2018
This publication is licensed under the terms of the Open Government Licence v3.0 except where otherwise stated. To view this licence, visit nationalarchives.gov.uk/doc/open-government-licence/version/3 or write to the Information Policy Team, The National Archives, Kew, London TW9 4DU, or email: psi@nationalarchives.gov.uk.
Where we have identified any third party copyright information you will need to obtain permission from the copyright holders concerned.
This publication is available at https://www.gov.uk/government/statistics/wider-determinants-of-health-november-2018-update/wider-determinants-of-health-november-2018-update-commentary
New in this update
We have added 2 indicators that are new to the Fingertips platform, to the Wider Determinants of Health profile. These indicators are available at local authority level as well as for England and the regions:
- percentage of adults cycling for travel at least 3 days per week
- percentage of adults walking for travel at least 3 days per week
We have added new data to the following indicators:
- affordability of home ownership
- unemployment
- long-term claimants of Jobseeker’s Allowance (JSA)
- Employment and Support Allowance (ESA) claimants
We have also added the following two indicators to the vulnerability domain (these are currently available in Public Health England’s Child and Maternal Health profiles):
- children in care
- teenage mothers
Health Assets domain
The Health Assets Profile, previously a separate profile on Public Health England’s Fingertips platform, has now been combined with the Wider Determinants of Health profile. The health assets indicators can be found in the dedicated health assets tab.
Summary of new indicators
This summary focuses on England-level data. The Wider Determinants of Health profile presents indicators primarily at the local authority level in addition to regional and England values.
Two new active travel indicators
We have added 2 new indicators to the natural and built environment domain: percentage of adults cycling for travel at least 3 days per week, and percentage of adults walking for travel at least 3 days per week. Creating an environment where people actively choose to walk and cycle as part of everyday life can have a significant impact on public health and may reduce inequalities in health. It is an essential component of a strategic approach to increasing physical activity. As well as reducing polluting emissions, encouragement of active travel - that is walking or cycling on journeys for which a car would previously have been used - will also have wider public health benefits associated with increased physical activity.
Percentage of adults cycling for travel at least 3 days per week
This new indicator shows that the percentage of the population aged 16 years and over that cycled for travel at least 3 days per week was 3.3% in 2016 to 2017. This is not significantly different from the previous year.
Percentage of adults walking for travel at least 3 days per week
This new indicator shows that the percentage of the population aged 16 years and over that walked for travel at least 3 days per week was 22.9% in 2016 to 2017. This is not significantly different from the previous year.
Summary of updated indicators
Affordability of home ownership
Home ownership continued to become less affordable in England in 2017. These results show:
- the median house price was 7.9 times higher than the median gross annual earnings in 2017
- this is the fourth consecutive year-on-year increase since 2013 when the ratio was 6.8
Figure 1 shows the regions that are the most and least affordable compared with the England average. In 2017, London was the least affordable region, with median house prices 13.2 times higher than median earnings, while the North East was the most affordable with a ratio of 5.2
Figure 1: trend in ratio of median house price to median gross annual residence-based earnings, England, London and the North East, from 2002 to 2017
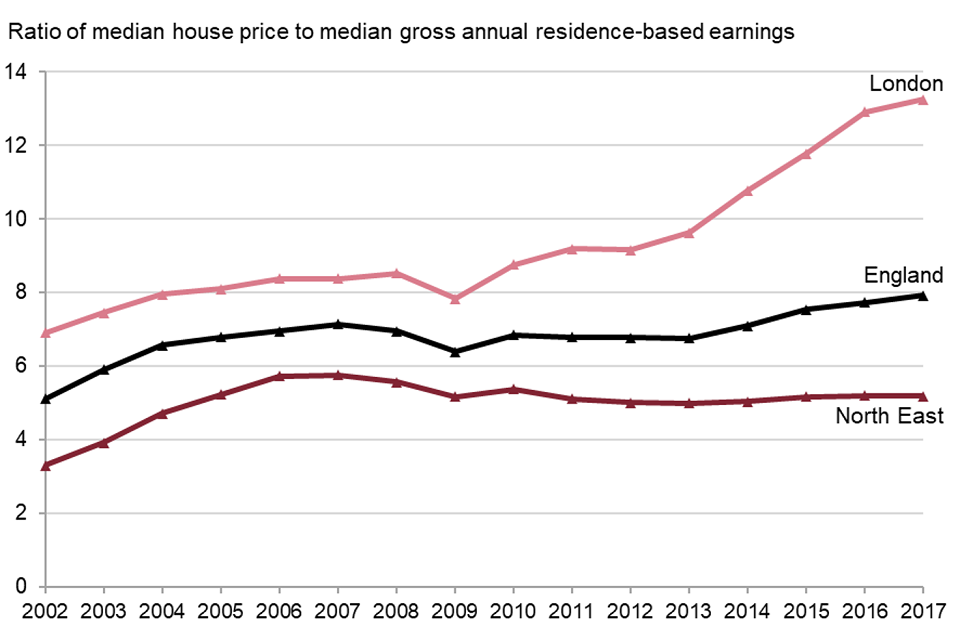
Line chart showing the ratio of median house price to median gross annual residence-based earnings over time for London, England and the North East, between 2002 and 2017
Unemployment
The percentage of the economically active population aged 16 and over who were unemployed declined to 4.4% in 2017, continuing a downward trajectory. The map in Figure 2 below shows variation by local authority across England. The economically active population consists of people who are employed or unemployed only, excluding those who are out of work for other reasons such as illness, studying, caring responsibilities or retirement.
Figure 2: map of the unemployment rate, England, 2017
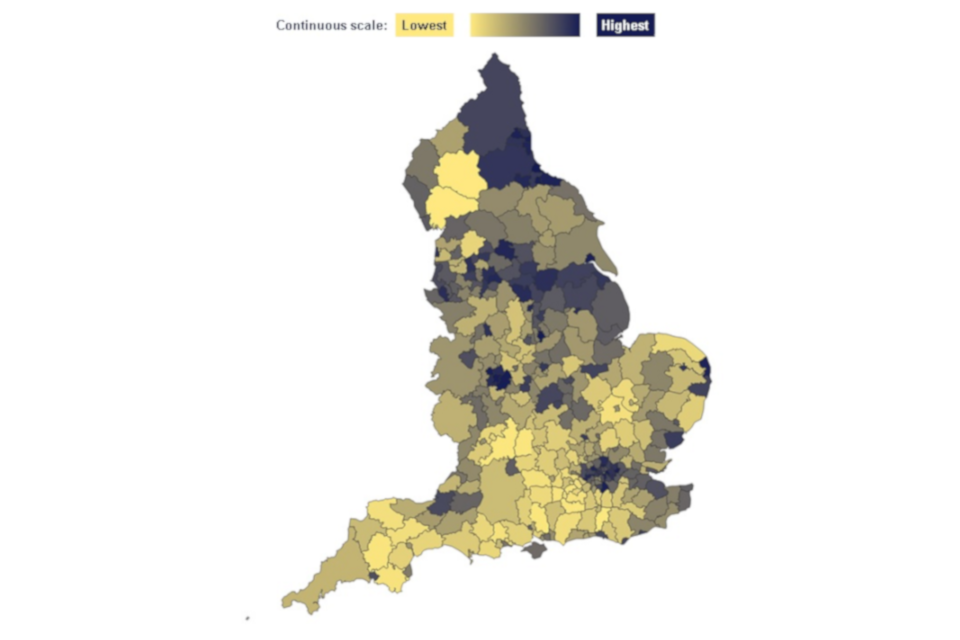
Map of England showing variation by local authority of the rate of unemployment in 2017, shaded to show a continuous scale of the rate of unemployment for each local authority, from the lowest to the highest
Long-term claimants of JSA
In 2017, the rate per 1,000 population of people aged 16 to 64 years claiming JSA for over 12 months was 3.5 in England, down slightly from 3.7 per 1,000 in 2016 (Figure 3).
Figure 3: trend in long-term claimants of JSA, England, 2012 to 2017
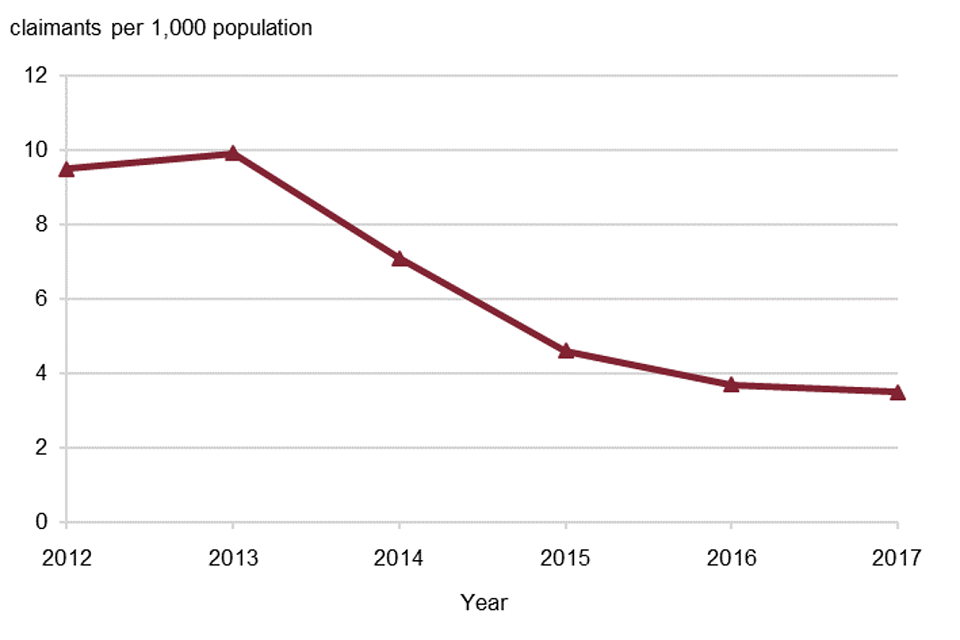
Line chart showing the trend in the rate per 1,000 population aged 16 to 64 years in England claiming Jobseeker's Allowance long term, from 2012 to 2017
Employment and Support Allowance claimants
In 2018, 5.4% of the population aged 16 and 64 years were claiming ESA, Incapacity Benefit (IB) or Severe Disablement Allowance (SDA) in England, down from 5.7% in 2017 (Figure 4).
Figure 4: trend in ESA claimants, England, 2012 to 2018
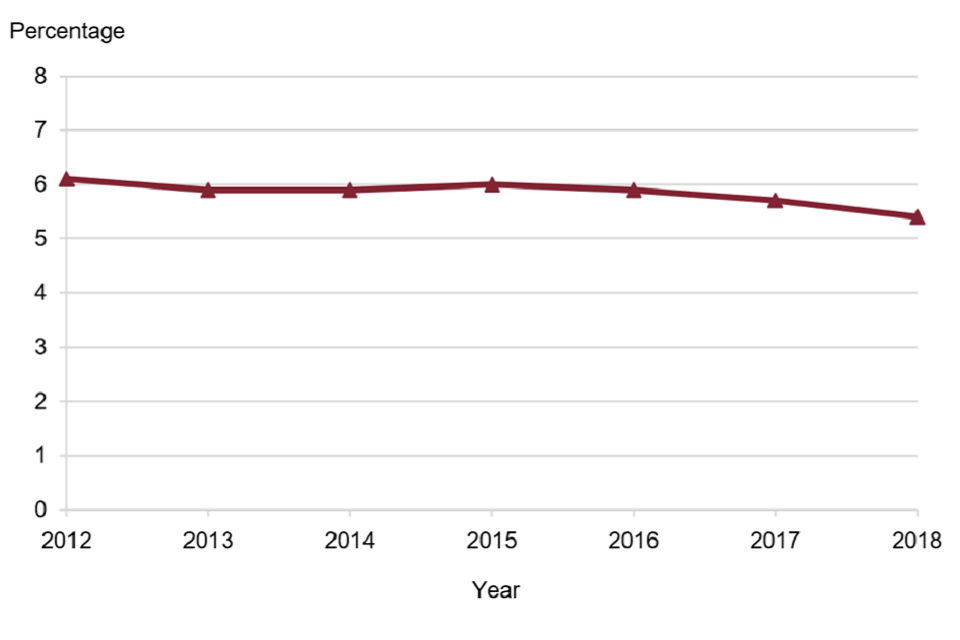
Line chart showing the percentage of the population aged 16 to 64 years in England claiming Employment and Support Allowance from 2012 to 2017
For information on how the indicators are produced and caveats surrounding their interpretation, please see the ‘Definitions’ tab for each indicator in the profile.
Background
The Wider Determinants of Health tool aims to provide the public health system with intelligence regarding the wider determinants of health to help improve population health and reduce health inequalities. The tool contains 7 domains: the natural and built environment, work and the labour market, vulnerability, income, crime, education and the set of Marmot indicators. The Marmot indicators were developed by University College London’s Institute of Health Equity, in collaboration with Public Health England. In addition, there is a health outcomes domain enabling a cursory look at how the wider determinants relate to health outcomes.
The indicators that have been brought together for this tool are a combination of wider determinants, health behaviours and health outcomes. We will continue to develop the Wider Determinants of Health profile, developing new indicators dedicated to describing the wider determinants of health.
Responsible statistician, product lead: Clare Griffiths
For queries relating to this document, please contact: wider.determinants@phe.gov.uk.