Water and sewerage companies in England: environmental performance report for 2019
Published 2 October 2020
Applies to England

© Crown copyright 2020
This publication is licensed under the terms of the Open Government Licence v3.0 except where otherwise stated. To view this licence, visit nationalarchives.gov.uk/doc/open-government-licence/version/3 or write to the Information Policy Team, The National Archives, Kew, London TW9 4DU, or email: psi@nationalarchives.gov.uk.
Where we have identified any third party copyright information you will need to obtain permission from the copyright holders concerned.
This publication is available at https://www.gov.uk/government/publications/water-and-sewerage-companies-in-england-environmental-performance-report-2019/water-and-sewerage-companies-in-england-environmental-performance-report-for-2019
A summary of the environmental performance of the 9 water and sewerage companies operating in England.
1. Chair’s foreword
This report is about the 9 water and sewerage companies that provide clean (drinking) water and waste water (sewerage) services. These services are vital for people, the economy and, what this report is about, the environment.
Last year’s report made clear that performance was unacceptable across the sector, this report shows performance deteriorated for the second year in a row. This comes soon after England’s shocking water classification results showed just 16% of water bodies meet the criteria for Good Ecological Status against 25 Year Environment Plan’s target of 75%. Of course water quality is not the sole responsibility of the water companies, but today is not the day for whataboutery.
The sector as a whole has now moved further away from the performance expectations for 2015 to 2020 the Environment Agency set out in 2013; 4 out of the 9 water companies are now rated as poor or requiring improvement, the worst result since 2011. South West Water has never got above a 2 star rating and the number of serious pollution incidents continued to plateau, although this was not geographically uniform: over half were due to Anglian Water and Thames Water.
I will be meeting water company chairs in the coming weeks to make it clear that we expect much more. This includes developing, publishing and implementing specific Pollution Incident Reduction Plans by the end of this year to reduce pollution incidents. We will closely follow the delivery of these plans and will apply tough regulation to ensure companies stick by them.
We know the sector can do better because some companies are. Severn Trent Water and Wessex Water have achieved the highest level of performance, and United Utilities were the best performing company for serious pollution incidents for the second year in a row. These 3 companies consistently score highly, as they rightly tell their shareholders. It’s important to recognise good practice, not doing so risks alienating the dedication, expertise and investment we all need to learn from.
Beyond 2020
The online sections of the Detailed River Network say the length of river in England (that is draining to the sea, not including disconnected drains) is 240,631km. The government estimates England’s waters to be worth £39.5 billion. In England £5 billion is being spent annually to protect public health, improve the environment and prevent deterioration, for example through the upkeep of sewage treatment plants. Annually, the Environment Agency have £62 per km of river to spend on non-charge funded catchment management activities, including environment monitoring, environment planning, working with catchment partnerships, farming inspections, and responding to pollution incidents (one every 45 minutes).
The 25 Year Environment Plan’s ambition for clean and plentiful water is achievable but we need to transform the nation’s approach to water and provide visible cross-sector and independent leadership in water management, setting a vision for a water future and what is needed to deliver it.
At a local level the ongoing bathing river consultation for the River Wharfe could indicate a step change in this. Bathing water designations in rivers would take time and investment to achieve safely, but can be done if that’s what people want. In the early 1990s, just 28% of bathing waters met the highest standards. Last year, 98.3% of bathing waters met or exceeded the minimum standard to protect health and more than 70% achieved the excellent standard.
Since the Environment Agency was established in 1995 serious water pollution incidents caused by water companies have been cut by 90%, from 522 in 1995 to 52 in 2019. Treated wastewater going back into rivers is much cleaner now (40% less phosphates, 70% less ammonia and 50% less cadmium and mercury) and we have returned 47 billion litres of water a year back to the environment, while maintaining the secure water supplies that communities and businesses rely on, by controlling abstractions. These long term improvements happened because of dedication and investment from those we regulate, which is why the last 2 years’ EPA reports are so disappointing.
But, there is room for optimism. There are many people in the water sector who share our commitment to public service. The water industry is the first sector in the UK to commit to net zero carbon emissions by 2030 and it plans to plant 11 million trees. Clean and plentiful water is getting harder to achieve with climate change and population growth. No country on earth has got to grips with those challenges yet, but if the UK is to lead the world at COP26 the government will need to point to examples of best practice within our own shores, and also call out those holding back our collective ambitions. You can find examples of both in this report.
Emma Howard Boyd, Environment Agency Chair
2. Performance messages for 2019
This report is about the 9 water and sewerage companies (called water companies in this report) that provide clean (drinking) water and waste water (sewerage) services. There are also a number of water only companies providing only drinking water, and a number of companies providing drinking water and sewerage services on a localised basis. These are not covered in this report.
In 2019, water company performance deteriorated for the second year in a row. From 2011, when we first introduced the Environmental Performance Assessment (EPA), to 2017 there was a trend of gradual improvement. However, the sector has now moved further away from the performance expectations for 2015 to 2020 which the Environment Agency set out in 2013.
For 2019, we provide these main performance messages for the sector:
- there was a drop in EPA performance with 1 company rated as 1 star (poor) and 3 companies rated as 2 star (requiring improvement) and only 2 companies achieving the highest 4 star rating (industry leading)
- the total number of pollution incidents was the highest since 2014 - Southern Water more than doubled their reported number of pollution incidents compared to 2018
- serious incidents continued to plateau although over half were due to Anglian Water and Thames Water
- incident self-reporting continued to improve at 80%, with 7 of the 9 companies performing well
- discharge permit compliance for sewage treatment works (STW) remained good at 99.0%, however for water treatment works (WTW), although improving, was significantly lower at 95.8%
- we assessed water company sludge performance data but continued to suspend the sludge disposal and use metric
- 98.4% of planned environmental improvement schemes were delivered against Asset Management Plan (AMP) targets, the lowest percentage delivery in this 5 year AMP period
- Anglian Water marginally failed to achieve a score of 100 for the Security of Supply Index (SoSI) for water availability
3. Environmental Performance Assessment
Please see the EPA results for 2019 and a summary of previous EPA results. Company specific data for 2011 to 2019 is also available.
We introduced the EPA as a tool for comparing performance between water companies and across years. The EPA forms part of a wider assessment of performance, including current year-to-date data that we consider during annual performance meetings with the companies. The EPA metrics measure performance associated with:
- reducing pollution incidents and increasing company reporting of incidents
- complying with discharge permits for sewage treatment and water treatment works
- delivering environmental improvement schemes
- providing secure supplies of water (‘security of supply’)
We have suspended the sludge disposal and use metric. Instead we include an update on our compliance assessment approach.
Please refer to our EPA metric guide for more information on our regulation and how we set our targets. It includes our definition of red, amber and green status and thresholds for each metric.
4. Our performance expectations (2015 to 2020)
In 2013 we set out our expectations to the water companies in a number of areas, including their operational performance. We have the following expectations of companies that are directly relevant to the EPA:
- a plan in place to achieve 100% compliance for all licences and permits
- a reduction in category 1 and 2 pollution incidents, trending towards zero by 2020
- a trend to minimise all pollution incidents (category 1 to 3) by 2020 with at least a third reduction compared to 2012
- high levels of self-reporting of pollution incidents with at least 75% of incidents self-reported by 2020
- that management of sewage sludge treatment and re-use should not cause pollution and must follow the Sludge (Use in Agriculture) Regulations and the Code of Practice for Managing Sewage Sludge, Slurry and Silage or Environmental Permitting Regulations
- environmental improvement schemes to be planned well and delivered as agreed, for example AMP and water resources management plans (WRMPs)
- security of supply outcomes to be achieved as defined in WRMPs
The majority of water companies have translated our expectations into company performance commitments and associated Outcome Delivery Incentives for their 2015 to 2020 business plans. In 2017 we set out our performance expectations for 2020 to 2025 (Water Industry Strategic Environmental Requirements, WISER). This describes the environmental, resilience and flood risk obligations that companies must take into account when developing their business plans for the next AMP period (2020 to 2025).
5. Pollution incident performance
Pollution incidents lead to the release of harmful substances into air, land or water, and some can cause significant harm to the environment. We categorise all incidents based on their impact. Incidents are assessed as having a major (category 1), significant (category 2), or minor (category 3) impact on the water environment.
The 2019 performance data shows that the sector needs to make substantial improvements to meet our expectations for both serious (category 1 and 2) and total (category 1 to 3) pollution incidents. You can find details of how we are taking action with the water companies in the regulatory interventions section.
5.1 Serious pollution incidents
The number of serious water quality pollution incidents from water company sewerage and clean water assets continued to plateau (Figure 1). This is contrary to our expectation that sector incidents trend to zero by 2020. In 2019:
- numbers improved slightly to 52, compared to 56 in 2018
- 3 companies (Anglian Water, Northumbrian Water and Thames Water) saw an increase in serious incidents compared to 2018
- United Utilities again achieved the best performance being the only company to have no serious pollution incidents
Figure 1. Number of serious pollution incidents (category 1 and 2) and trend for the 9 water companies 2005 to 2019
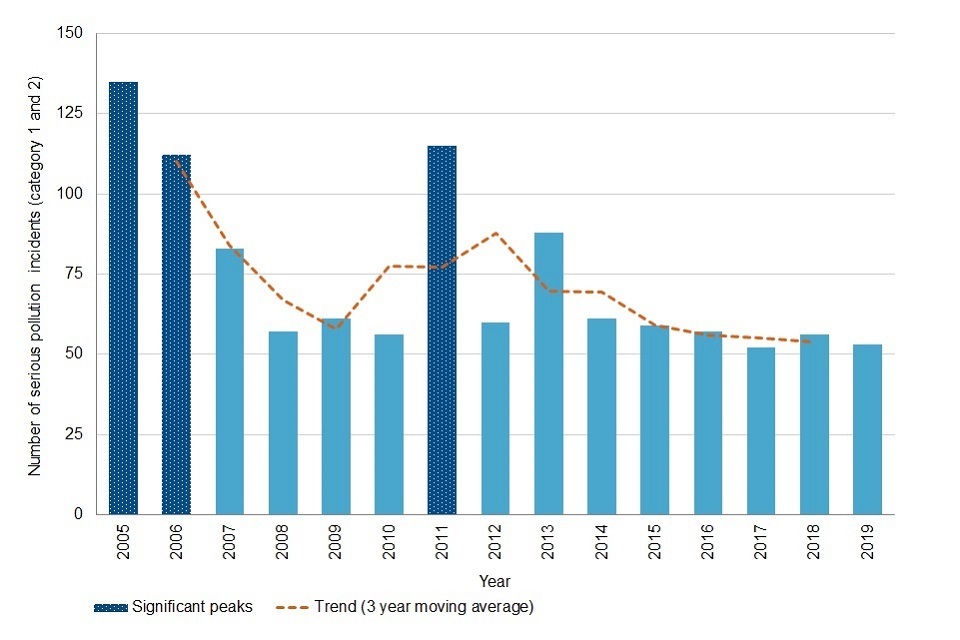
Significant peaks in serious pollution incidents 2005, 2006 and 2011 – all with over 100. Last 6 years 2014 to 2019 similar between 52 and 61. Trend line shows 3 year moving average declined between 2012 and 2015, and again slightly between 2015 and 2018.
The number of serious water quality pollution incidents from water company sewerage assets continued to be unacceptable. In 2019:
- there were 48 serious pollution incidents, the same number as in 2018
- more than half of the incidents were from the assets of 2 companies (Anglian Water - 12 and Thames Water - 15)
- 2 companies (Anglian Water and Southern Water) were both significantly below target (red) for this EPA metric
- only 3 companies (Severn Trent, United Utilities and Wessex Water) achieved performance better than targeted (green) for this EPA metric
We observed a further improvement in the number of serious water pollution incidents from water company clean water assets. In 2019:
- there were 4, compared to 8 in 2018, against the record high of 14 in 2017
There was no improvement in the number of the most serious incidents from water company sewerage and clean water assets that cause a major impact (category 1). In 2019:
- there were 11, compared to 9 in 2018, and the lowest ever levels of 4 per year in 2014 and 2015
- 10 were from sewerage assets and 1 from a clean water asset
The high performance from United Utilities shows it is possible for water companies to have a consistent and faster trend to zero. There remains a clear need for the sector to continue to invest in reducing pollution incidents and share best practice.
5.2 Total pollution incidents
The total number of water pollution incidents from sewerage and clean water assets increased compared to 2018 (Figure 2). Our performance expectation for 2020 is for water companies to achieve at least a third reduction in pollution incidents compared to 2012. We are disappointed that the sector almost achieved this in 2018 but with the increase in pollution incidents in 2019 has now moved further away from the target (only 21% reduction from 2012). In 2019:
- there were 2,204, an increase from 1,863 in 2018 and 1,827 in 2017, and the highest number since 2014
- numbers for Southern Water more than doubled (458) compared to 2018 (188), contributing the majority of the increase across the sector in 2019
- only 2 companies reduced pollution incidents compared to the year before (Severn Trent Water and Yorkshire Water)
Figure 2. Number of pollution incidents (category 1 to 3) and trend for the 9 water companies 2005 to 2019
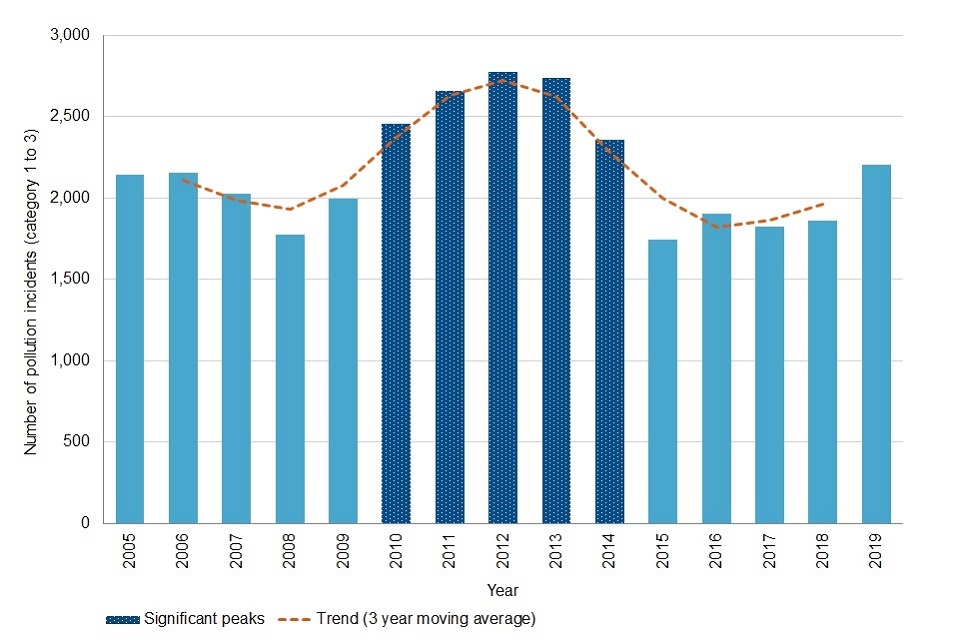
Significant peaks for 5 years 2010 to 2014 – all with over 2250. Lowest 1742 in 2015. 2204 in 2019 highest number since 2014. Trend line shows 3 year moving average declining since significant peaks 2010 to 2014, then rising slightly since a low in 2016.
Pollution incidents from water company sewerage assets were at their worst since 2014. In 2019:
- there were 1,952, a rise from 1,623 in 2018
- the performance of 6 water companies deteriorated compared to the year before, and 2 were significantly below target (red) for this EPA metric (Southern Water and South West Water)
- only 2 companies achieved green for this EPA metric (Northumbrian Water and Wessex Water)
If all companies were to achieve green status the sector would have at least 32% fewer incidents than reported in 2019.
5.3 Self-reporting of incidents
Incident self-reporting (when a water company reports a pollution incident to us before others do) was at its highest ever level. In 2019:
- 80% of recorded incidents were self-reported by the water companies, an improvement from 76% in the previous 2 years
- 7 of the companies were green for this EPA metric - the 2 companies that did not achieve green performance were Anglian Water and Yorkshire Water
- United Utilities achieved the best performance in the sector, self-reporting 90% of their incidents
6. Compliance with licences and permits
All water companies have licences and permits with conditions to control the level of impact they are allowed to have on the environment. We set conditions based on the nature and sensitivity of the local environment and expect companies to be 100% compliant with them. You can find details of how we are taking action with the water companies in the regulatory interventions section.
6.1 Discharge permit compliance
Overall compliance with STW and WTW permits (discharge numeric quality conditions) remained similar to recent years. In 2019:
- compliance was 98.7% compared to 98.6% in the previous 3 years
- out of 3,848 STW and WTW there were 49 sites that failed to comply with their permit (Figure 3)
- only 2 water companies (Severn Trent Water and Thames Water) achieved green performance for this EPA metric, a deterioration compared to 4 in 2018 and 3 in both 2017 and 2016
- Northumbrian Water deteriorated from green status in 2018 (1 failing site) to red status in 2019 (6 failing sites) - 3 of the failures were due to sample shortfalls associated with laboratory analysis not meeting quality control standards and are not associated with any known environmental impact
Figure 3. Number of STW (and from 2016 including WTW) failing discharge permit numeric limits and trend for the 9 water companies 2005 to 2019
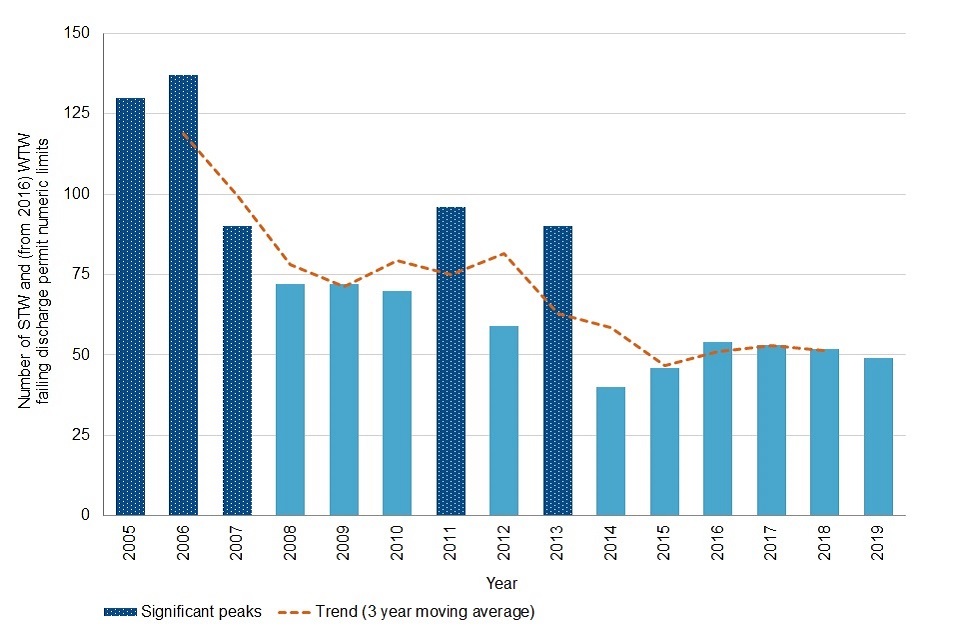
Significant peaks 2005 to 2007, 2011 & 2013 – 90 or over failing sites. 6 lowest values last 6 years: 40 in 2014, 46 in 2015 (STWs), 54, 53, 52 & 49 (STWs & WTWs) in 2016, 2017, 2018 & 2019. Trend line shows 3 year moving average declined since 2006.
As with waste water from STW, adequate treatment of discharges from WTW is essential to make sure they do not pollute the receiving environment. We are still concerned that the whole sector needs to improve and maintain WTW performance. In 2019:
- WTW compliance was only 95.8% compared to 98.9% at STW, although 3 companies had 100% compliance at WTW (South West Water, Thames Water and United Utilities)
- out of 3,565 STW, 37 were non-compliant, 3 less than in 2018, with 5 companies achieving the same or better compliance and 2 companies (Severn Trent Water and Thames Water) only having 1 failing site
- out of 283 WTW, 12 were non-compliant, the same as in 2018 compared to 13 in 2017 and 20 in 2016
6.2 Abstraction and impoundment licence compliance
Water companies hold abstraction and impoundment licences that allow them to abstract water from the environment or impound water. In 2019:
- out of 1,227 licences, 14 were recorded as non-compliant (98.9% compliance)
6.3 Waste permit compliance
Water companies operate a variety of waste facilities ranging from biowaste treatment, landfill, biogas combustion, sludge incineration and transfer stations. For permitted activities we assessed compliance during 2019 and allocated a compliance band of between A (good) to F (poor). In 2019:
- 1 permitted operation was assessed as a band E (Thames Water) and one as a band D (Severn Trent Water), an improvement from 2018 when there were 2 band E and 4 band D operations
- there were 11 minor impact (category 3) incidents compared to 12 in 2018 mostly related to odour, failure to contain sewage sludge or release of biogas
7. Sludge disposal and use
For 2019 we carried out another in-depth assessment of water company sewage sludge disposal and use. We reviewed data to check compliance with the Sludge (Use in Agriculture) Regulations, the Environmental Permitting Regulations and the water industry voluntary Safe Sludge Matrix. As in 2018, we found practices that were difficult to assess for compliance. Therefore we have published a time limited regulatory position statement with conditions enabling the supply, storage and spreading of sewage sludge containing other materials (published on GOV.UK in January 2020). We have also developed a strategy for safe and sustainable sludge use (published on GOV.UK in March 2020). This strategy explains our longer term aim to develop the Environmental Permitting Regulations for use in sludge regulation.
For 2019, we continued to suspend the EPA sludge disposal and use metric. We continue to assess water company sludge disposal and use and are enabling innovation to achieve good environmental outcomes. We are developing a revised EPA metric, in liaison with the water companies, for assessing sludge disposal and use from 2021 onwards.
8. Progress with environmental improvement schemes
This EPA reports on the cumulative 5 year progress companies have made delivering their National Environment Plan (NEP) up to the end of March 2020. This was the final year of the AMP6 programme (2015 to 2020) and our expectation was for all schemes to be delivered as planned. For the year to the end of March 2020:
- only 98.4% of planned schemes were completed within their deadlines. Sector performance deteriorated to its worst since EPA reporting began
- Southern Water were significantly below target (red), reporting delivery of only 90% of their planned programme with 23 schemes not completed on time
- South West Water were also below target (amber), reporting delivery of 97.4% with 4 schemes not completed on time
- only 3 companies (Anglian Water, Northumbrian Water and Wessex Water) reported 100% delivery of their programme within planned deadlines compared to 8 companies in 2018
Each company was funded through their NEP to install event duration monitoring (EDM) on the majority of their storm overflows. This does not form part of the EPA NEP delivery metric. Across the sector there are about 15,000 storm overflows operated by water companies. By the end of 2019 companies were reporting on 7,762 storm overflows.
9. Security of water supply
The EPA Security of Supply Index (SoSI) metric compares forecast water available for supply with actual customer demand.
For the period April 2019 to March 2020:
- 8 of the 9 water companies reported a score of 100 and green status in the EPA
- Anglian Water had amber status having reported a score of 99
10. Water resources planning
10.1 Restoring sustainable abstraction (RSA)
Between April 2008 and March 2020, the Environment Agency has been investigating and changing permanent abstraction licences that cause environmental damage, reduce biodiversity and reduce ecosystem resilience. By the end of March 2020 the RSA Programme had:
- delivered 135 water company licence changes which included 20 during 2019 and 21 between January and March 2020 (there were 11 licence changes that we had to delay due to their complexity and impacts on staff resources due to coronavirus (COVID-19))
- prevented water companies from abstracting over 18 million cubic metres of water from sensitive and fragile habitats each year
- removed the risks posed by abstraction for at least a further 137 million cubic metres of water each year (by removing unused quantities from water company abstraction licences)
Through the RSA programme we have taken action to protect chalk aquifers and streams. Since 2008, we have:
- prevented water companies from abstracting 12 million cubic metres of water from chalk aquifers and streams each year
- removed the risks posed by abstraction of another 62 million cubic metres of water each year from chalk aquifers and streams (by removing unused quantities from water company abstraction licences)
10.2 Water resources management plans
All water companies report annually on progress with implementing their WRMPs. We review these and report our findings to Defra (Department for Environment, Food and Rural Affairs). This report provides information for April 2018 to March 2019 and April 2019 to March 2020. In these 2 years there was an overall improvement by the water companies for leakage, metering and per capita consumption (PCC) levels.
From April 2018 to March 2019:
- Southern Water and Thames Water had significant issues with the delivery of their WRMPs, with both having higher than forecast outage (assets not in operation) and leakage
Southern Water has identified the causes of high outage and has invested in reducing leakage. For Thames Water the issues were primarily due to high leakage levels in its London water resource zone and a large outage at its desalination plant. Thames Water has more recently been reporting lower leakage and has confirmed plans to upgrade the desalination plant. We expect Southern Water and Thames Water to continue to address these issues and meet their forecast level each year.
From April 2019 to March 2020:
- South West Water had significant issues with PCC - in one tourism-heavy water resource zone they have a small proportion of unmetered properties with PCC double that of the national average
- Southern Water’s Sussex North and Northumbrian Water’s Kielder water resource zones reported supply-demand deficits due to unplanned outage
- Thames Water made steady progress in addressing the significant leakage and outage issues from the previous year
Ofwat (the economic regulator of the water sector in England and Wales) has set a target for all water companies to meet a 15% reduction in leakage by the end of March 2025. On average water companies have planned for a 16% reduction in their 2020 WRMPs. We expect them to explore innovative approaches to further reduce leakage. This should be in line with the 2018 National Infrastructure Commission’s report on England’s Water Infrastructure Needs and Water UK’s commitment to reduce leakage by 50% by 2050.
From April 2018 to March 2019:
- total leakage for all water companies was 2,427 megalitres per day, similar to 2,450 and 2,400 megalitres per day in the previous 2 years
- several water companies reported far higher leakage than forecast (Southern Water and Thames Water both reported leakage over 10% higher than forecast)
From April 2019 to March 2020:
- total leakage for all water companies was 2,290 megalitres per day, a substantial reduction compared to previous years, and well below the forecast for the year
- Thames Water reduced leakage to almost 90 megalitres per day below forecast (13% below forecast)
All water companies have a planned metering programme.
From April 2018 to March 2019:
- household metering including unoccupied properties was at 52%, an increase from just over 50% the previous year
- only Northumbrian Water achieved their planned level of metering whilst Southern Water, Thames Water and Wessex Water were all more than 6% below their planned level of metering
From April 2019 to March 2020:
- household metering including unoccupied properties was at 53.9%, an increase from just over 52% the previous year
- Anglian Water, Northumbrian Water and South West Water all achieved their planned level of metering, with Southern Water only slightly below their planned level of metering
The main reasons given for metering shortfalls were fewer than expected new property builds and lower than expected optional metering uptake. We expect any company that is behind to take action to deliver their planned metering programme.
The summer of 2018 was particularly hot and dry. Most water companies saw peaks of demand that were more than they had planned for in a dry year. We expect to see continued improvements in the efficient use of water in England. We are working with the government and the water industry to set an ambitious personal consumption target that will help implement the government’s 25 year environment plan.
From April 2018 to March 2019:
- average household PCC was 141 litres per head per day, a slight increase from just under 139 litres per head per day the year before
- Anglian Water, Severn Trent Water, South West Water, United Utilities and Wessex Water all reported significantly higher than forecast PCC
- Southern Water, Thames Water and Yorkshire Water reported PCC lower than forecast
From April 2019 to March 2020:
- average household PCC was 137.5 litres per head per day, a decrease from 141 litres per head per day the year before
- South West Water reported PCC significantly higher than forecast
- Anglian Water, Severn Trent Water and Southern Water reported PCC lower than forecast
11. Flood and coastal erosion risk management (FCERM)
Between April 2019 and March 2020, water companies invested:
- £132 million to reduce the risk of sewer flooding to properties
- £300 million to maintain the public sewer system to prevent blockages and flooding
- £2 million in property-level protection and mitigation measures to reduce the likelihood of customers’ homes experiencing sewer flooding
Under the Flood and Water Management Act 2010, water companies are risk management authorities (RMAs). This means they have to act in a manner consistent with the National FCERM strategy for England and have a duty to cooperate with other RMAs. Between April 2019 and March 2020 water companies have:
- developed their drainage and wastewater management plans, specifically the strategic context and baseline risk assessments
- finalised their price review 2019 business plans
- shared data with other RMAs to support flood risk assessments and produce integrated drainage models to better understand the risk of flooding
- worked with partners to reduce flood risk to communities and enhance the environment
- enhanced the resilience of their networks and services to flooding
- exercised incident management and winter preparedness plans
- continued to innovate and share good practice
- continued to discharge their reservoir safety responsibilities
There have been good examples of partnership working this year, including:
- Severn Trent Water and Nottinghamshire County Council’s Strategic Scheme for Newark, completed in 2020 after an investment of nearly £60 million, reducing flood risk for approximately 400 homes and businesses
- Wessex Water and Bristol City Council’s RESilience to Cope with Climate change in Urban arEas project, an EU funded partnership project to develop a resilience action plan for the City of Bristol
- Thames Water and London Borough of Hammersmith and Fulham’s Counters Creek Flood Alleviation scheme helping to protect 1,230 properties from basement sewer flooding
Water companies are responsible for the safety of their reservoirs. Following the partial spillway failure incident at Toddbrook reservoir (Whaley Bridge) in August 2019, government commissioned an independent review of reservoir safety. They reported on the review in March 2020. We will continue to work with water companies to deliver the review recommendations and support them to maintain a high standard of reservoir safety.
The new National FCERM strategy for England will provide the framework for all RMAs including water companies. It will improve the resilience of the water industry to the risk of flooding and coastal change. The strategy includes measures on drainage and sewerage management plans and long-term adaptive planning for flooding and coastal change.
12. Regulatory interventions
We are taking action against the water companies by challenging them to address areas where they are failing or not meeting our performance expectations. We describe these actions in the following sections.
12.1 Enforcement and sanctions
Taking enforcement action and imposing sanctions are intended to deter operators from committing further offences in the future. The Environment Agency enforcement and sanctions policy sets out how we conduct enforcement activity in relation to environmental offences and breaches of permits. The formal options we have include a written warning, enforcement notices, issuing a formal caution, undertaking a prosecution or accepting an Enforcement Undertaking (EU) offer. An EU is a voluntary agreement offered by those who have committed a less serious offence that becomes legally binding once accepted. It funds local environmental improvements but also requires that steps are taken to put right what went wrong and to prevent it happening again.
Before taking action we must investigate to gather evidence, consider the facts and establish matters relevant to public interest and sentencing. This takes time and our enforcement activity can conclude some months or years after the original offence occurred, particularly court cases. In 2019:
- we brought 4 successful prosecutions against 4 of the water companies which resulted in total fines of £1,297,000 being imposed
- prosecution fines ranged from £44,000 to £607,000
- we accepted 11 EU offers from water companies totalling £2,429,760, ranging from £25,000 to £511,000
By the end of 2019 we had 10 further prosecutions in court, or authorised for taking to court in 2020.
Enforcement and sanctions for the 9 water companies 2015 to 2019
| Year | Number of prosecution cases | Value of prosecution fines | Number of cases receiving formal caution | Number of enforcement undertakings | Value of enforcement undertakings |
|---|---|---|---|---|---|
| 2015 | 9 | £2,494,500 | 22 | 0 | £0 |
| 2016 | 10 | £6,560,000 | 12 | 4 | £610,000 |
| 2017 | 16 | £21,589,334 | 8 | 15 | £1,435,900 |
| 2018 | 5 | £2,227,000 | 1 | 15 | £3,432,150 |
| 2019 | 4 | £1,297,000 | 0 | 11 | £2,429,760 |
12.2 Improving water company performance
It is the responsibility of water companies to comply with the law and to avoid polluting the environment. As the environmental regulator we want to promote excellence and take effective action to correct poor performance.
In the last 2 years we have not seen the reduction in pollution incidents that we or the public expect. We have therefore requested that in 2020 all water companies develop, publish and implement Pollution Incident Reduction Plans. We will scrutinise and monitor their delivery and challenge companies where necessary to ensure they achieve the required reductions.
We will also:
- send a letter from our Chair to the Chairs and key shareholders of each company identifying good and poor performance and presenting our future expectations
- with Ofwat, ensure water company performance is understood and transparent, and bring poor performers up to our expectations, including through financial penalties where appropriate
- with Ofwat, continue to support the investment needed to ensure clean and plentiful water over the coming decades
- prosecute water companies that fail to uphold the law or cause serious environmental harm
These actions build on a programme that seeks to toughen our regulation of the water companies. The programme places greater emphasis on getting to the root cause of non-compliance and pollution incidents.
These changes will not take effect overnight. They will require water companies to adopt cultural shifts and make significant investment. We will continue to press and hold them to account to make the improvements we and the wider public require.
12.3 Partnership and innovation
As a modern regulator, we use an ‘earned recognition’ approach. This encourages and recognises better performance for those companies who comply with regulation and consistently perform well. We work with these companies to promote partnership and innovation. We also use influence, advice and other complementary approaches to achieve more environmental outcomes whilst reducing the regulatory burden on water companies.
There have been good examples of best practice in 2019 including:
- Severn Trent’s ‘Zero pumps out’ project that focuses on reducing the risk of spillages and pollution caused by pumps that are out of service
- 2 wetlands at Durleigh and Cromhall constructed by Wessex Water to act as natural filters to improve water quality, provide flood attenuation and support natural habitats and biodiversity
13. Conclusions and forward look
The performance of some water companies in 2019 has been unacceptable once again and as a result we are taking action. We require all companies to make successful interventions where they are not meeting our expectations and, for some, this will require radical improvement.
We are disappointed that 4 of the companies were poor or require improvement. We have not had this many 1 or 2 star companies since 2011. Southern Water was the worst performing company because they were significantly below target for half of the metrics. They are the only company rated as 1 star (poor) since 2015. South West Water have consistently failed to improve their environmental performance over many years. We are taking appropriate action against these companies and discussing interventions with Ofwat.
Only Severn Trent Water and Wessex Water achieved the highest level of performance (industry leading) which we expect all companies to achieve and maintain. Variation between companies has increased. We need all companies to recognise and address aspects of poor environmental performance so that they all achieve leading status and can maintain it.
We will continue to use and develop our regulatory interventions to turn water company performance around and align better with our expectations. As we move into the next investment period the EPA remains our primary tool to assess performance annually and benchmark companies consistently. We are looking to strengthen and broaden our reporting mechanism and toughen our regulation to ensure the best outcome for the environment.