Wastewater testing coverage data for the Environmental Monitoring for Health Protection (EMHP) programme
Published 3 March 2022

© Crown copyright 2022
This publication is licensed under the terms of the Open Government Licence v3.0 except where otherwise stated. To view this licence, visit nationalarchives.gov.uk/doc/open-government-licence/version/3 or write to the Information Policy Team, The National Archives, Kew, London TW9 4DU, or email: psi@nationalarchives.gov.uk.
Where we have identified any third party copyright information you will need to obtain permission from the copyright holders concerned.
This publication is available at https://www.gov.uk/government/publications/wastewater-testing-coverage-data-for-23-february-2022-emhp-programme/wastewater-testing-coverage-data-for-the-environmental-monitoring-for-health-protection-emhp-programme
Background on the EMHP wastewater surveillance programme
People who have had COVID-19 shed the virus during daily activities such as going to the toilet and blowing noses. The virus enters the sewer system through sinks, drains, and toilets. Fragments of the SARS-CoV-2 virus (the virus that causes COVID-19) can be detected in sewage samples.
The EMHP programme – led by the UK Health Security Agency (UKHSA) and run in partnership with Defra, the Environment Agency, CEFAS, academia and water companies – tests sewage in England for fragments of SARS-CoV-2 RNA. Samples are taken from sewage flowing into wastewater treatment plants and from key locations across the sewer network (manholes) on a daily basis.
The programme helps identify where the virus is circulating in England, detecting spikes in prevalence. It has the benefit of detecting the virus in asymptomatic individuals.
The programme now plays an important role in the detection of mutations of the virus, variants of concern (VOCs) and variants under investigation (VUIs). This is done through genomic sequencing of wastewater samples to provide an indication of where VOCs and VUIs may be present across England. The wastewater surveillance programme routinely sequences samples from sewers across the country to provide a national and local view of the presence of mutations and variants. Insights from wastewater testing are shared with local and national decision-makers.
Over time, EMHP wastewater sampling sites have been changed and others have been added to optimise the programme’s coverage. Since the last EMHP population coverage publication on 10 June 2021 (based on coverage on 19 May 2021), the population coverage of the programme has increased by approximately 4%. The programme now provides coverage to approximately 74% of the population of England. The EMHP team coordinates with programmes in the devolved administrations to provide UK-wide wastewater monitoring.
Wastewater testing coverage data
Population coverage estimates are produced by matching Lower Layer Super Output Areas (LSOAs) and their associated populations to wastewater catchments. There are several sources of uncertainty in these estimates, for example in how LSOAs are matched to the catchments and uncertainty about catchment boundaries (see Methodology section for further information). EMHP estimates this uncertainty in wastewater catchments to be approximately ± 15%.
Table 1 shows the percentage of each regional population in England covered by wastewater sampling (based on coverage on 23 February 2022). The estimated population coverage of wastewater surveillance across England is 74%. This ranges across the regions from 61% in the South West and the South East to 79% in the North East and 100% in London.
Figure 2 shows the percentage of lower tier local authority (LTLA) populations covered by wastewater sampling. This ranges from 0% (often in particularly rural areas) to 100%. Median coverage of LTLAs is 76%.
This data and data for LTLA are available in the accompanying spreadsheet.
Table 1: Percentage of regional populations covered by EMHP wastewater sampling on 23 February 2022
| Region | Wastewater testing coverage population estimates | Region population estimates | Estimate of regional population covered by wastewater testing (%) |
|---|---|---|---|
| North East | 2,100,000 | 2,670,000 | 79% |
| North West | 5,585,000 | 7,341,000 | 76% |
| Yorkshire and The Humber | 4,066,000 | 5,503,000 | 74% |
| East Midlands | 3,301,000 | 4,836,000 | 68% |
| West Midlands | 4,491,000 | 5,934,000 | 76% |
| East of England | 4,380,000 | 6,236,000 | 70% |
| London | 8,952,000 | 8,962,000 | 100% |
| South East | 5,578,000 | 9,180,000 | 61% |
| South West | 3,454,000 | 5,625,000 | 61% |
| England | 41,906,000 | 56,287,000 | 74% |
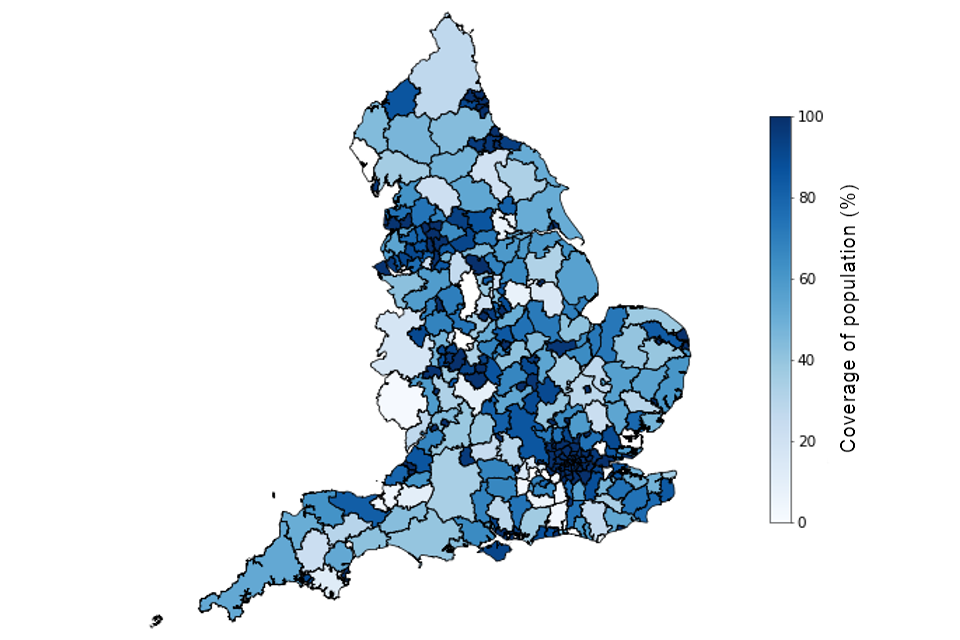
Figure 1: Percentage of LTLA populations covered by EMHP wastewater sampling on 23 February 2022
Table 2 shows the percentage of each Index of Multiple Deprivation (IMD) decile in England covered by wastewater sampling (based on coverage on 23 February 2022).
Deciles are calculated by ranking the 32,844 neighbourhoods in England from most deprived to least deprived and dividing them into 10 equal groups (that is, each containing 3,284 or 3,285 neighbourhoods). These deciles range from the most deprived 10% of neighbourhoods (decile 1) nationally to the least deprived 10% of neighbourhoods nationally (decile 10).
The estimated population coverage of wastewater surveillance for the most deprived areas (decile 1) in England is 91%.
Figure 2 shows the percentage of population in each IMD decile, by region, covered by wastewater sampling. Similar to the trend seen across England, in all regions except London (where coverage is 100%) wastewater population coverage is higher for the more deprived areas (deciles 1 to 5) than for the less deprived areas (deciles 6 to 10).
This data is available in the accompanying spreadsheet.
Table 2: Percentage of population in each IMD decile covered by EMHP wastewater sampling on 23 February 2022
| IMD decile | Wastewater testing coverage population estimates | IMD decile population estimates | Estimate of IMD decile population covered by wastewater testing (%) |
|---|---|---|---|
| 1 (most deprived) | 5,091,000 | 5,588,000 | 91% |
| 2 | 4,991,000 | 5,677,000 | 88% |
| 3 | 4,996,000 | 5,810,000 | 86% |
| 4 | 4,513,000 | 5,767,000 | 78% |
| 5 | 4,037,000 | 5,693,000 | 71% |
| 6 | 3,883,000 | 5,734,000 | 68% |
| 7 | 3,764,000 | 5,564,000 | 68% |
| 8 | 3,779,000 | 5,554,000 | 68% |
| 9 | 3,598,000 | 5,487,000 | 66% |
| 10 (least deprived) | 3,254,000 | 5,414,000 | 60% |
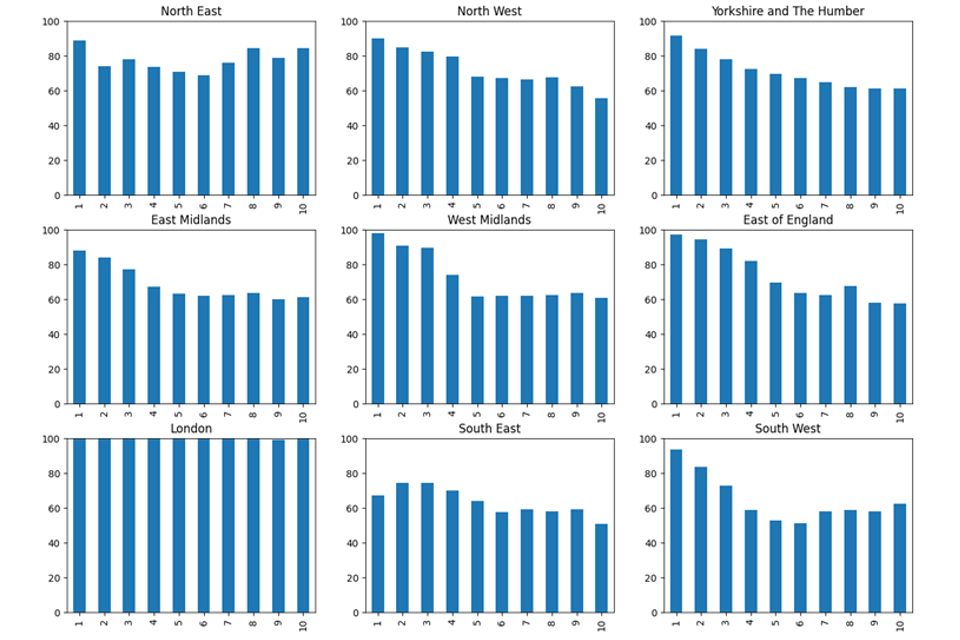
Figure 2. Percentage of population in each Index of Multiple Deprivation (IMD) decile, by region, covered by EMHP wastewater sampling on 23 February 2022
- y axis: population coverage (%)
- x axis: IMD decile (1 = most deprived; 10 = least deprived)
Methodology
About this data
The population coverage estimates reflect the population covered by wastewater catchments where the EMHP programme samples wastewater and tests for SARS-CoV-2. The estimates represent a snapshot of the coverage of wastewater surveillance as of 23 February 2022.
Data sources
The population estimates of regions, LTLAs and LSOAs – a standard ONS geography – with each LSOA containing approximately 1,500 people are ONS estimates and are mid-2019 estimates of population. The population-weighted centroids of LSOAs used in the LSOA-to-catchment matching algorithm (see Estimating wastewater testing population coverage) are also sourced from ONS.
The IMD deciles are produced by ONS and are calculated nationally. Each LSOA is assigned a decile from 1 (most deprived) to 10 (least deprived). There are a constant number of LSOAs in each decile but due to population variations between LSOAs the actual population in each decile varies slightly. Within a region, there are substantial differences between populations in each decile.
The catchment boundaries for sewage treatment works (STWs) were provided by the 9 water companies serving England:
- Severn Trent
- South West Water
- Southern Water
- Wessex Water
- Thames Water
- Anglian Water
- Northumbrian Water
- Yorkshire Water
- United Utilities
Estimating wastewater testing population coverage
EMHP samples at sewer network sites (manholes in the street which generally serve a local area) and STWs, which generally serve wider areas such as a city or town. A catchment, defined as an area from which wastewater flows into the sampling location, is associated with both STWs and sewer networks. Sewer network sites almost always fall within the catchment of an STW, so generally network sites do not count towards population coverage.
To estimate the population of catchments, EMHP matched LSOAs to all the catchment areas sampled (both sewer network sites and STWs). If the population-weighted-centroid of an LSOA falls within the boundary of a catchment, then the whole population of the LSOA is assigned to that catchment. If an LSOA is served by multiple sites, such as an STW and a network site, it is only counted once.
To calculate the population coverage in a region, a matching algorithm between LSOA and wastewater catchment is used to determine which LSOAs are served within a region.
The sum of the populations of the LSOAs covered by EMHP samples in the region is divided by the region population to calculate the percentage coverage for the region. Similarly, the national coverage figure is calculated by summing the population covered in every region and dividing by the population of England.
The IMD decile of each LSOA is then used to calculate the population coverage by IMD decile for England and for each region.
Uncertainty, data quality and revisions
The data presented provides a snapshot of wastewater testing coverage on 23 February 2022. The data has a degree of uncertainty and associated caveats:
- the sites from which EMHP samples from can change depending on testing capacity, epidemiological priorities and current local response activities, resulting in changes to the population covered
- the process of matching LSOAs to catchment areas is approximate – there is uncertainty in the matching process where LSOAs partially overlap the catchment boundary and this uncertainty is increased by other data quality issues and uncertainties:
- the boundaries of wastewater catchments are mostly constant but can change depending on factors such as rainfall, as storm drains divert the flow of water to different parts of the network
- catchments of a site can change, particularly as there is uncertainty about the catchment areas of STWs (given that one water company can own the STW and a different water company can own the sewer infrastructure) – this may mean that an STW serves a different catchment area to the one EHMP has assigned to it
- these data quality issues affect a minority of catchments and the EMHP is confident in most catchment boundaries
In addition, EMHP wastewater monitoring data itself is generated by non-accredited research laboratories and should be considered experimental. Formal validation of wastewater monitoring as a variant surveillance system is underway.
If any substantial revisions occur in future publications of this data, this will be outlined in the publication – the Department of Health and Social Care (DHSC) has published a revision policy for official statistics.