Universal Credit: 29 April 2013 to 9 January 2020
Published 18 February 2020
Applies to England, Scotland and Wales

© Crown copyright 2020
This publication is licensed under the terms of the Open Government Licence v3.0 except where otherwise stated. To view this licence, visit nationalarchives.gov.uk/doc/open-government-licence/version/3 or write to the Information Policy Team, The National Archives, Kew, London TW9 4DU, or email: psi@nationalarchives.gov.uk.
Where we have identified any third party copyright information you will need to obtain permission from the copyright holders concerned.
This publication is available at https://www.gov.uk/government/statistics/universal-credit-29-april-2013-to-9-january-2020/universal-credit-29-april-2013-to-9-january-2020
The latest release of these statistics can be found in the Universal Credit statistics collection.
Next release of people on Universal Credit: 17 March 2020.
Next release for claims, starts and households on Universal Credit: 19 May 2020.
The Stat-Xplore breakdown for postcode district for claims and starts to Universal Credit has been withdrawn due to an issue with the underlying data. It will be restored when a new methodology is developed.
This release contains developments to the commentary, structure and background information following a review of the bulletin. An extensive update to the background information and methodology has also been published with this release.
Feedback on these developments are welcome, together with any other views on the content, relevance, accessibility and timeliness of these statistics by sending an email to team.ucos@dwp.gov.uk.
1. Data tools accompanying this release
This bulletin presents commentary on the latest Universal Credit statistics. Alternative ways to view Universal Credit statistics are available:
- Stat-Xplore allows users to explore Universal Credit data and build their own tables. It also contains some ready-made tables
- Universal Credit claimants at Jobcentre Plus office level in an interactive map
- Households on Universal Credit at local authority level in an interactive map
- an interactive dashboard of the latest Universal Credit household statistics by region
2. Main story
People on Universal Credit
At 9 January 2020 the number of People on Universal Credit continues to grow.
Figure 1: Universal Credit continues to grow
| Month | People |
|---|---|
| January 2020 (p) | 2,800,000 |
| October 2019 | 2,500,000 |
| July 2019 | 2,200,000 |
| April 2019 | 1,900,000 |
Source: DWP Universal Credit statistics.
- Universal Credit continues to grow with 2.8 million people, up 100,000 (2%) from 12 December 2019.
- ’Searching for work’ conditionality (1.0 million; 37%) is the largest conditionality regime, but ‘no work requirements’ conditionality (700,000; 25%) is increasing at the fastest rate.
For December 2019 assessment periods:
- about one-third (36%) of the 2.8 million people on Universal Credit were in employment.
Employment is measured by earnings being received during the assessment period active on the count date. This means that earnings which determines whether someone is in employment, could have been received up to 30 days before or after the count date, 12 December 2019. The employment rate for January 2020 will be available in the next release.
Claims made to Universal Credit
Claims made to Universal Credit during 13 December 2019 to 9 January 2020:
- 160,000 claims made in the 4 weeks up to 9 January 2020.
- The number of claims received over the Christmas period was seasonally low with an average of 26,000 claims per week received between 20 December 2019 and 2 January 2020, compared with a weekly average of 40,000 for the 4 week period as a whole.
Starts to Universal Credit
Starts to Universal Credit during 13 December 2019 to 9 January 2020:
- 130,000 starts
Households on Universal Credit
Households on Universal Credit at 14 November 2019:
- 2.3 million households on Universal Credit
- 2.2 million (93%) were receiving a Universal Credit payment
- The proportion of households in-payment has levelled off at 93% since the remaining claimants on ‘live service’ were moved to ‘full service’ in March 2019
For households in payment:
- the average payment increases as Universal Credit is paid to a broader range of households, and was £720 per month in November 2019 compared to £660 in November 2018
- single person households with no child dependants received the least amount of Universal Credit on average (£490 per month), while couples with child dependant(s) received the most on average (£990 per month)
- Housing is the biggest entitlement, with 1.5 million households (65%) receiving housing support
- A growing proportion of payments are made to households with children, with 46% of households containing children and receiving the child element – this is up from 40% a year earlier
In October 2019:
- households receiving full payment on time has increased over the last year. 95% of all households that were paid received full payment on time, with 98% of households receiving at least some payment on time, compared with 89% and 96% respectively last year
- 87% of households new to Universal Credit that were paid received their full payment on time, with 92% receiving at least some payment on time
3. Things you need to know
What is Universal Credit?
Universal Credit is a single payment for each household to help with living costs for those on a low income or out of work. It is replacing 6 benefits, commonly referred to as the legacy benefits.
Support for housing costs, children and childcare costs are integrated into Universal Credit. It also provides additions for people with a disability, health condition or caring responsibilities which may prevent them from working.
Universal Credit has been rolled out in stages:
- March 2013 to December 2017: Universal Credit was available to new claimants in a limited group, mostly to 18 to 60 year old single people with no children, unemployed (typically people who would have claimed income-related Jobseekers Allowance) where the Universal Credit live service was available. Where their circumstances changed they could remain on Universal Credit.
- April 2016 to December 2018: Gradual roll out of Universal Credit full service. Where available, Universal Credit is available to new claims and people on legacy benefits whose circumstances change.
- December 2018: Universal Credit full service is available in every area of Great Britain
Read the background information and methodology document for a more detailed timeline.
Geographical coverage
Universal Credit statistics cover people on Universal Credit, households on Universal Credit, claims made to Universal Credit and starts to Universal Credit in England, Scotland and Wales (Great Britain). Universal Credit statistics for Northern Ireland are published by the Department for Communities (Northern Ireland) as social security is a devolved matter.
Data sources and limitations
These official statistics have been compiled using data in systems used by the department in the administration of Universal Credit and records of Universal Credit benefit payments made by the department.
While every effort is made to collect data to the highest quality, as with all administrative data it is dependent on the accuracy of information entered into the system. Checks are made throughout the process from collection of the data to producing the statistics, but some data entry or processing errors may filter through to the data used to produce the statistics.
As Universal Credit continues to develop, caution should be used when interpreting statistics over long time periods. Administrative system changes could cause discontinuities in the time series that were not the result of a policy decision or the economic environment.
There are inherent differences in the data for People on Universal Credit and Households on Universal Credit, thus it is not possible to cross-tabulate between the 2 measures. More information on the differences between the 2 datasets is provided in the relationship between people and households on Universal Credit section of the background note.
It is also not advisable to cross-tabulate between some measures, for example conditionality regime and the employability indicator. This is due to the method of measurement for both not lining up because of methodological differences.
A full discussion of strengths and limitations is in the background information and methodology document.
Count date
Statistics for people on Universal Credit are based on the count on the second Thursday of each month, referred to as the count date. This date is determined by the date used for the Claimant Count which some of these data feed into. For this publication the latest count date is the 9 January 2020.
Claims and starts are based on the total flow between the day after the count date for the previous month up to the count date.
Household statistics are based on the assessment periods that overlap the count date. These data are presented up to August. A longer time period is required before publishing statistics for households than statistics for people, claims and starts because data for payment information for households is subject to more retrospection.
The background and methodology document provides more information on the process of producing these statistics.
4. People on Universal Credit
The number of people on Universal Credit continues to grow
The number of people on Universal Credit at 9 January 2020 was 2.8 million. This is an increase of 2% from 12 December 2019.
Figure 2: The number of people on Universal Credit has increased at a faster rate over time
| Month – bi-annually | People on Universal Credit |
|---|---|
| January 2020 (p) | 2,800,000 |
| July 2019 | 2,200,000 |
| January 2019 | 1,600,000 |
| July 2018 | 1,000,000 |
| January 2018 | 720,000 |
| July 2017 | 550,000 |
| January 2017 | 440,000 |
| July 2016 | 320,000 |
| January 2015 | 180,000 |
| July 2015 | 86,000 |
| January 2015 | 28,000 |
Source: DWP Universal Credit statistics.
Note: See Stat-Xplore for the complete data series. Figures marked (p) are provisional; figures marked (r) have been revised since the previous release.
As the Universal Credit full service was gradually rolled out to areas across Great Britain the number of people on Universal Credit increased at a faster rate. Between January 2019 and January 2020, the number of people on Universal Credit increased by 1.2 million compared with 900,000 between January 2018 and January 2019 (figure 2).
Universal Credit full service was available in every area of GB by December 2018 when Universal Credit replaced the legacy benefits for new claims for most people. The number of people on Universal Credit has continued to increase since then as people start new claims and existing claimants’ change in circumstances move them onto Universal Credit.
Females now outnumber males on Universal Credit
Figure 3: Females on Universal Credit are increasing at a faster rate than males

Chart showing the number of males and females on Universal Credit. Males outnumber females up to May 2018. From May 2018 the number of females on Universal Credit grows at a faster rate than males
Source: DWP Universal Credit statistics.
Note: See Stat-Xplore for the complete data series.
There are more females (56%) claiming Universal Credit than males (44%) at 9 January 2020.
From the introduction of Universal Credit up until May 2018, males on Universal Credit outnumbered females on the benefit. This change in proportions is explained by Universal Credit being only available to working age individuals with no children and whom were seeking employment in the initial introduction of Universal Credit. This group of people are those that would have claimed income related Jobseekers Allowance, which is a benefit that has been typically claimed by males more than females (source: Stat-Xplore).
The broadening of Universal Credit to the people who would have claimed the other legacy benefits has led to more females than males claiming Universal Credit. These benefits, which include Income Support and Child Tax Credit, tended to have been claimed by females.
Over one-third of claimants are in employment
Universal Credit is available to people who are in work and on a low income, as well as to those who are out of work. Most claimants on low incomes will still be paid Universal Credit when they start a new job or increase their hours.
Universal Credit statistics measure employment as receiving earnings during the assessment period which is active on the count date.
As earnings for this period can be received up to 1 month after the count date, this data is not available for processing at the time other data for people on Universal Credit is available. The availability of this data means that statistics on employment for people on Universal Credit are published a month later than other statistics for people on Universal Credit.
Figure 4. Increases seen in the proportion of Universal Credit recipients in employment towards the end of each year

A line chart showing the employment rate from December 2013 to December 2019. The chart shows gradual increases during each calendar year before falling back again each January
Source: DWP Universal Credit statistics.
Note: See Stat-Xplore for the complete data series.
At 12 December 2019, there were 2.7 million people on Universal Credit, of which 980,000 (36%) were in employment at some point during the assessment period, compared to 39% (600,000 out of 1.5 million) in the assessment periods covering 12 December 2018 (figure 4).
There are seasonal trends in the employment rates of people on Universal Credit. In each year since the introduction of Universal Credit the proportion of recipients being in employment increases throughout the year with large increases in the period between October and December. In January the rate of people on Universal Credit being in employment falls.
The larger increase between October and December and fall in January coincides with increases in seasonally available work in the lead up to Christmas and holiday period (figure 4).
The employment rate for claimants on Universal Credit decreased from 37% in January 2019 to 34% in February 2019. This was the result of an update to the Universal Credit administrative system allowing ‘nil’ claims to be identified and closed. Prior to this update, some claims where the claimant had moved into employment and whose Universal Credit award was reduced to ‘nil’ as a result of their earnings were still counted in the data. For more information on this see the Background information and methodology document.
‘Searching for work’ conditionality is the largest conditionality regime, but ‘no work requirements’ conditionality is increasing at the fastest rate.
Claimants are required to do certain work-related activities to receive Universal Credit. These activities are determined by which of the 6 conditionality regimes the claimant is placed in. The conditionality regime also determines the level of contact with the claimant, and the support that they will receive.
Conditionality regime is used in Universal Credit statistics instead of terms ‘conditionality group’ and ‘labour market regime’. To help users understand the different regimes more easily, this bulletin uses different terms to the official terms for the labour market regimes. The definitions section of this bulletin provides more information on the different conditionality regimes, and their associated conditionality groups and labour market regimes.
Different members of the same household may be subject to the same or different requirements. As circumstances change claimants will also transition between different levels of conditionality. This means that there is a ‘flow’ of claimants between these groups, that is the number of claimants in each group is constantly changing in our published statistics, month to month.
Figure 5. ‘Searching for work’ conditionality regime is a decreasing proportion of Universal Credit claims as legacy benefits closed to new claims
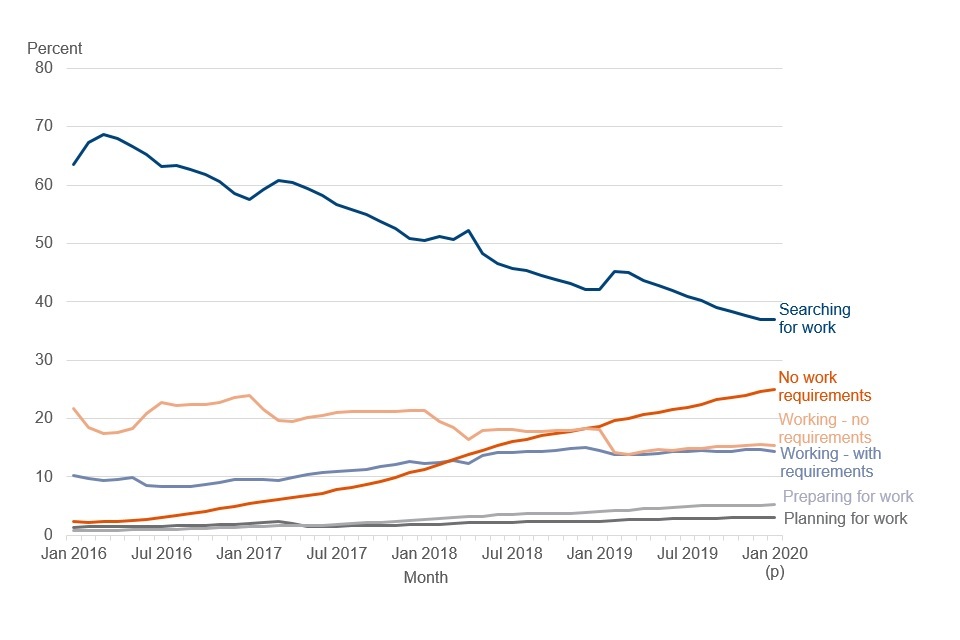
Line chart showing the proportion for each conditionality regime from January 2016 to January 2020. It shows the searching for work conditionality falling over the time period and the no work requirements conditionality increasing
Source: DWP Universal Credit statistics.
Note: See Stat-Xplore for the complete data series. Percentages may not add up to 100 due to rounding. Figures marked (p) are provisional; figures marked (r) have been revised since the previous release.
There is a decreasing trend in the proportion of people on Universal Credit in the ‘searching for work’ conditionality regime since these figures were first available in April 2015. There are now 37% in this conditionality regime, from 74% in April 2015. This is because Universal Credit was initially only available to people who were expected to be in this conditionality regime. As Universal Credit has broadened to people that would have claimed other legacy benefits through the introduction of full service the ‘searching for work’ conditionality regime makes up a smaller proportion of the overall caseload.
Although the ‘searching for work’ conditionality regime makes up a smaller proportion of claims, other conditionality regimes have increased in proportion. In particular, the ‘no work requirements’ conditionality regime has seen the largest increase in proportion. There are 25% of claimants in the ‘no work requirements’ conditionality regime at 9 January 2020, an increase from 3% in April 2015 (figure 5).
The ‘searching for work’ conditionality regime demonstrates a seasonal trend at the end of each year. The number of people drops in December and increases in January and February before decreasing again in subsequent months. This coincides with increases in seasonally available work over the Christmas and holiday period.
Between January 2019 and February 2019, the proportion in the ‘searching for work’ conditionality regime increased from 42% to 45%, and the proportion in the ‘working no requirements’ decreased from 18% to 14%. This was because of the administrative system change explained in the employment section earlier.
The conditionality regime measures which regime an individual is in on the count date. This may not be representative of the entire assessment period for that individual. Conditionality regime figures are not the same as the employment measures, which shows whether an individual has had earnings during their assessment period. The two measures should only be used together with caution. The background information and methodology document provides more information on this.
5. Claims made to Universal Credit
Making a claim is the first step an individual will need to do to receive Universal Credit. Not everybody that makes a claim will go on to receive Universal Credit.
The number of claims made in the 4 weeks up to 9 January 2020 was 160,000. The number of claims received over the Christmas period was seasonally low with an average of 26,000 claims per week received between 20 December 2019 and 2 January 2020, compared with a weekly average of 40,000 for the 4 week period as a whole.
Figure 6. The number of claims to Universal Credit per week was low over the Christmas period

Chart showing claims with a line for each year. Every year is higher than the previous year with a dip over the Christmas period. Since Oct 2019 the number of starts has been about the same as the same period in 2018
Source: DWP Universal Credit statistics.
Note: See Stat-Xplore for the complete data series.
The number of claims made each week increased up to December 2018 as Universal Credit gradually became available to new areas throughout Great Britain. In 2019 there is an average of 55,000 claims made each week as Universal Credit is available in every area of Great Britain (figure 6). This compares with an average of 34,000 claims made each week during 2018.
6. Starts to Universal Credit
Following making a claim, once an individual has signed their commitment agreement and had their identity verified among other criteria they are deemed to have started on Universal Credit. For the full definition of what is regarded as a start on Universal Credit refer to the background and methodology document.
There were 130,000 starts to Universal Credit in the 4 weeks to 9 January 2019.
Figure 7. The number of starts to Universal Credit per month peaked at 240,000 in February 2019

Chart showing starts with a line for each year. Every year is higher than the previous year until November 2019 when the number of starts is below the line for 2018
Source: DWP Universal Credit statistics.
Note: See Stat-Xplore for the complete data series.
7. Households on Universal Credit
In Universal Credit statistics a household is a single person or couple living together with or without dependent children. This is sometimes referred to as a benefit unit in other statistics.
There were 2.3 million households on Universal Credit in November 2019, an increase of 0.3 million since August 2019.
Of these households, 93% (2.2 million) were receiving a payment, compared to 86% (1.1 million out of 1.3 million) in November 2018.
There are a number of reasons why a household may not be in receipt of a payment, such as when someone moves into work and their level of earnings means that they no longer receive a payment.
Figure 8. Around 93% of households on Universal Credit were in payment in November 2019
| Month | In payment (%) |
|---|---|
| November 2019 (p) | 93 |
| August 2019 (r) | 93 |
| May 2019 (r) | 93 |
| February 2019 (r) | 92 |
| November 2018 (r) | 86 |
| August 2018 (r) | 85 |
| May 2018 (r) | 82 |
| February 2018 (r) | 80 |
| November 2017 (r) | 75 |
| August 2017 (r) | 73 |
| May 2017 (r) | 73 |
| February 2017 (r) | 71 |
| November 2016 (r) | 68 |
Source: DWP Universal Credit statistics.
Note: See Stat-Xplore for the complete data series. Figures marked (p) are provisional; figures marked (r) have been revised since the previous release.
The proportion of households receiving a payment increased from 87% in January 2019 to 92% in February 2019. This was the result of an update to the Universal Credit administrative system allowing ‘nil’ claims to be identified and closed. Prior to this update, some claims where the claimant had moved into employment and whose Universal Credit award was reduced to ‘nil’ as a result of their earnings were still counted in the data. For more information on this see the Background information and methodology document.
The average payment increases as Universal Credit is paid to a broader range of households.
The amount of Universal Credit a household receives is based on the standard Universal Credit entitlement plus additional entitlements that they are eligible for. Above these entitlements households may also receive additional payments for a loan advance, hardship payment, severe disability payment or mortgage interest.
The payments will be lower than their Universal Credit entitlements where the household is making a loan repayment, has been sanctioned, is limited by the benefit cap, is having benefit or tax credit overpayments being recovered or their income is above the threshold where the payment is reduced by the taper.
The average (mean) amount of Universal Credit paid to households on Universal Credit was £720 per month in November 2019. This is an increase from £660 a year earlier as the increase in the proportion of households with entitlements increases the average award (figure 9).
Figure 9. The average payment for Universal Credit is increasing as a broader range of households receive Universal Credit**
| Month | Average (mean) payment |
|---|---|
| November 2019 (p) | £720 |
| August 2019 (r) | £710 |
| May 2019 (r) | £690 |
| February 2019 (r) | £670 |
| November 2018 (r) | £660 |
| August 2018 (r) | £660 |
| May 2018 (r) | £630 |
| February 2018 (r) | £620 |
| November 2017 (r) | £580 |
| August 2017 (r) | £570 |
| May 2017 (r) | £540 |
| February 2017 (r) | £520 |
| November 2016 (r) | £500 |
Source: DWP Universal Credit statistics.
Note: This chart only includes households were Universal Credit is in payment. See Stat-Xplore for the complete data series. Figures marked (p) are provisional; figures marked (r) have been revised since the previous release.
Around 6% of households where Universal Credit is in payment are paid more than £1,500. The mean payment is increased by these large payments, which are largely caused by households receiving payments in addition to their standard entitlements. In November 2019, the median payment is lower than the mean payment at £630 (figure 10).
Figure 10. Average (mean) payment is influenced by a number of high payments

Chart showing the number of households in each payment band of £100 for November 2019. The highest number of people in any single band is the £200 to £300 band
Source: DWP Universal Credit statistics.
Note: This chart only includes households were Universal Credit is in payment. See Stat-Xplore for the complete data series. Figures marked (p) are provisional.
A growing proportion of payments are made to households with children
A growing proportion of Universal Credit claims in payment are to households with children as legacy benefits and tax credits are closed to new claims and new and claimants move to Universal Credit as circumstances change. These households make up 46% of payment awards in November 2019, compared with 40% in November 2018 (figure 11).
Figure 11. The percentage of Universal Credit payments awarded to households with children has increased over time
| Month | Single, with child dependant(s) | Couple, with child dependant(s) | Single, no child dependant(s) | Couple, no child dependant(s) | Total |
|---|---|---|---|---|---|
| November 2019 (p) | 35 | 12 | 50 | 3 | 100 |
| August 2019 (r) | 34 | 11 | 52 | 3 | 100 |
| May 2019 (r) | 32 | 11 | 54 | 3 | 100 |
| February 2019 (r) | 30 | 10 | 57 | 3 | 100 |
| November 2018 (r) | 30 | 9 | 57 | 3 | 100 |
| August 2018 (r) | 29 | 9 | 59 | 3 | 100 |
| May 2018 (r) | 26 | 9 | 63 | 3 | 100 |
| February 2018 (r) | 23 | 8 | 67 | 3 | 100 |
| November 2017 (r) | 21 | 7 | 70 | 2 | 100 |
| August 2017 (r) | 19 | 6 | 73 | 2 | 100 |
| May 2017 (r) | 17 | 5 | 77 | 1 | 100 |
| February 2017 (r) | 14 | 5 | 80 | 1 | 100 |
| November 2016 (r) | 13 | 4 | 82 | 1 | 100 |
Source: DWP Universal Credit statistics.
Note: This chart only includes households where Universal Credit is in payment. See Stat-Xplore for the complete data series. Percentages may not add up to 100 due to rounding. Figures marked (p) are provisional; figures marked (r) have been revised since the previous release.
All entitlement types are increasing as a proportion of Universal Credit payments
There are a range of additional entitlements in Universal Credit payments for children, health and disabilities, housing and carers. The proportion of Universal Credit payments with each of these entitlements has increased as Universal Credit replacing legacy benefits for new claims was introduced in more Jobcentre Plus offices (figure 12).
Figure 12. Housing and child elements are the biggest entitlements

Line chart showing the number of people for each entitlement from Nov 2016 to Nov 2019. The housing entitlement is the highest followed by the child entitlement with both increasing over the period
Source: DWP Universal Credit statistics.
Note: This chart only includes households where Universal Credit is in payment. See Stat-Xplore for the complete data series. Figures marked (p) are provisional; figures marked (r) have been revised since the previous release.
Entitlement for housing is included in the majority of awards to households in payment, with 65% of payment awards including this element in November 2019, compared with 49% in November 2016.
The child entitlement is included in nearly half of awards to households in payment, with 46% of these awards including this entitlement in November 2019, compared with 40% a year earlier and 17% in November 2016 (figure 12).
Payment by Family Type
Households with child dependant(s) receive the highest amount of Universal Credit at £970 for single households with child dependant(s) and £990 for couple households with child dependant(s) in 14 November 2019.
Up to April 2017, the amount of the child element received by a household with children increased with each child in the household. From April 2017, the amount received was restricted to a maximum of two children. From February 2019, households could receive an extra amount for a third or subsequent child born on or before 5 April 2017. As a result of these changes, the average award received by households with children started to decrease after April 2017, but has started to increase again during 2019 due to the further policy change.
The average payment received by households without child dependant(s) has been broadly flat over the last 12 months, although there are early signs of couple households with no dependant(s) starting to increase.
Figure 13. Households with children receive higher Universal Credit payments on average

Households without children have a slight increasing trend in the average payment over the period November 2016 to November 2019. Households with children have a falling trend to February 2019 when there is a slight increase before levelling off
Source: DWP Universal Credit statistics.
Note: This chart only includes households where Universal Credit is in payment. See Stat-Xplore for the complete data series. Figures marked (p) are provisional; figures marked (r) have been revised since the previous release.
Households receiving full payment on time has increased over the last year
Figure 14. In October 2019, 95% of households received their full payment on time

Line showing households receiving some payment on time increasing from 94% to 98% between April 2017 and October 2019, with households receiving all payment on time increasing from 76% to 95%
Source: DWP Universal Credit statistics.
Note: Payment timeliness statistics are available in Stat-Xplore from April 2019 onwards. To allow sufficient time for information to be gathered on all payments, figures are not included for the latest month in the series. Payment timeliness statistics for January 2017 to March 2019 for Universal Credit full service can be found in table 1.1 in the ODS tables accompanying this bulletin. Figures prior to April 2019 are Universal Credit full service only. Figures marked (p) are provisional; figures marked (r) have been revised since the previous release.
There has been an increase in payment timeliness over the last year with 95% of all households in payment receiving their full payment on time in October 2019, compared to 89% in October 2018. Additionally, 98% of households receiving a payment were paid some payment on time, compared to 96% in October 2018 (figure 14).
Payment timeliness for new claims have also increased over the last year
Payment timeliness is lower when looking at new claims than when looking at all claims. There are a number of one-off verification processes that must be completed by the claimant and by DWP at the start of the claim.
These are to confirm the current circumstances of the claimant (or both claimants in a joint claim) and their entitlement to Universal Credit. Delays to completion of these processes can interfere with payments being made on time.
Figure 15. Around 87% of households with new claims received their entire Universal Credit payment on time

Line showing households receiving some payment on time for new claims increasing from 80% to 92%, and for all payment on time from 61% to 87% between April 2017 and October 2019
Source: DWP Universal Credit statistics.
Note: Payment timeliness statistics are available in Stat-Xplore from April 2019 onwards. To allow sufficient time for information to be gathered on all payments, figures are not included for the latest month in the series. Payment timeliness statistics for January 2017 to March 2019 for Universal Credit full service can be found in table 1.1 in the ODS tables accompanying this bulletin. Figures prior to April 2019 are Universal Credit full service only. Figures marked (p) are provisional; figures marked (r) have been revised since the previous release.
Households with new claims to Universal Credit in payment and receiving all their payment on time has increased to 87% of households in October 2019, compared to 79% in October 2018. Approximately 92% of this group received at least some payment on time in October 2019. This compares to 87% that received some payment on time in October 2018 (figure 15).
8. About these statistics
Purpose
These statistics provide the primary official source of information about people and households on Universal Credit, and claims and starts to Universal Credit.
They enable a variety of users to be informed about different elements of the benefit including politicians, policy and administrative staff in central and local government, academics, the voluntary sector and journalists. They use the statistics for a range of purposes from monitoring and accountability to research and policy development.
The background information and methodology document includes more details on the users and uses of these statistics.
User engagement and development of these statistics
These official statistics have been compiled using data from systems within local offices and records of Universal Credit benefit payments made by the department.
These and other new data sources will, in time, allow a progressively broader range of breakdowns to be published as data sources are developed. The methodology used and definitions of the official statistics may be updated within subsequent releases, along with information on the impact of any changes to the time series already released.
A strategy for the release of official statistics on Universal Credit was first published in September 2013 and last updated in January 2018 following consultation with users.
Compliance check against the Code of Practice for Statistics
These statistics have been developed using guidelines set out by the UK Statistics Authority and are official statistics that are experimental.
A compliance check was conducted on Universal Credit statistics by the Office for Statistics Regulation (OSR) in May 2019. They welcomed many aspects of the release and made a number of recommendations to support the development of these experimental statistics.
Since that compliance check we have introduced a number of developments. The background information and methodology contains more details on these.
Users are invited to comment on the content, relevance, accessibility and timeliness of these statistics by sending an email to team.ucos@dwp.gov.uk, or on the Welfare and Benefits statistics board of StatsUserNet.
Rounding
Volumes and amounts have been rounded as detailed in the background information and methodology document. Percentages are calculated using numbers prior to rounding and rounded to the nearest whole percentage point.
Revisions
Universal Credit statistics are subject to scheduled revisions as detailed in the background information and methodology document. Other revisions to these statistics since the last quarterly bulletin are detailed below.
People – age
In December 2019, there was a methodology change to the figures for June 2019 onwards that means individuals aged 71 to 90 years old are now included in the over 65 group. Previously, any person with a date of birth in the data that would make them over 70 would be classified as unknown/missing.
This was part of a quality assurance where people of this age were unlikely to be claiming Universal Credit and would instead be claiming Pension Credit. In May 2019, the eligibility for claiming Pension Credit in a couple changed from being determined by the age of the older person in the couple to being the age of the younger person in the couple. This means that people over 70 and whose partner is below the age eligibility for Pension Credit will need to claim Universal Credit instead of Pension Credit.
For this reason, we no longer consider that quality assuring data to remove people over 70 from the ‘over 65’ age band is a valid criterion. We now include any individual up to age 90 in the ‘over 65’ category for figures from June 2019.
Unknown postcodes (people & households)
During the production of this release, around 2,500 claims (around 0.2% of claims) being included on the Great Britain dataset were identified to be Northern Ireland claims. This issue is most apparent in unknown postcodes for people and households where there is a drop between November 2019 and December 2019.
An update to our processing has removed these from the December 2019 figures and for future months. Earlier months will not be revised due to the small proportion of the overall total and the resources needed to make the correction.
Changes to this publication
Bulletin review
A new structure to the bulletin has been introduced, additional background information provided and additional context to the statistics provided in the commentary. These changes are to implement recommendations made by the OSR in their compliance check of the release in May 2019. Changes have also been made to follow Government Statistical Service good practice and Government Digital Service guidelines for publishing on GOV.UK.
An extensive update of the background information and methodology document has been released with this bulletin to give users a better understanding of the statistics and the methods used to produce them.
Developments to the production and dissemination of Universal Credit statistics is a continuous process and comments on the introductions made in the release are welcomed by emailing team.ucos@dwp.gov.uk, or on the Welfare and Benefits statistics board of StatsUserNet.
New table on Stat-Xplore
In the January 2020 release of people on Universal Credit, we introduced a new ‘ready made’ table on Stat-Xplore as Table 1 and renumbered the existing tables. This new table shows number of people on Universal Credit by conditionality regime for the last 13 months.
It was introduced as a result of user feedback to show the latest published figures for people on Universal Credit for the latest month. The previous tables 1 to 4 on Stat-Xplore were employment indicator breakdowns, which since November 2019 have been produced with an additional month lag. As a result, they were not showing the latest published figures for people on Universal Credit for the latest month.
9. Related statistics
This publication complements other statistics bulletins that, together, provide a more coherent view of Universal Credit claimants and awards, and other benefits.
Universal Credit statistics for Northern Ireland are published by the Department for Communities (Northern Ireland).
Benefit sanctions includes statistics on people having their award stopped or reduced for not meeting their agreed conditions.
Benefit Cap includes statistics on people who have had their Universal Credit award capped because their total amount received in benefits is higher than the maximum amount of benefits a person can receive.
DWP benefits provides statistics for benefits that Universal Credit is replacing.
Fraud and error in the benefit system provides estimates of the number of households that may have been paid too much Universal Credit or not enough. These overpayments and underpayments happen as a consequence of fraud; claimant error; and official error (processing errors or delays by DWP, a Local Authority, or Her Majesty’s Revenue and Customs). ‘Fraud and error in the benefit system’ estimates how much money the department incorrectly pays.
Claimant count is a measure of the number of people claiming benefits principally for the reason of being unemployed, based on administrative data from the benefits system. It includes people on Universal Credit in the searching for work conditionality regime for the UK. Universal Credit statistics uses the same data excluding Northern Ireland.
Alternative claimant count statistics measure the number of people claiming unemployment related benefits by modelling what the count would have been if Universal Credit had been fully available from when Universal Credit was introduced in 2013 with the broader span of people this covers. Under Universal Credit, a broader span of claimants are required to look for work than under Jobseeker’s Allowance. This is a feature of the design of Universal Credit and has the effect of increasing the Claimant count irrespective of how the economy performs. For this reason, the Office for National Statistics have stated that the Claimant count figures are no longer a reliable indicator of the labour market. The Alternative claimant count attempts to address this.
European Social Fund 2014 to 2020 (ESF) programme is an EU-funded employment, skills and social inclusion programme across England aimed at providing the help people need to achieve their potential. This publication uses Universal Credit data to show how many people who started on the programme were on Universal Credit.
10. Definitions
Conditionality Regimes
| Conditionality regime | Description | Conditionality Group | Labour Market Regime |
|---|---|---|---|
| Searching for work | Not working, or with very low earnings. Claimant is required to take action to secure work - or more or better paid work. The Work Coach supports them to plan their work search and preparation activity. Typical examples of people in this regime include jobseekers and self-employed in start-up period. Claimants are only in this regime if they do not fit into one of the other regimes. | All work related requirements | Intensive Work Search |
| Working – with requirements | In work, but could earn more, or not working but has a partner with low earnings. | All work related requirements | Light touch |
| No work requirements | Not expected to work at present. Health or caring responsibility prevents claimant from working or preparing for work. Examples of people on this regime include those in full time education, over state pension age, has a child under 1 and those with no prospect for work. | No work related requirements | No work related requirements |
| Working – no requirements | Individual or household earnings over the level at which conditionality applies. Required to inform DWP of changes or circumstances, particularly at risk of earnings decreasing or job loss. | No work related requirements | Working enough |
| Planning for work | Expected to work in the future/ Lead parent or lead carer of child aged 1 (aged 1 to 2, prior to April 2017). Claimant required to attend periodic interviews to plan for their return to work. | Work focused interview | Work focused interview |
| Preparing for work | Expected to start work in the future even with limited capability to work at the present time or a child aged 2 (aged 3 to 4, prior to April 2017). Claimant expected to take reasonable steps to prepare for working including Work Focused Interview. | Work preparation | Work preparation |
Universal Credit live service
The original service offering Universal Credit. Initially restricted to mostly single working age people with no children, seeking work. It was available throughout Great Britain by May 2016. It closed to new claims from 1 January 2018 and all remaining claimants were moved to full service by March 2019.
Universal Credit full service
Full service is the digital system that offers Universal Credit to the full range of claimant groups. New claims are made on gov.uk and most accounts are managed only through an online account. It was gradually introduced to Jobcentres from 2016 and was available in every Jobcentre across Great Britain and Northern Ireland by December 2018. When full service became available in a Jobcentre, existing Universal Credit claimants on live service were transferred to full service within 3 months. A glossary for further terms used in Universal Credit statistics is included in the background and methodology document.
11. Contacts
Feedback on the content, relevance, accessibility and timeliness of these statistics and any non-media enquiries should be directed to:
Statistician: Stephen Slater
email: team.ucos@dwp.go.uk
Media enquiries: 0203 267 5129
ISBN 978-1-78659-195-1