Universal Credit statistics: 29 April 2013 to 11 July 2019
Published 13 August 2019

© Crown copyright 2019
This publication is licensed under the terms of the Open Government Licence v3.0 except where otherwise stated. To view this licence, visit nationalarchives.gov.uk/doc/open-government-licence/version/3 or write to the Information Policy Team, The National Archives, Kew, London TW9 4DU, or email: psi@nationalarchives.gov.uk.
Where we have identified any third party copyright information you will need to obtain permission from the copyright holders concerned.
This publication is available at https://www.gov.uk/government/statistics/universal-credit-29-april-2013-to-11-july-2019/universal-credit-statistics-29-april-2013-to-11-july-2019
This is the latest release of these statistics and includes revisions to previous statistics. Data for People on Universal Credit, Claims made to Universal Credit, Starts to Universal Credit and Households on Universal Credit are available on Stat-Xplore and in ODS tables.
The next release of People on Universal Credit will be on 10 September 2019. The next release for Claims made to Universal Credit, Starts to Universal Credit and Households on Universal Credit will be on 12 November 2019.
The Stat-Xplore breakdown for postcode district for Claims and Starts to Universal Credit has been withdrawn due to an issue with the underlying data. Investigations are currently ongoing and the breakdown will be restored in due course.
We are seeking user feedback on this HTML version of the statistical bulletin which replaces the PDF version. Please send comments to: christopher.s.johnston@dwp.gov.uk .
1. Introduction
Universal Credit is a payment to help with living costs for those on a low income or out of work. Universal Credit provides a single payment per household based upon the circumstances of the household.
Support for housing costs, children and childcare costs are integrated into Universal Credit and it also provides additions for disabled people and carers.
Universal Credit is now available in every jobcentre across Great Britain. Roll out was completed in December 2018. Managed migration of claimants on benefits being replaced by Universal Credit began in July 2019 in Harrogate.
The following benefits will be replaced by Universal Credit:
- Income-based Jobseeker’s Allowance
- Income-related Employment and Support Allowance
- Income Support
- Working Tax Credit
- Child Tax Credit
- Housing Benefit
The main features of Universal Credit are:
- Universal Credit is available to people who are in work and on a low income, as well as to those who are out of work
- Universal Credit will be responsive – as people on low incomes move in and out of work, they will get on-going support
- most claimants on low incomes will still be paid Universal Credit when they start a new job or increase their hours
- claimants will receive a single monthly household payment paid into a bank account. In some cases, payment can be split between claimants in a household
- support with housing costs will usually go direct to the claimant – in some cases, this can be paid directly to the landlord instead
- most people will apply online and manage their claim through an online account
Statistics in this release
This release of Universal Credit statistics covers the period up to 11 July 2019. Please note the figures for People, Claims made and Starts to Universal Credit for the latest month (July 2019) are provisional and will be finalised in the next release. Figures for March to May 2019 for Households on Universal Credit are provisional. All Households on Universal Credit data are revised in each quarterly release.
This release contains 4 measures:
- Claims
- Starts
- People
- Households
Claims
Claims made counts the number of applications submitted for Universal Credit.
Starts
Some of the people who make a Claim will go on to Start on Universal Credit.
People
People on Universal Credit includes all those who have started and are still on Universal Credit at the count date (this is the second Thursday of the month).
Households
Households on Universal Credit are counted as being on Universal Credit where entitlement has been calculated for an assessment period spanning the count date. It includes those who receive a payment, as well as those that don’t.
Statistics for Claims, Starts, People and Households on Universal Credit are published quarterly. Data for People on Universal Credit are available each month. All data are available on Stat-Xplore.
Read the background information and methodology document for more detail on the definitions used in this publication.
2. Main story
People on Universal Credit
The number of people on Universal Credit at 11 July 2019 was 2.3 million. This is a 5% increase from 13 June 2019.
Of these people:
- 760,000 (33%) were in employment
- 930,000 (41%) were in the Searching for Work conditionality regime
- 1.3 million (55%) were female
Claims made to Universal Credit
The total number of claims that have been made since Universal Credit began is 5.1 million. The number of claims made to Universal Credit was 240,000 in the month up to 11 July 2019.
Starts to Universal Credit
The total number of starts that have been made since Universal Credit began is 3.9 million. The number of starts made to Universal Credit was 180,000 in the month up to 11 July 2019.
Of these starts in the month up to 11 July 2019:
- 53% were by females
- 62% were in the 25 to 49 age group
Households on Universal Credit
In May 2019, 1.8 million households were on Universal Credit and 1.7 million (93%) were receiving a Universal Credit payment.
Of these households in payment:
- the mean amount of Universal Credit paid to households was £670 per month
- single person households with no child dependants received the least amount of Universal Credit on average (£460 per month), while couples with child dependant(s) received the most on average (£950 per month)
- 1.1 million households (63%) were entitled to support with housing, of which 54% were in the social rented sector
- around 50 households received a Split Payment
- approximately 66,000 households had a More Frequent Payment, with 39,000 of these being through Universal Credit Scottish Choices
- In April 2019, 94% of all households that were paid received full payment on time, with 97% of households receiving at least some payment on time
- In April 2019, 83% of households new to Universal Credit that were paid received their full payment on time, with 89% receiving at least some payment on time
3. People on Universal Credit
Number of People on Universal Credit
The number of people on Universal Credit at 11 July 2019 was 2.3 million. This is a 5% increase from 13 June 2019 and a 123% increase from 12 July 2018. The large increase of People on Universal Credit through 2018 was due to the rollout of Universal Credit across the UK.
Figure 1: The number of people on Universal Credit is now 2.3 million
| Month | Number of people on Universal Credit |
|---|---|
| July 2019 (p) | 2,300,000 |
| June 2019 (r) | 2,200,000 |
| May 2019 | 2,000,000 |
| April 2019 | 1,900,000 |
| March 2019 | 1,800,000 |
| February 2019 | 1,700,000 |
| January 2019 | 1,600,000 |
| December 2018 | 1,500,000 |
| November 2018 | 1,400,000 |
| October 2018 | 1,300,000 |
| September 2018 | 1,200,000 |
| August 2018 | 1,100,000 |
| July 2018 | 1,000,000 |
Source: DWP Universal Credit statistics.
Note: See Stat-Xplore for the complete data series. Figures marked (p) are provisional; figures marked (r) have been revised since the previous release.
Employment
Universal Credit is available to people who are in work and on a low income, as well as to those who are out of work. Most claimants on low incomes will still be paid Universal Credit when they start a new job or increase their hours.
Figure 2 shows the number of people on Universal Credit that are in employment. Of the 2.3 million people on Universal Credit as of 11 July 2019, 760,000 (33%) were in employment, compared to 38% (380,000 out of 1.0 million) on 12 July 2018.
It is important to note that employment for July 2019 has been estimated using real time earnings information. Previous months use assessment period earnings data, which is not currently available for July 2019.
The revised employment percentage for July 2019 will be available in the next publication of People on Universal Credit on 10 September 2019.
Figure 2. Around 33% of people on Universal Credit on 11 July 2019 are in employment
| Month | In employment (%) |
|---|---|
| July 2019 (p) | 33 |
| June 2019 (r) | 34 |
| May 2019 | 34 |
| April 2019 | 34 |
| March 2019 | 34 |
| February 2019 | 34 |
| January 2019 | 37 |
| December 2018 | 39 |
| November 2018 | 39 |
| October 2018 | 38 |
| September 2018 | 37 |
| August 2018 | 37 |
| July 2018 | 38 |
Source: DWP Universal Credit statistics.
Note: See Stat-Xplore for the complete data series. Figures marked (p) are provisional; figures marked (r) have been revised since the previous release.
Searching for Work conditionality regime
Conditionality means work-related things an eligible adult will have to do in order to get full entitlement to Universal Credit. Each eligible adult will fall into one of 6 conditionality regimes based on their capability and circumstances.
| Conditionality regime | Description |
|---|---|
| Searching for work | Not working, or with very low earnings. Claimant is required to take action to secure work - or more or better paid work. The Work Coach supports them to plan their work search and preparation activity. |
| Working – with requirements | In work, but could earn more, or not working but has a partner with low earnings. |
| No work requirements | Not expected to work at present. Health or caring responsibility prevents claimant from working or preparing for work. |
| Working – no requirements | Individual or household earnings over the level at which conditionality applies. Required to inform DWP of changes or circumstances, particularly at risk of decreasing earnings or losing job. |
| Planning for work | Expected to work in the future/ Lead parent or lead carer of child aged 1. Claimant required to attend periodic interviews to plan for their return to work. |
| Preparing for work | Expected to start work in the future even with limited capability to work at the present time or a child aged 2. Claimant expected to take reasonable steps to prepare for working including Work Focused Interview. |
Read the background information and methodology document for more detail on the definitions used in this publication.
Figure 3 shows the proportion of people on Universal Credit on each conditionality regime. Of the 2.3 million people on Universal Credit as of 11 July 2019, 41% (930,000) were in the Searching for Work conditionality regime, compared to 46% (470,000 out of 1.0 million in total) on 12 July 2018.
There is a decreasing trend in the proportion of people on Universal Credit in the Searching for Work conditionality regime since April 2015, which is the first date for which these figures are available. This is due to Universal Credit initially being available only to jobseekers, who are expected to be in this conditionality regime.
As rollout to other benefit claimants has progressed, the proportion of Searching for Work claimants has decreased. During the same period, the proportion of people in each of the remaining conditionality regimes have continued to increase, particularly the No Work Requirements conditionality regime, which is at 22% as of 11 July 2019.
There is a noticeable trend where the number of people in the Searching for Work conditionality regime drops in December and increases in January and February before decreasing again in subsequent months. This has been observed in all years Universal Credit has been available and may be due to the increase in available work over the Christmas and holiday period.
Figure 3: The percentage of people in the Searching for Work conditionality regime has decreased over time
| Month | Searching for Work (%) | Working - with or without requirements (%) | No work requirements (%) | Planning or preparing for work (%) |
|---|---|---|---|---|
| July 2019 (p) | 41 | 29 | 22 | 8 |
| June 2019 (r) | 42 | 29 | 22 | 8 |
| May 2019 | 43 | 29 | 21 | 7 |
| April 2019 | 44 | 28 | 21 | 7 |
| March 2019 | 45 | 28 | 20 | 7 |
| February 2019 | 45 | 28 | 20 | 7 |
| January 2019 | 42 | 33 | 19 | 6 |
| December 2018 | 42 | 33 | 18 | 6 |
| November 2018 | 43 | 33 | 18 | 6 |
| October 2018 | 44 | 32 | 18 | 6 |
| September 2018 | 45 | 32 | 17 | 6 |
| August 2018 | 45 | 32 | 17 | 6 |
| July 2018 | 46 | 32 | 16 | 6 |
Source: DWP Universal Credit statistics
Note: See Stat-Xplore for the complete data series. Percentages may not add up to 100 due to rounding. Figures marked (p) are provisional; figures marked (r) have been revised since the previous release.
The conditionality breakdown measures what regime an individual is in on the count date. This may not be representative of the entire assessment period for that individual. Conditionality regime figures are not the same as the employment breakdown, which shows whether an individual has had earnings during their assessment period. The 2 breakdowns should only be used together with caution.
Read the background information and methodology document for more detail on this issue.
Gender
Figure 4 shows the proportion of people on Universal Credit that are female. On 11 July 2019, 1.3 million (55%) of people on Universal Credit were female, compared to 51% (520,000 out of 1.0 million) on 12 July 2018. The proportion of female claimants has steadily increased as Universal Credit has been rolled out across the UK and continues to do so.
Figure 4: Females now represent 55% of people on Universal Credit
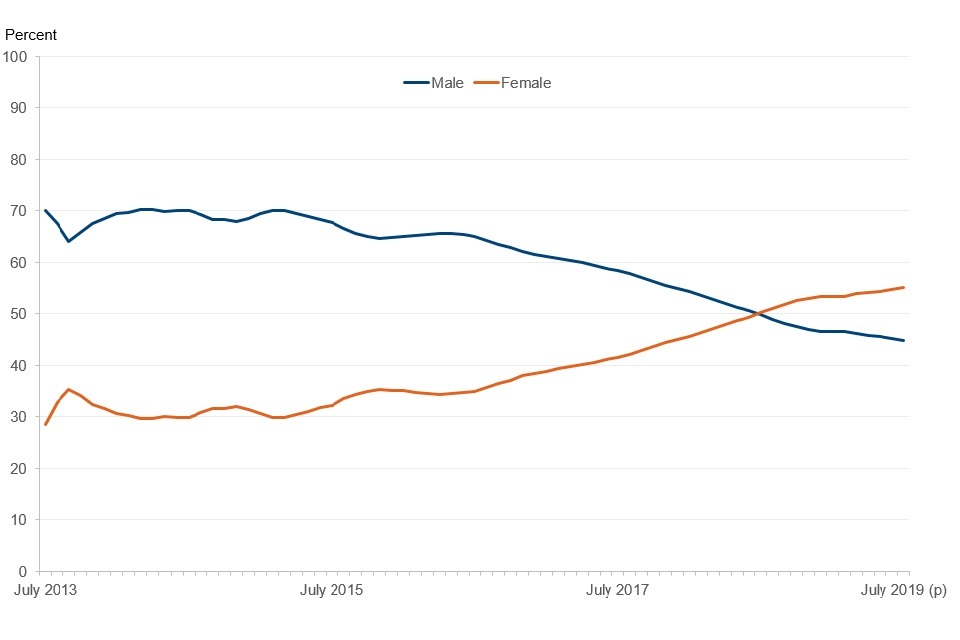
Line graph showing the proportion of males and females on Universal Credit. People on Universal Credit is majority male initially but gradually this decreases until present where females are the majority of People on Universal Credit
Source: DWP Universal Credit statistics
Note: See Stat-Xplore for the complete data series. Figures marked (p) are provisional.
Figure 5 shows the gender split in each conditionality regime in July 2018 and July 2019. Of those in the Searching for Work conditionality regime, 58% (550,000 out of 930,000 in total) were male in July 2019 compared to 61% (280,000 out of 470,000 in total) in July 2018.
Other conditionality regimes also show an increasing proportion of females over time. All conditionality regimes other than Searching for Work are majority female.
Figure 5. There are more females than males in all conditionality regimes except for Searching for Work
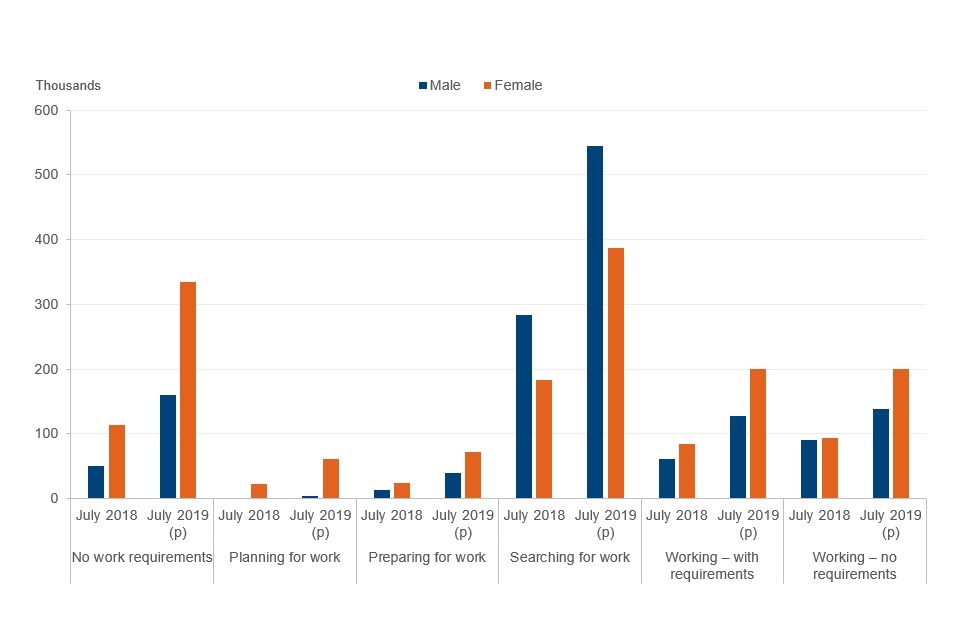
Bar chart showing the numbers of people in each conditionality regime between the 2 dates. All Bars show an increase in numbers. For all regimes other than Searching for Work, females outnumber males and the proportion of females has increased over time
Source: DWP Universal Credit statistics.
Note: See Stat-Xplore for the complete data series. Figures marked (p) are provisional.
Region
Universal Credit was gradually introduced across the UK in particular Jobcentre Plus offices. Historically, this has meant that the number of Universal Credit claimants in geographical areas has varied substantially. Universal Credit is now available in all Jobcentre Plus offices and this variation has reduced. The date that Universal Credit was made available in each Jobcentre Plus office can be found in Table 4.1 of the data tables.
Since Universal Credit was introduced, the North West region, where rollout started, had the largest number of claimants. For the first time, London has a higher number of claimants.
The statistics for People on Universal credit at Jobcentre Plus office level can be explored in our interactive map.
Please note that this map will be unavailable on a monthly basis from 12:30pm on the day before each monthly release of People on Universal Credit figures. The map will be updated and made available to users at 9:30am on the day of the monthly release of new figures for People on Universal Credit. For future release dates, see the statistics release calendar.
4. Claims made to Universal Credit
The total number of claims made for Universal Credit at 11 July 2019 was 5.1 million. The number of claims made in the 4 weeks up to 11 July 2019 was 240,000. Claims made to Universal Credit reached a daily peak of 14,000 on 14 January 2019, and a weekly peak of 66,000 in the week ending 17 January 2019.
Figure 6 shows the number of claims made each week from 8 August 2014 to 11 July 2019. As Universal Credit rollout has continued, the number of claims each week has increased. Since Universal Credit began, there has been a seasonal trend involving a large drop in the number of claims around the Christmas period and a subsequent increase in January. Similar yet smaller dips are also observable over the Easter period and the other Bank Holiday periods of each year. In 2018 to 2019 there was an increase in the number of claims in line with the expanded roll out of Universal Credit.
Figure 6: The number of claims to Universal Credit per week peaked at 66,000 on 17 January 2019

Line chart with a line for each year showing the weekly number of claims made to Universal Credit. The lines for each year are largely separate, showing the increase in claims year on year
Source: DWP Universal Credit statistics.
Note: See Stat-Xplore for the complete data series.
5. Starts to Universal Credit
The total number of starts to Universal Credit has now reached 3.9 million.
Figure 7 shows the number of Starts to Universal Credit each month. A total of 180,000 starts were made to Universal Credit in the month up to 11 July 2019. The number of starts per month peaked in the month up to 14 February 2019 at 240,000 starts.
Figure 7: The number of starts to Universal Credit per month peaked at 240,000 in February 2019
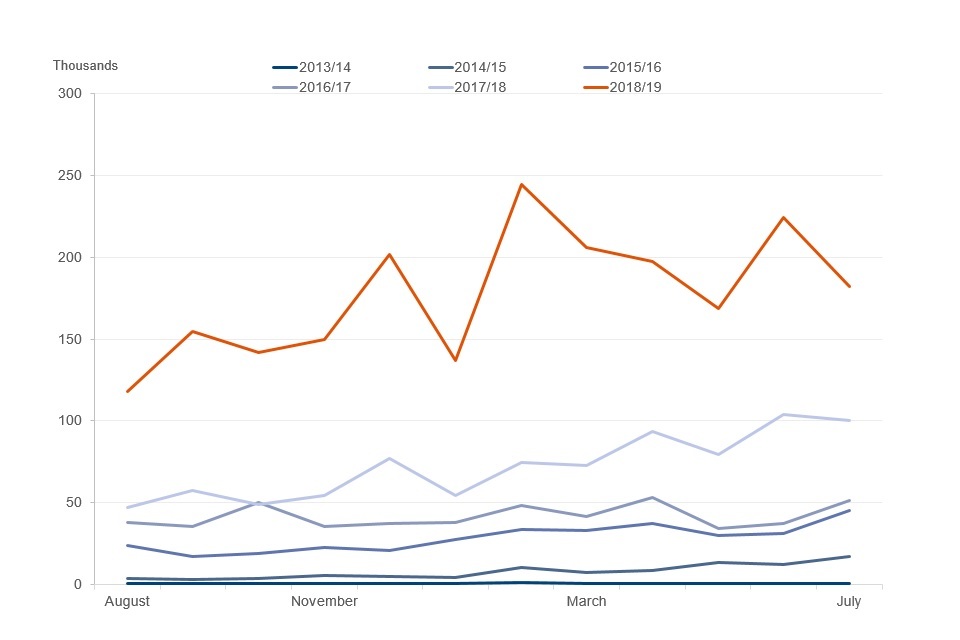
Line graph showing how many Starts to Universal Credit there were each month, with a separate line showing each year. The number of starts increases each year, peaking in February 2019 at 240,000
Source: DWP Universal Credit statistics.
Note: See Stat-Xplore for the complete data series.
Gender
As with the overall number of People on Universal Credit, the proportion of females starting Universal Credit has increased as rollout has progressed.
Figure 8 shows the starts to Universal Credit by gender. Of all starts in the month up to 11 July 2019, 53% were by females and 47% were by males. The proportion of females on Universal Credit has increased over time and they are now the majority of starts to Universal Credit.
Figure 8: Over half of the starts to Universal Credit in the month up to 11 July 2019 were by females

Line graph with 2 lines, showing the proportion of starts for males and females for Universal Credit. Male starts are initially higher but, over time, the lines begin to intersect with females now higher than males, except for a brief point in Jan 2019
Source: DWP Universal Credit statistics.
Note: See Stat-Xplore for the complete data series. Figures marked (p) are provisional.
Age
Figure 9 shows the number of starts to Universal Credit per month by age band. Of all starts in the month up to 11 July 2019, the 25 to 49 age group had the most starts at 62%. The proportion of starters aged 50 and over in the month up to 11 July 2019 was 16%, compared to 18% in July 2018.
Figure 9: The 25 to 49 age group had the most starts to Universal Credit
| Month | 16-24 (starts %) | 25-49 (starts %) | 50-65 (starts %) | Over 65 (starts %) |
|---|---|---|---|---|
| July 2019 (p) | 21 | 62 | 16 | 0 |
| June 2019 (r) | 20 | 63 | 17 | 0 |
| May 2019 | 19 | 63 | 17 | 0 |
| April 2019 | 20 | 63 | 17 | 0 |
| March 2019 | 20 | 62 | 17 | 0 |
| February 2019 | 21 | 60 | 18 | 0 |
| January 2019 | 20 | 60 | 19 | 0 |
| December 2018 | 21 | 59 | 20 | 0 |
| November 2018 | 22 | 59 | 19 | 0 |
| October 2018 | 23 | 58 | 18 | 0 |
| September 2018 | 23 | 59 | 18 | 0 |
| August 2018 | 23 | 59 | 18 | 0 |
| July 2018 | 22 | 59 | 18 | 0 |
Source: DWP Universal Credit statistics.
Note: See Stat-Xplore for the complete data series. Percentages may not add up to 100 due to rounding. Figures marked (p) are provisional; figures marked (r) have been revised since previous release.
6. Households on Universal Credit
In May 2019, 1.8 million households were on Universal Credit. Of these households, 93% (1.7 million) were receiving a payment, compared to 82% (680,000 out of 840,000) in May 2018.
Figure 10 shows the proportion of households receiving a payment in each month since May 2018. There are a number of reasons why a household may not be in receipt of a payment, one being when someone moves into work and their level of earnings means that they no longer receive a payment.
Figure 10. Around 93% of households on Universal Credit were in payment in May 2019
| Month | In payment (%) |
|---|---|
| May 2019 (p) | 93 |
| April 2019 (p) | 92 |
| March 2019 (p) | 92 |
| February 2019 (r) | 92 |
| January 2019 (r) | 87 |
| December 2018 (r) | 85 |
| November 2018 (r) | 86 |
| October 2018 (r) | 86 |
| September 2018 (r) | 85 |
| August 2018 (r) | 85 |
| July 2018 (r) | 84 |
| June 2018 (r) | 83 |
| May 2018 (r) | 82 |
Source: DWP Universal Credit statistics.
Note: See Stat-Xplore for the complete data series. Figures marked (p) are provisional; figures marked (r) have been revised since previous release.
Average Payment Amount
In May 2019, the mean amount of Universal Credit paid to households on Universal Credit was £670 per month.
A small number of households that receive relatively large payments of Universal Credit may have some effect on the mean. In May 2019, 73,000 households received a monthly payment of over £1,500. This was 4% of all households in payment.
Figure 11. The mean amount of Universal Credit paid to households was £670 in May 2019
| Month | Mean payment |
|---|---|
| May 2019 (p) | £670 |
| April 2019 (p) | £670 |
| March 2019 (p) | £660 |
| February 2019 (r) | £660 |
| January 2019 (r) | £650 |
| December 2018 (r) | £650 |
| November 2018 (r) | £650 |
| October 2018 (r) | £650 |
| September 2018 (r) | £650 |
| August 2018 (r) | £660 |
| July 2018 (r) | £650 |
| June 2018 (r) | £640 |
| May 2018 (r) | £630 |
Source: DWP Universal Credit statistics.
Note: See Stat-Xplore for the complete data series. Figures marked (p) are provisional; figures marked (r) have been revised since the previous release.
Payment by Family Type
Households receiving Universal Credit payments will receive different payment amounts depending on whether they are single person or couple households, as well as whether they have children. Read more about Universal Credit payments.
Figure 12 shows the mean monthly amount of Universal Credit paid by family type.
The average monthly award of Universal Credit paid to single person households without children was £460. The average award for households with children was much higher:
- £950 for couples with children
- £930 for singles with children
For households with children, higher average payments are a result of entitlement to support for one or more children and a higher proportion with entitlement to support for housing.
In May 2019, 54% (910,000) of Universal Credit awards were paid to single people without children, while just 54,000 awards (3%) were paid to couples without children.
Figure 12. Households with children receive higher Universal Credit payments on average
| Month | Single, no child dependant | Single, with child dependant(s) | Couple, no child dependant | Couple, with child dependant(s) |
|---|---|---|---|---|
| May 2019 (p) | £460 | £930 | £640 | £950 |
| April 2019 (p) | £470 | £930 | £650 | £960 |
| March 2019 (p) | £470 | £930 | £650 | £950 |
| February 2019 (r) | £470 | £930 | £660 | £940 |
| January 2019 (r) | £470 | £900 | £650 | £900 |
| December 2018 (r) | £470 | £910 | £650 | £900 |
| November 2018 (r) | £470 | £920 | £650 | £900 |
| October 2018 (r) | £470 | £930 | £650 | £900 |
| September 2018 (r) | £470 | £940 | £640 | £910 |
| August 2018 (r) | £470 | £950 | £650 | £930 |
| July 2018 (r) | £470 | £960 | £650 | £920 |
| June 2018 (r) | £460 | £950 | £650 | £920 |
| May 2018 (r) | £450 | £950 | £640 | £920 |
Source: DWP Universal Credit statistics.
Note: See Stat-Xplore for the complete data series. Figures marked (p) are provisional; figures marked (r) have been revised since the previous release.
Figure 13 shows the proportion of Universal Credit awards paid to households with children since May 2018.
Over time, a growing proportion of Universal Credit awards have been paid to households with children. In May 2018, 35% of awards were paid to households with children. By May 2019, this had risen to 43%. This is due to the continuing roll out of Universal Credit to a wider range of claimant types throughout 2018.
Figure 13: The percentage of Universal Credit payments awarded to households with children has increased over time
| Month | Single, no child dependant (%) | Single, with child dependant(s) (%) | Couple, no child dependant (%) | Couple, with child dependant(s) (%) |
|---|---|---|---|---|
| May 2019 (p) | 54 | 32 | 3 | 11 |
| April 2019 (p) | 55 | 31 | 3 | 10 |
| March 2019 (p) | 56 | 31 | 3 | 10 |
| February 2019 (r) | 57 | 30 | 3 | 10 |
| January 2019 (r) | 57 | 30 | 3 | 10 |
| December 2018 (r) | 57 | 30 | 3 | 9 |
| November 2018 (r) | 57 | 30 | 3 | 9 |
| October 2018 (r) | 57 | 30 | 3 | 9 |
| September 2018 (r) | 58 | 29 | 3 | 9 |
| August 2018 (r) | 59 | 29 | 3 | 9 |
| July 2018 (r) | 60 | 28 | 3 | 9 |
| June 2018 (r) | 61 | 27 | 3 | 9 |
| May 2018 (r) | 63 | 26 | 3 | 9 |
Source: DWP Universal Credit statistics.
Note: See Stat-Xplore for the complete data series. Percentages may not add up to 100 due to rounding. Figures marked (p) are provisional; figures marked (r) have been revised since the previous release.
Housing Support
Universal Credit pays for different sorts of support required by the household. This support helps households with costs such as rent or the interest charged on a mortgage. In order to be entitled to this support, certain conditions have to be met. Read more about these conditions.
Figure 14 shows the number of households receiving a payment of Universal Credit by housing support entitlement and tenure.
Around 1.1 million households that received a payment of Universal Credit in May 2019 were entitled to support for housing. This is 63% of all households in payment.
In May 2019, 54% of households receiving a payment of Universal Credit with entitlement to support for housing were in the social rented sector, compared to 45% in the private rented sector. Around 1% of households fall in to the ‘other or unknown’ category for tenure. This includes households in owner occupied accommodation receiving support for mortgage interest. These proportions have been consistent over the last 6 months.
Figure 14: Around 1.1 million households on Universal Credit were entitled to housing support in May 2019
| Month | No Housing Entitlement | Yes – Social Rented Sector | Yes – Private Rented Sector | Yes – Other or unknown |
|---|---|---|---|---|
| May 2019 (p) | 620,000 | 580,000 | 480,000 | 9,300 |
| April 2019 (p) | 600,000 | 550,000 | 460,000 | 8,900 |
| March 2019 (p) | 570,000 | 520,000 | 430,000 | 8,600 |
| February 2019 (r) | 540,000 | 480,000 | 400,000 | 8,200 |
| January 2019 (r) | 470,000 | 440,000 | 360,000 | 7,500 |
| December 2018 (r) | 440,000 | 410,000 | 330,000 | 6,900 |
| November 2018 (r) | 400,000 | 370,000 | 300,000 | 6,300 |
| October 2018 (r) | 380,000 | 340,000 | 280,000 | 5,900 |
| September 2018 (r) | 350,000 | 320,000 | 260,000 | 5,500 |
| August 2018 (r) | 320,000 | 290,000 | 240,000 | 5,200 |
| July 2018 (r) | 300,000 | 270,000 | 220,000 | 4,800 |
| June 2018 (r) | 280,000 | 250,000 | 200,000 | 4,500 |
| May 2018 (r) | 260,000 | 240,000 | 190,000 | 4,200 |
Source: DWP Universal Credit statistics.
Note: See Stat-Xplore for the complete data series. Figures marked (p) are provisional; figures marked (r) have been revised since the previous release.
Managed Payment to Landlord
Universal Credit, including support for housing costs, is usually paid directly to the household in a single payment. Where this is not suitable, landlords and claimants can apply for housing costs to be paid directly to the landlord through a Managed Payment to Landlord. In Scotland, claimants can choose a Direct Payment to Landlord through Universal Credit Scottish Choices.
Figure 15 shows the proportion of households receiving a payment of Universal Credit with entitlement to support for housing costs by Managed Payment to Landlord and Scottish Choices Direct Payment to Landlord in May 2019.
In May 2019, 210,000 (20%) of households that were entitled to support for housing costs had a Managed Payment to Landlord in place, while 20,000 (2%) have Direct Payment to Landlords as a result of a Universal Credit Scottish Choice.
Figure 15: Approximately 22% of households receiving Universal Credit payments with entitlement to support for housing costs have these paid directly to landlords
| Date | Managed Payment to Landlord (%) | Scottish Choice Direct Payment to Landlord (%) | No payments made directly to landlord (%) |
|---|---|---|---|
| May 2019 (p) | 20 | 2 | 78 |
| April 2019 (p) | 20 | 2 | 79 |
| March 2019 (p) | 20 | 2 | 78 |
| February 2019 (r) | 20 | 2 | 79 |
| January 2019 (r) | 20 | 2 | 79 |
| December 2018 (r) | 19 | 2 | 79 |
| November 2018 (r) | 20 | 2 | 79 |
| October 2018 (r) | 20 | 2 | 79 |
| September 2018 (r) | 20 | 2 | 79 |
| August 2018 (r) | 20 | 1 | 79 |
| July 2018 (r) | 20 | 1 | 79 |
| June 2018 (r) | 20 | 1 | 79 |
| May 2018 (r) | 20 | 1 | 79 |
Source: DWP Universal Credit statistics.
Note: See Stat-Xplore for the complete data series. Percentages may not add up to 100 due to rounding. Figures marked (p) are provisional; figures marked (r) have been revised since the previous release.
Split Payment and More Frequent Payment
In exceptional circumstances, payment of Universal Credit can be divided between 2 members of the household. In May 2019, around 50 households on Universal Credit received a Split Payment.
Where it is identified that one monthly payment is not suitable for a household, it may be possible to have their Universal Credit divided over the month to be paid more frequently, such as twice monthly or, exceptionally, 4 times a month.
Around 66,000 households (4%) on Universal Credit that received a payment did so in this way in May 2019. This includes those that have chosen to be paid more frequently via Universal Credit Scottish Choices, which is 39,000 households.
Payment timeliness – all claims
Figure 16 shows the proportion of households that received a Universal Credit payment that received all or some of their payment on time. Of the households on Universal Credit in April 2019 that have been paid, 94% received full payment on time, compared to 84% in April 2018. Additionally, 97% of households that were paid received some payment on time, compared to 95% in April 2018.
Figure 16: Around 94% of households received their entire Universal Credit payment on time
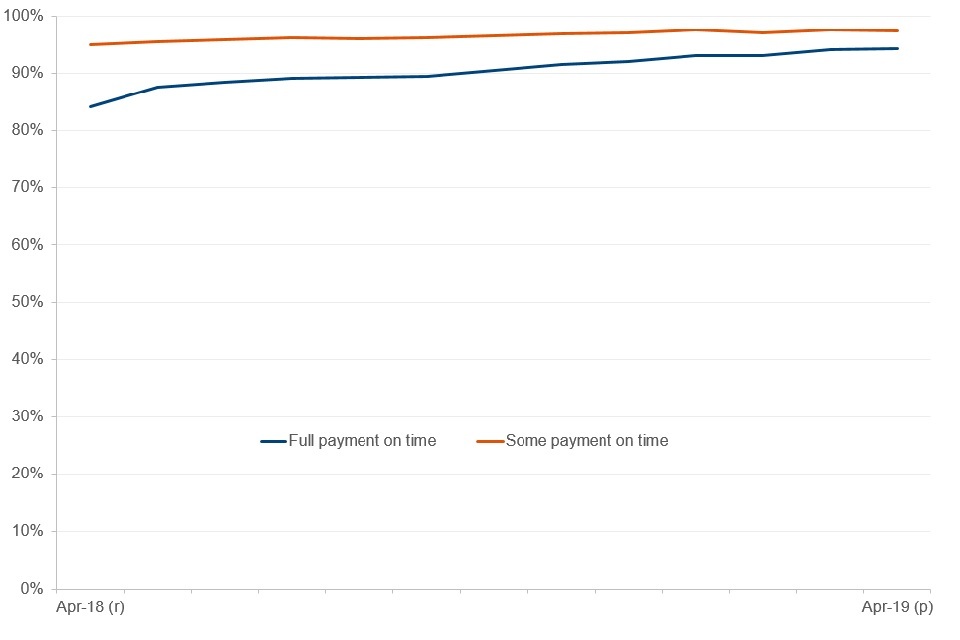
Around 94% of households received their entire Universal Credit payment on time
Source: DWP Universal Credit statistics.
Note: Payment timeliness statistics are available in Stat-Xplore from April 2019 onwards. To allow sufficient time for information to be gathered on all payments, figures are not included for the latest month in the series. Payment timeliness statistics for January 2017 to March 2019 for Universal Credit full service can be found in Table 6.1 of the data tables in the latest Universal Credit statistical release. Figures prior to April 2019 are Universal Credit full service only. Figures marked (p) are provisional; figures marked (r) have been revised since the previous release.
Payment timeliness – new claims
Payment timeliness is lower when looking at new claims than when looking at all claims. There are a number of one-off verification processes that must be completed by the claimant and by DWP at the start of the claim.
These are to confirm the current circumstances of the claimant (or both claimants in a joint claim) and their entitlement to Universal Credit. Delays to completion of these processes can interfere with payments being made on time.
Figure 17 shows the proportion of households that received a Universal Credit payment that received all or some of their payment on time for new claims only. Of the households with new claims to Universal Credit in April 2019, 83% of households that have been paid received full payment on time, compared to 71% in April 2018. Approximately 89 % of this group received at least some payment on time in April 2019. This compares to 84% that received some payment on time in April 2018.
Figure 17: Around 83% of households with new claims received their entire Universal Credit payment on time
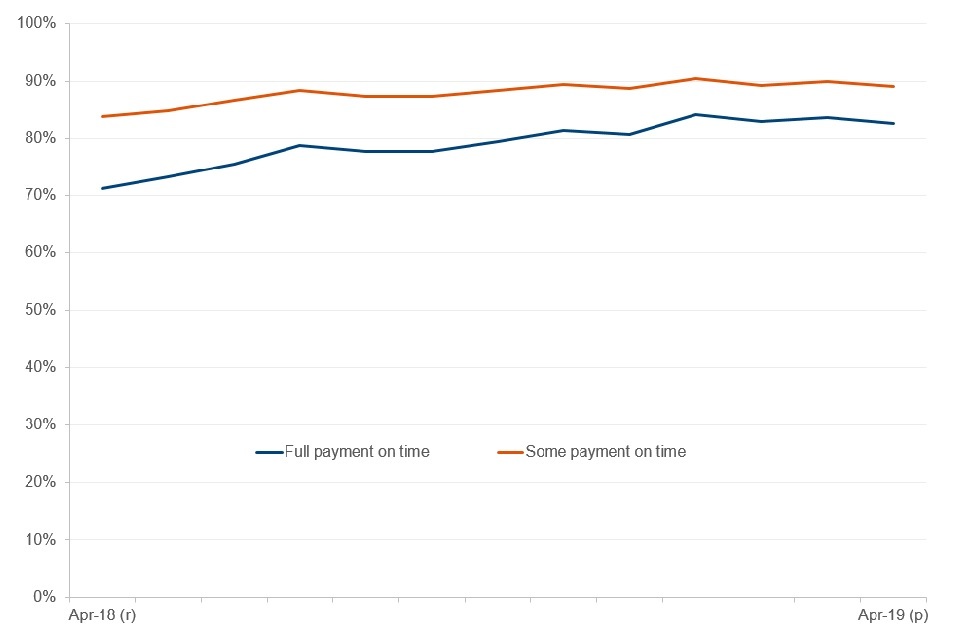
Around 83% of households with new claims received their entire Universal Credit payment on time
Source: DWP Universal Credit statistics.
Note: Payment timeliness statistics are available in Stat-Xplore from April 2019 onwards. To allow sufficient time for information to be gathered on all payments, figures are not included for the latest month in the series. Payment timeliness statistics for January 2017 to March 2019 for Universal Credit full service can be found in Table 6.1 of the data tables in the latest Universal Credit statistical release. Figures prior to April 2019 are Universal Credit full service only.Figures marked (p) are provisional; figures marked (r) have been revised since the previous release.
7. About these statistics
These official statistics have been compiled using data from systems within local offices and records of Universal Credit benefit payments made by the department.
These and other new data sources will, in time, allow a progressively wider range of breakdowns to be published as new IT systems are introduced. The methodology used and definitions of the official statistics may be updated within subsequent releases, along with information on the impact of any changes to the time series already released.
A strategy for the release of official statistics on Universal Credit was first published in September 2013 and last updated in January 2018.
These statistics have been developed using guidelines set out by the UK Statistics Authority and are official statistics undergoing evaluation. They have therefore been designated as Experimental Statistics. Users are invited to comment on the development and relevance of these statistics at this stage.
Rounding
Figures contained within this publication are subject to rounding unless otherwise stated. Percentages shown are calculated using figures prior to rounding. See the background information and methodology document for details on the level of rounding applied, which is dependent on the magnitude of the figure being quoted.
Roll out and migrating claimants from other benefits onto Universal Credit
Universal Credit was introduced in 2013 and was rolled out in stages across Great Britain by postcode area. The roll out process was completed in December 2018 and Universal Credit is now available in every jobcentre across Great Britain. By 2023, all existing legacy claimants will have moved on to Universal Credit.
8. Where to find out more
Build your own statistical tables using Stat-Xplore.
Use our interactive map of claimants at Jobcentre Plus office level.
Use our interactive map of households on Universal Credit at Local Authority level.
Use our interactive dashboard of households on Universal Credit at regional level.
Read older releases of statistics, but note that figures are subject to change.
Read the release strategy for the Universal Credit statistics.
Read the background information and methodology document.
Read information on Universal Credit sanctions.
Lead statistician: Christopher Johnston.