UK-Japan free trade agreement: the UK's strategic approach
Updated 4 January 2021

© Crown copyright 2021
This publication is licensed under the terms of the Open Government Licence v3.0 except where otherwise stated. To view this licence, visit nationalarchives.gov.uk/doc/open-government-licence/version/3 or write to the Information Policy Team, The National Archives, Kew, London TW9 4DU, or email: psi@nationalarchives.gov.uk.
Where we have identified any third party copyright information you will need to obtain permission from the copyright holders concerned.
This publication is available at https://www.gov.uk/government/publications/uks-approach-to-negotiating-a-free-trade-agreement-with-japan/uk-japan-free-trade-agreement-the-uks-strategic-approach
Chapter 1: strategic case
This chapter sets out the strategic approach for securing a bilateral trade agreement with Japan, as well as the evidence that supports this approach.
More trade is essential if the UK is to overcome the unprecedented economic challenge posed by coronavirus. It can give us security at home and opportunities abroad – opening new markets for business, bringing investment, better jobs, higher wages and lower prices just as we need them most. At a time when protectionist barriers are on the rise, all countries need to work together to ensure long-term prosperity and international trade is central to this cooperation.
That is why we will use our voice as a new independent trading nation to champion free trade, fight protectionism and remove barriers at every opportunity. The government’s ambition is to secure free trade agreements (FTAs) with countries covering 80% of UK trade within the next three years, to become a truly Global Britain.
An FTA with Japan, the third largest economy in the world in 2018, represents significant opportunities throughout the economy, from agriculture to digital and to increase the resilience of our supply chains and the security of our whole economy as we diversify our trade. Japan is a developed economy with high standards. The UK and Japan are major investors in each other’s economies, ranking fifth[footnote 1] and sixth[footnote 2] respectively for inward foreign direct investment.
Potential benefits from a deal include better jobs, higher wages, more choice and lower prices for all parts of the UK. The total value of trade between the UK and Japan in 2018 was just over £29 billion.[footnote 3] A UK-Japan FTA could increase trade between both countries by £15.2 billion in the long run (compared to 2018) and increase UK workers’ wages by £800 million.[footnote 4] This analysis relates to the long term, and implicitly assumes that by that period the economy would have recovered from any impacts of the coronavirus. At this point in time it is too early to identify whether or how the estimated impacts in this document might be affected by the current situation.
Removing trade barriers with Japan could deliver huge gains, both for the 8,000 UK small and medium-sized (SMEs) across the UK already exporting goods with Japan as well as those making plans to enter the Japanese market.[footnote 5] For example, total annual tariff reductions on goods exports to Japan could be worth around £33 million per year in the long run.[footnote 6]
Sectors set to benefit from a deal include textiles, agriculture, and the services industry. Now that we have left the EU, we can also make more progress in areas such as the free flow of data, which will support emerging fields such as artificial intelligence (AI) and the UK’s position as a technology superpower.
The government has been clear that when we are negotiating trade agreements, we will protect the National Health Service (NHS). Our objectives reinforce this. Any agreement will ensure high standards and protections for consumers and workers, and will not compromise on our high environmental protection, animal welfare and food standards.
The UK intends to use its voice as an independent trading nation to champion free trade. Japan is the third largest economy in the world. The UK and Japan are among the most vocal advocates for free trade and most determined defenders of a rules-based international trading system. Together, we can create new opportunities to trade, boost our nations’ economies, bring prosperity to our people and ensure the UK remains a gateway to Europe and beyond.
The outline approach published in Chapter 2 sets out the UK’s overall objectives for these negotiations, enabling us to begin full talks with Japan. These objectives are also underpinned by a call for input which gave the UK public, businesses and civil society a chance to highlight their priorities in a future trade agreement with Japan. Our response to this detailed input can be found in Chapter 3.
An FTA to underpin the UK’s strategy for Asia Pacific
These bilateral negotiations will also be a logical stepping stone to joining the Comprehensive and Progressive Agreement for Trans-Pacific Partnership (CPTPP). CPTPP is one of the world’s largest free trade areas, representing 13% of global gross domestic product (GDP) in 2018; increasing to more than 16% if the UK were to join[footnote 7], and Japan is the largest trading partner out of all the CPTPP member nations, representing over 28% of total CPTPP trade.[footnote 8]
Whilst the impact of coronavirus will inevitably affect near-term growth, joining CPTPP will mean we benefit from the significant long-term trade and investment opportunities for UK businesses in the Asia-Pacific region. CPTPP will open markets for UK businesses so that they can capitalise on these opportunities and diversify their exports.
The Asia Pacific region also affords major opportunity for some of UK industry’s priority sectors, with Japan at the forefront of some of these. For example, Japan leads the way in the areas of AI, data and ageing society. An FTA with Japan will be a driving force to put the UK at the forefront of these areas and maximise our advantage in the opportunities Asia Pacific affords.
An FTA that benefits the whole UK
This deal is expected to deliver a significant and sustained long-term boost to every region in the UK. The benefits include a substantial increase in trade in the long run, estimated to be around £15.2 billion. This would result in a projected £800 million boost to workers’ wages, as well as lowering prices on a range of key consumer goods imported from Japan.[footnote 9]
The parts of the United Kingdom that could benefit the most from the FTA are Scotland, the East Midlands, and London, but our scoping assessment shows that all regions will see a positive impact.
Higher wages and lower prices
The UK-Japan FTA could result in a £800 million boost to workers’ wages, as well as lowering prices on a range of key consumer goods imported from Japan.[footnote 10] The projected increase in wages, combined with lower priced consumer goods, would provide a boost for the living standards of households across the UK.
The deal could also contribute to improvements in productivity in the domestic economy. Studies show that this can result from increased international trade flows, which leads to greater specialisation and competition.
Total annual tariff reductions on goods imports from Japan could be worth up to around £275 million per year in the long run.[footnote 11] Some 59% of all Japanese goods imported into the UK and 44% of all UK goods exported into Japan are used in supply chains.[footnote 12] So as well as reducing the price of consumer goods, lower tariffs could also cut the costs of domestic production in both countries.
An FTA for SMEs, exporters and entrepreneurs
In our Japan FTA we will seek a dedicated SME chapter, and SME-friendly provisions throughout – on everything from customs and trade facilitation, services sectors and business mobility to telecommunications, digital trade and intellectual property – knocking down trade barriers that will benefit the 8,000 SMEs in every part of UK already exporting goods to Japan.[footnote 13]
We will agree cutting edge provisions on digital that maximise opportunities for digital trade across all sectors of the economy, providing trust and stability for UK businesses, entrepreneurs and exporters.
Business across the economy and the country will benefit from an FTA including:
- Digital trade: Ambitious digital provisions, including supporting the free flow of data between Japan and the UK, can help us take the lead on innovation, supporting the development of important emerging technologies such as blockchain, driverless cars and quantum computing.
- Professional and business services: The UK exported £1.5 billion of business services to the Japan, including in key areas of UK strength such as accountancy, engineering and legal services.[footnote 14] An FTA with Japan could allow professionals to move more easily and support recognition of professional qualifications, for example in accountancy and the legal profession.
- Financial services: The UK exported £4.1 billion of financial services to Japan,[footnote 15] and we expect that the sector could benefit from reduced barriers to cross-border trade and investment, as well as co-operation between the two countries on financial regulation.
- Agriculture: Our scoping assessment suggests that UK agriculture could benefit from an FTA with Japan through a combination of reduced tariffs and red tape for food and drink exports.
- Textiles and leather: Our scoping assessment suggests that this sector could benefit the most from an FTA with Japan due to a reduction in tariff and non-tariff barriers to trade. If no trade deal is negotiated with Japan, the vast majority of UK textiles and articles of leather exports to Japan could face tariffs of up to 10%.
- Automotive: Cars are one of our top goods exports to Japan, worth around £1.1 billion.[footnote 16] Our automotive exporters could benefit from reduced non-tariff barriers in an FTA.
- Creative industries: The UK’s world-leading creative industries sector will benefit and be supported by copyright provisions that link to an effective and balanced global system. We will establish frameworks for the industries of the future, with a focus on agreeing advanced digital trade provisions that promote an eco-system for businesses of all sizes across the UK to thrive.
Chapter 2: outline approach
Public negotiating objectives for a free trade agreement with Japan: overall objectives
- Agree an ambitious and comprehensive free trade agreement (FTA) with Japan that builds on the EU-Japan Economic Partnership Agreement (EPA), and secures additional benefits for UK businesses.
- Increase UK GDP and provide new opportunities for UK businesses, including small and medium-sized enterprises (SMEs) and investors, and facilitating greater choice and lower prices for UK producers and consumers.
- The government has been clear that when we are negotiating trade agreements, the National Health Service (NHS) will not be on the table. The price the NHS pays for drugs will not be on the table. The services the NHS provides will not be on the table. The NHS is not, and never will be, for sale to the private sector, whether overseas or domestic.
- Throughout the agreement, ensure high standards and protections for UK consumers and workers and build on our existing international obligations. This will include not compromising on our high environmental protection, animal welfare and food standards, and ensure both parties meet their commitments on climate change.
- Secure an agreement which works for the whole of the UK and takes appropriate consideration of the UK’s constitutional arrangements and obligations.
Trade in goods
Goods market access
- Secure broad liberalisation of tariffs on a balanced and mutually beneficial basis, taking into account UK product sensitivities.
- Secure comprehensive access for UK industrial and agricultural goods into the Japanese market through the reduction or elimination of tariffs.
- Develop simple and modern rules of origin that reflect UK industry requirements and consider existing as well as future supply chains, supported by predictable and low-cost administrative arrangements.
Customs and trade facilitation
- Secure commitments to efficient and transparent customs procedures which minimise costs and administrative burdens for businesses, while ensuring that customs authorities remain able to protect their regulatory, security and financial interests.
- Ensure that processes are predictable at, and away from, the border.
Technical barriers to trade
- Reduce technical barriers to trade by removing and preventing trade-restrictive measures in goods markets, while upholding the safety and quality of products in the UK.
- Seek arrangements to make it easier for UK manufacturers to have their products tested against Japanese rules in the UK before export.
- Promote the use of international standards to further facilitate trade between the parties.
Sanitary and phytosanitary measures (SPS)
- Uphold the UK’s high levels of public, animal, and plant health including food safety.
- Ensure access for UK agri-food goods to the Japanese market by securing commitments to improve the timeliness and transparency of Japanese approval processes for UK goods.
Good regulatory practice (GRP) and regulatory cooperation
- Reduce regulatory obstacles, facilitate market access for UK businesses and investors, and improve trade flows by ensuring a transparent, predictable, and stable regulatory framework to give confidence and stability to UK exporting businesses and investors.
- Secure commitments to key GRP provisions such as public consultation, use of regulatory impact assessment, retrospective review, and transparency, as well as regulatory cooperation.
Transparency
- Ensure world class levels of transparency between the UK and Japan, particularly with regards to the publication of measures (such as laws and regulations) affecting trade and investment, public consultation, and the right of appropriate review of these measures.
Trade in services
- Secure ambitious commitments on market access and national treatment to ensure certainty for UK services suppliers in their access to the Japanese market.
- Secure best-in-class rules for all services sectors, as well as sector specific rules to ensure transparency and support our world-leading services industries, including key UK export sectors such as financial services, professional and business services, telecommunications and transports services.
- Ensure certainty for UK services exporters in their continuing access to the Japanese market and transparency on Japanese services regulation.
Public services
- Protect the right to regulate public services, including the NHS and public service broadcasters.
- Continue to ensure that decisions on how to run public services are made by UK governments, including the devolved administrations (DAs), and not our trade partners.
Business mobility
- Secure opportunities for UK services suppliers and investors to operate in Japan through provisions for temporary business travel and supporting the recognition of professional qualifications.
Digital and e-commerce
- Secure cutting-edge provisions which maximise opportunities for digital trade across all sectors of the economy.
- Promote a world leading eco-system for digital trade that supports businesses of all sizes across the UK.
Telecommunications
- Promote fair and transparent access to the Japanese telecommunications market.
- Promote accessibility and connectivity for UK consumers and businesses in the Japanese market.
Financial services
- Expand opportunities for UK financial services to ease frictions to cross-border trade and investment, complementing co-operation on financial regulatory issues.
Investment
- Agree rules that ensure fair and open competition, and address barriers to UK investment across the Japanese economy.
- Ensure UK investors in Japan continue to enjoy high standards of treatment.
- Maintain the UK’s right to regulate in the national interest and as the government has made clear, continue to protect the NHS.
Intellectual property (IP)
- Secure protections for UK geographical indications (GIs). This should be in a way that reflects their geographical origins, getting the balance right for consumers so they are not confused or misled about the origins and the quality of goods.
- Secure copyright, patents, trade marks and designs provisions that:
- adequately secure protection for rights holders, whilst keeping the market open to fair competition
- protect the UK’s existing IP standards while encouraging and supporting innovation
- support the UK creative industries through a balanced and effective global framework
- do not lead to increased medicines prices for the NHS
- ensure consumer access to modern technology
- are consistent with the UK’s existing international obligations, including the European Patent Convention (EPC), to which the UK is a party
- Secure provisions that promote the transparent and efficient administration and enforcement of IP rights, and facilitates cross-border collaboration on IP matters.
- Secure the parties’ continued commitment to the Doha Declaration on Public Health, the TRIPS Agreement, other multilateral IP treaties and conventions, and agreed flexibilities that support access to medicines, particularly during public health emergencies in developing countries.
Competition law, subsidies, procurement and state-owned enterprises
Competition
- Provide for effective competition law and enforcement that promotes open and fair competition for UK firms at home and in Japan.
- Provide for transparent and non-discriminatory competition laws, which respect procedural rights for businesses and people under investigation.
- Promote effective cooperation between enforcement agencies.
Subsidies
- Secure industrial subsidies provisions that promote open and fair competition for UK firms at home and in Japan.
Government procurement
- Secure access that goes beyond the level set in the World Trade Organisation (WTO) Government Procurement Agreement (GPA) based on clear and enforceable rules and standards.
- Secure rules to ensure that procurement processes are simple, fair, open, transparent and accessible to all potential suppliers in a way that supports and builds on commitments in the WTO GPA.
- Ensure appropriate regard to public interests and services, including the need to maintain existing protections for key public services, such as NHS health services.
State-owned enterprises (SOEs)
- Provide for open and fair competition between commercially oriented SOEs and private businesses by preventing discrimination and unfair practices.
- Secure transparency commitments on SOEs.
- Ensure that UK SOEs, particularly those providing public services, can continue to operate as they do now.
Sustainability, labour and environment
- Ensure parties reaffirm their commitment to international environment and labour standards.
- Ensure parties do not fail to enforce their domestic environmental or labour protections in ways that create an artificial competitive advantage.
- Include measures which allow the UK to maintain the integrity, and provide meaningful protection, of the UK’s world-leading environmental and labour standards.
- Secure provisions that support and help further the government’s commitments on climate change and achieving net zero carbon emissions by 2050, including promoting trade in low carbon goods and services, supporting research and development collaboration and maintaining both parties’ right to regulate in pursuit of decarbonisation, and reaffirming our respective commitments to the United Nations Framework Convention on Climate Change (UNFCCC) and the Paris Agreement.
- Apply appropriate mechanisms for the implementation, monitoring and dispute resolution of environmental and labour provisions.
Trade remedies
- Ensure provisions that uphold WTO commitments and are underpinned by transparency, efficiency, impartiality and proportionality.
- Support trade liberalisation in the agreement by protecting against unfair trading practices and import surges.
Dispute settlement
- Establish appropriate mechanisms that promote compliance with the agreement and seek to ensure that state to state disputes are dealt with consistently and fairly in a cost-effective, transparent and timely manner whilst seeking predictability and certainty for businesses and stakeholders.
Small and medium-sized enterprises (SMEs)
Support UK SMEs to seize the opportunities of UK-Japan trade, by:
- ensuring a dedicated SME chapter to facilitate cooperation between the UK and Japan on SME issues of mutual interest
- ensuring that SMEs have easy access to the information necessary to take advantage of the trade opportunities generated by the agreement
- ensuring SME-friendly provisions are included that support businesses exporting both services and goods
General provisions
- Ensure flexibility for the UK government to protect legitimate domestic priorities by securing adequate general exceptions to the agreement.
- Provide for prompt and open information sharing between the UK and Japan.
- Seek opportunities for co-operation on issues related to economic growth.
Territorial application
- Provide for application of the treaty to all four constituent nations of the UK, taking into account the effects of the Northern Ireland Protocol.
- Provide for further application of the agreement to the Crown Dependencies and Overseas Territories as appropriate.
Chapter 3: response to the call for input on trade negotiations with Japan
In January 2019, the UK and Japan agreed to negotiate a new bilateral agreement using the existing EU-Japan Economic Partnership Agreement (EPA) as a basis, ensuring the new agreement is as ambitious, high standard and mutually beneficial as the EPA and enhanced in areas of mutual interest. In order to understand the priorities of businesses, interest groups and members of the public for a future trade agreement with Japan, the Department for International Trade launched a call for input which asked questions about where stakeholders see challenges and opportunities for trading with Japan.
The call for input ran for 6 weeks, between 20 September 2019 and 4 November 2019. In support of its launch, we held a series of stakeholder events in London, Belfast and Edinburgh, in addition to a webinar, to meet directly with stakeholders to discuss their views and encourage responses to the call for input.
We would like to thank all those who took the time to respond to this call for input.
Why this free trade agreement?
Japan and the UK have a longstanding international relationship in trade and beyond. We are two like-minded, free trading nations, who share common values and are committed to upholding the rules-based international system.
Japan is the world’s third largest economy and is currently the UK’s fourth largest non-EU export market (and 11th globally), accounting for just over 2% of the UK’s total exports in 2018.[footnote 17] Total trade between the two countries was worth around £29.5 billion in 2018, with over half of this being goods trade.[footnote 18]
The EU-Japan EPA entered into force on 1 February 2019. The UK has the opportunity to sign a bilateral agreement with Japan that is more tailored to the UK economy and could generate greater benefits for the UK. The new agreement would build on existing cooperation between the UK and Japan in international fora, such as the G20 and World Trade Organisation, which include supporting trade liberalisation and the rules-based system.
What we asked
The call for input questions focused on ways in which the EU-Japan EPA could be made more ambitious. The questions were therefore focused on that particular theme.
They were:
-
[Are you / is your business / is your organisation] aware of the Economic Partnership Agreement that came into force between the EU and Japan in February this year?
-
Which of the following trade related areas best describe the areas of the Economic Partnership Agreement that are important to [you / your business / your organisation]? [Please select all that apply]
- Goods trade
- Services trade
- Regulation and standards
- Cross border investment
- Small and medium sized enterprises (SMEs)
- Competition law, subsidies, procurement and state-owned enterprises (SOEs)
- Intellectual property
- State to state dispute settlement
- Structure of the agreement
- Other
- None
- Don’t know
-
Based on your selection above, which areas of the Economic Partnership Agreement between the EU and Japan are important to [you or the UK / your business / your organisation] and in what ways are they important?
-
Which of the following trade related areas best describe the areas of the Economic Partnership Agreement that the UK government should consider changing during future negotiations? [Please select all that apply]
- Goods trade
- Services trade
- Regulation and standards
- Cross border investment
- small and medium sized enterprises (SMEs)
- Competition law, subsidies, procurement and state-owned enterprises (SOEs)
- Intellectual property
- State to state dispute settlement
- Structure of the agreement
- Other
- None
- Don’t know
-
Based on your selection above, which areas of the Economic Partnership Agreement between the EU and Japan do you think the UK government should consider improving during future trade negotiations with Japan and why?
-
Is there anything else that you would like to say about the UK’s future trade and investment relationship with Japan?
Overview of the responses
In total, we received 124 responses to the call for input. Respondents were given the option of replying either through our online tool, hosted on the Qualtrics platform, or to a Department for International Trade-monitored inbox. On request, the questions that were included via the online platform were provided to respondents in a PDF copy to facilitate review and distribution.
The online survey had a total of 46 questions. All respondents were asked the same core 6 questions as listed above, alongside 6 questions for identification and data protection purposes. In addition, demographic and logistical questions were asked, targeted at each group. Individuals were asked 8 questions, NGOs 6 questions, PSBs 4 questions, businesses 10 questions, and business associations 6 questions.
The division between the number of responses can be seen below:
- Online survey responses: 72
- Emails: 52
- Campaign: 0
Respondents were categorised into one of the following five groups:
- An individual – Responding with personal views, rather than as an official representative of a business, business association or another organisation.
- Business – Responding in an official capacity representing the views of an individual business.
- Business association – Responding in an official capacity representing the views of a business representative organisation or trade association.
- Non-governmental organisation (NGO) – Responding in an official capacity as the representative of a non-Governmental organisation, trade union, academic institution or another organisation.
- Public sector body (PSB) – Responding in an official capacity as a representative of a local Government organisation, public service provider, or another public sector body in the UK or elsewhere.
A breakdown of responses by respondent group can be seen below:
| Respondent group | Responses (portal) | Responses (email) |
|---|---|---|
| Individual | 21 | 5 |
| NGO | 4 | 5 |
| Business | 25 | 14 |
| Business association | 18 | 28 |
| PSB | 4 | 0 |
| TOTAL | 72 | 52 |
Summary of responses
This document summarises the individual policy areas that were raised through the Japan call for input, and groups together the key asks from each of these. A short response has been provided here, whilst more detail about how we will approach each of these areas in the negotiations can be found in the accompanying uutline approach document.
Section 1: general themes
Respondents identified a wide range of priorities for a potential future UK-Japan free trade agreement, particularly with regard to where they would like to see us go further than the EU-Japan EPA. The summary below sets out the key themes across the call for input, while Section 2 categorises some of the more specific asks.
Theme 1: maintain the ambition found in the EU-Japan Economic Partnership Agreement.
In general, many respondents were clear that they would like to see the ambition and achievements of the EU-Japan EPA protected in any future trade agreement with Japan, with 40 separate responses noting this preservation as particularly important.
As such, organisations or individuals from almost every sector noted the importance of protecting the terms of the existing EU-Japan EPA, including provisions for services, goods, GI and IP, sustainability, regulations and standards, e-commerce, and SMEs.
Policy explanation
The EU-Japan EPA entered into force in February 2019. The UK has been a long-standing supporter of the EU-Japan EPA, which was approved overwhelmingly by the UK Parliament after it was debated on the floor of the House of Commons on 26 June 2018 with 317 votes in favour and only 1 against. The EU-Japan EPA is positive for the UK, the wider EU and global free-trade. In the long term, the agreement liberalises tariffs on the vast majority of products.
In January 2021 the EU-Japan EPA will no longer apply to the UK. The UK clearly recognises the importance of a timely future trade deal with Japan. The UK and Japan have agreed to negotiate a new bilateral agreement using the existing EPA as a basis, ensuring the new agreement is as ambitious, high standard and mutually beneficial as the EPA and enhanced in areas of mutual interest.
We have noted in each of the policy areas below where there were requests for continuity and have responded in kind.
Theme 2: that a deal with Japan is concluded quickly in order to protect UK businesses.
Four respondents made explicit reference to the fact that there should be as little disruption as possible to their current trading arrangements under the EU-Japan EPA, so have asked for a deal to be agreed quickly. Additional respondents implied that a deal needed to be done quickly by stressing the importance of the existing EPA.
Policy explanation
The government recognises that if there is not an agreement in place by January 2021, the UK and Japan would return to WTO terms. This would have an effect on both UK and Japanese businesses. The government therefore recognises the desirability of trying to get a new agreement in place by the end of the transition period to maintain current preferential treatment.
Section 2: summary of responses by policy area
Trade in goods
Trade in goods refers to the import and export of materials between the UK and Japan, including those goods listed in the tariff schedule of both countries.
Rules of origin (RoO)
RoO are a key component of any trade agreement, as they define the processes that must take place in order for goods to be eligible for the market access liberalisation achieved in the agreement. They also prevent circumvention of tariffs and tariff quotas by goods from countries which are not parties to the agreement.
RoO was raised by 17 respondents. The main views and recommendations relating to rules of origin for trade between the UK and Japan were:
- To recognise existing supply chains and ensure continuity for UK industries that currently qualify for preferential treatment through the EU-Japan EPA.
- To ensure that the rules of origin in a UK-Japan agreement are clear, simple, and easily applicable. This includes greater flexibility for exporters to confer origin, using any one of change in tariff classification, value added or specific processing rules.
- To ensure simple and predictable administration requirements for complying with rules of origin, and remove unjustifiable administrative barriers that companies currently face when exporting to Japan.
- To provide for alignment on administration between a UK-Japan agreement and the EU-Japan EPA, including using the same format of the statement of origin.
Policy explanation
The government recognises that a key issue for UK businesses is the complex, and sometimes inconsistent, procedures with exporting to Japan under the EPA. The UK’s objective will be to agree rules of origin with Japan that are clear and flexible for UK producers, and to have procedures for exporting to Japan that are as simple, predictable and provide as much continuity as possible.
Tariffs
Tariffs are customs duties on imported goods. Tariffs are normally applied on a Most Favoured Nation (MFN) basis. This means that there can be no discrimination in duties applied to goods from any World Trade Organisation member, unless there is a preferential trade agreement.
Under the EU-Japan EPA bilateral tariffs are reduced or removed on the vast majority of products. This facilitates the export of UK goods to Japan and the availability of Japanese goods in the UK.
The main views and recommendations relating to tariffs for trade between the UK and Japan raised by forty respondents were that:
- exporters in both countries should continue to benefit from the tariff reduction/elimination secured by the EU-Japan EPA including ‘inheriting the clock’ for the staged tariff reduction in the EPA, i.e. that the liberalisation in the UK-Japan EPA should at a minimum not fall behind that in the EU-Japan EPA.
- tariffs in both countries should be eliminated further and/or faster than foreseen by the provisions of the EPA for a range of industrial and agricultural goods.
Policy explanation
The EU-Japan EPA already liberalises tariffs significantly. The government recognises that a key concern of UK and Japanese businesses alike is to also secure the current staging schedule for tariff liberalisation. The government will consider whether for some tariff lines it would be beneficial to seek or provide accelerated liberalisation.
Customs
The customs and trade facilitation chapter of a trade agreement ensures that procedures at the border are as facilitative and predictable as possible to make importing and exporting easier. Reducing customs delays and costs could increase the ability of businesses, especially small and medium sized enterprises (SMEs), to trade with Japan. Chapter 4 of the EPA sets out the commitments made by both sides on the treatment of goods at the border.
The main views and recommendations relating to customs procedures for trade between the UK and Japan raised by thirteen respondents were:
- to maintain the existing facilitations available to businesses exporting to Japan, including both the Authorised Economic Operator scheme and the temporary admission of specified goods without duty
- to ensure the efficient implementation and enforcement of the customs and trade facilitation provisions in the agreement
- minimising delays and ensuring procedures are as simple, efficient and transparent as possible, making use of improved electronic systems
- consideration of the fees, charges and VAT which are levied on traders
- consideration of the de minimis level for traders
Policy explanation
The government recognises the importance of customs procedures which are efficient and predictable for both UK importers and exporters. The government also recognises that, to ensure compliance burdens are minimised, the UK should seek to be at the forefront of global customs policy and committed to reducing frictions.
Regulation and standards
One of the main barriers to international trade, especially for small and medium-sized enterprises (SMEs), is the difference between countries in what producers need to do to show that their products are safe and effective for that market.
The EU-Japan EPA seeks to establish clear and mutually advantageous rules governing trade and investment between the parties and to reduce or eliminate barriers. To achieve this, the EU and Japan have made commitments on regulations and standards in several areas:
- sanitary and phytosanitary measures (Chapter 6)
- technical barriers to trade (Chapter 7)
- corporate governance (Chapter 15)
- transparency (Chapter 17)
- good regulatory practices and regulatory cooperation (Chapter 18)
The main views and recommendations relating to regulations and standards for trade between the UK and Japan raised by thirty-one respondents were:
- the agreement should seek to further facilitate regulatory cooperation between the UK and Japan
- the agreement should maintain current UK standards and avoid downward pressure on the UK compliance system
- the UK should secure mutual recognition of conformity assessment and reduce duplicative regulatory requirements that impede access
- a UK-Japan FTA should retain the EPA automotive annex and explore additional annexes that cover regulation in the cosmetic and wine and spirits sectors
- the agreement should maintain and improve the regulatory and supervision standards from the EU-Japan EPA
- to maintain a regulatory cooperation committee (the EU-Japan EPA forms a committee on regulatory cooperation), however some respondents raised concerns that the EU-Japan EPA’s provisions for regulatory dialogue risks putting downwards pressure on standards
- to ensure that the UK maintains existing standards on animal welfare and food safety, including with regard to the UK’s position on whaling and dolphin hunting
- to include the precautionary principle in any future trade deal with Japan
- to ensure efficient veterinary approval across multiple sectors
- that Japan should adopt UK SPS standards and maintain strict rules against GMOs and hormones in beef
- to maintain the UK’s right to regulate for new SPS measures and that the UK should be able to put in place effective import controls
- to maintain an SPS committee similar to that in the EU-Japan FTA
- that Japan should make changes to their additive regime
- that Japan should accept UK risk assessments for BSE risk and lift its ban on UK bovine material in vaccines.
- that Japan should make changes to its medicines evaluation and reimbursement regimes to allow fair and equitable access for British companies
Policy explanation
The government will continue to ensure the safety and quality of products on sale in the UK, recognising the important role that international standards play.
The UK is also committed to the transparent and predictable development of regulations. We recognise the benefits of the current EU-Japan EPA to UK businesses and that preserving the terms included in that agreement will be important to the UK.
The UK will maintain its own autonomous sanitary and phytosanitary (SPS) regime to protect human, animal and plant life and health and the environment, reflecting its existing high standards. We will retain the provisions relating to cooperation on matters relating to animal welfare in the current EU-Japan EPA. We will not compromise on our high environmental protection, animal welfare and food standards. The import of whale and dolphin meat is prohibited in the UK and this will not be changed in a future UK-Japan agreement.
Trade in services
In trade agreements, parties agree a desired level of liberalisation through trade in services obligations and commitments. This is so that service suppliers abroad can be confident that they will not face discrimination or protectionism when exporting to, or investing in, a partner’s market. The interconnectedness of goods and services, for example through services incidental to manufacturing, also means that the benefits from the liberalisation of services trade under a UK-Japan agreement are likely to have positive spillover effect on goods trade and vice-versa.
Respondents identified opportunities for greater trade liberalisation in services trade with Japan in the following areas.
- Many respondents noted that provisions for the Mutual Recognition of Professional Qualifications (MRPQ) are an important aspect of services trade liberalisation.
- Respondents raised that firms face establishment requirements, burdensome administrative procedures, and legal uncertainty when providing services in Japan.
- Some respondents proposed to enhance the commitments made on financial services in the Japan-EU EPA to ensure that issues such as regulatory coordination and cross-border financial data flows are adequately covered in a future UK-Japan agreement. Other specific asks, including in relation to banking, insurance, and asset management were also raised.
- Several respondents suggested that the UK seek ongoing rights for the temporary entry of workers to supply services in Japan, whilst some consider further visa liberalisation in a future UK-Japan agreement as a potential benefit. Other respondents raised the importance of temporary entry of workers and transparency on visa processing as particularly relevant to small and medium sized enterprises.
- Some respondents had concerns that the existing Japan-EU EPA limits the government’s right to regulate in the public interest, and that mutual recognition frameworks should not undermine professional standards or patient safety in the health sector.
Policy explanation
The government recognises the benefits of the EU-Japan EPA for UK service suppliers. The government’s position is that we should secure ambitious levels of market access. This will ensure certainty for UK services suppliers in their continuing access to the Japanese market, maintain existing transparency of Japanese services regulation, and prevent discrimination. Where appropriate and possible, the government will seek to improve upon the terms of the EU-Japan EPA for UK service suppliers. The government will seek to secure opportunities for UK services suppliers and investors to operate in Japan through provisions for temporary business travel and supporting the recognition of professional qualifications.
The delivery of public services is safeguarded in the trade in services aspects of all trade agreements the UK is party to. In the EU’s trade agreements, the UK’s public services are protected by specific exceptions and reservations. Having left the EU, the UK will continue to ensure that public services – including the National Health Service (NHS) – are protected in all trade agreements it is party to, whether transitioned from an EU context or as a result of new negotiations. Protecting the UK’s right to regulate in the public interest and protect public services, including the NHS, is of the utmost importance. The government has been clear that when we are negotiating trade agreements, the NHS will not be on the table. The price the NHS pays for drugs will not be on the table. The services the NHS provides will not be on the table. The NHS is not, and never will be, for sale to the private sector, whether overseas or domestic.
Digital and telecommunications
Digital trade supports the UK economy and is vital to both goods and services exports.
The main views and recommendations relating to digital trade between the UK and Japan raised by respondents were:
- some respondents stated the importance of facilitating the free flow of data and protecting personal data
- the responses included the need to consider the unique circumstances of financial services data
- the responses included a request for closer regulatory cooperation for data and information-sharing between the UK and Japan
- the inclusion of a comprehensive digital trade chapter that reflects the interests of all digital stakeholders was suggested
- the responses included the suggestion for government data to be available in machine-readable/searchable formats
- some respondents suggested measures be pursued to better protect digital intellectual property
- a number of responses supported the prohibition of customs duties on electronic transmissions
- several respondents made comments which suggested several approaches on how the UK should approach creative industries
- the establishment of an internet communications technology dialogue between the UK and Japan was requested alongside the continuation of current levels of cooperation
Policy explanation
The government recognises that the EU-Japan EPA achieved results in a number of the areas highlighted via the call for input, including customs duties and intellectual property. The government will seek to replicate these provisions.
The government also recognises the calls for high ambition in the responses, including through the request for a dedicated digital trade chapter. The UK will seek to retain and build upon the commitments in the Economic Partnership Agreement in order to agree an improved digital package that maximises opportunities for digital trade across all sectors of the economy. The government will ensure positive co-operation between the UK and Japan in this area and on future innovation within the digital sector.
The government notes stakeholders’ concerns on the importance of data protection and privacy standards. The UK will seek to facilitate the continued flow of data with the EU and international partners, whilst ensuring the UK’s high standards of personal data protection. It notes the interests in facilitating the free flow of data and eliminating unjustified data localisation requirements.
Investment
The main views and recommendations relating to the investment relationship between the UK and Japan raised by respondents were:
- some were in favour and some were against the inclusion of investment protection and Investor-State Dispute Settlement (ISDS) provisions in a new UK-Japan trade agreement
- the importance of replicating the investment liberalisation provisions in the EU-Japan EPA and parts of the treaty that address non-formal barriers to investment in Japan, such as the corporate governance chapter
- to go beyond the EPA in addressing formal and non-formal barriers to investment in Japan, including raising equity caps, establishing a less restrictive investment screening regime and ensuring governmental, regulatory and legislative consultations are published in English
Policy explanation
The government recognises the importance of maintaining and increasing UK-Japan foreign direct investment. UK investors who invest overseas are able to access new markets, increase their financial returns and contribute to both the UK and foreign economies. Foreign investment into the UK provides capital for major projects, helps to fund start-ups and generates economic growth. The government recognises the desirability in providing a supportive environment for investment.
The government will seek to ensure that UK investors in Japan continue to enjoy high standards of legal treatment. We will also safeguard the UK’s right to regulate in the public interest.
Intellectual property (IP)
A balanced and effective IP regime is an essential element of a vibrant and creative economy, providing confidence and protection for innovators and creators, while also reflecting wider public interests. As part of the EU-Japan EPA, the EU and Japan agreed to a comprehensive IP chapter that promotes cross-border cooperation and enforcement, while reducing friction for business wanting to trade and invest abroad.
In addition, Japan agreed to protect six UK geographical indications (GI):
- Scottish farmed salmon
- Irish cream
- Irish whiskey
- Scotch whisky
- blue/ white Stilton cheese
- West Country farmhouse Cheddar cheese
The main views and recommendations relating to intellectual property for trade between the UK and Japan raised by thirty-one respondents are below:
- the agreement should require Japan to introduce an Artists’ Resale Right
- provisions should be included to provide better protections for the publishing industry and freedom of speech
- a provision should be included on Collective Rights Management (CRM) that places greater responsibility on Japan to ensure transparency, non-discrimination and accountability
- Japan should adopt a public performance right
- Japan should introduce civil liability for the secondary infringement of IP rights
- the duration and scope of Supplementary Protection Certificate (SPC) protection should be in line with UK standards
- the term of data and market exclusivity for pharmaceuticals should be extended in Japan, in line with UK standards
- provisions to make processes easier for SMEs to be granted patents
- strong measures should be included to prevent the theft of trade secrets, including cyber theft
- Japan should have effective enforcement mechanisms in place with regards to remedies and sanctions and should undertake improved efforts to tackle online IP infringement, including by introducing website blocking
- there should be protections for more UK geographical indications (GIs), with improved enforcement in Japan
- the UK should ensure continued membership to the European Patent Convention (EPC), a non-EU agency, and the Unified Patent Court Agreement (UPCA)
Policy explanation
The UK is widely recognised as being a world leader in IP protection, providing an effective balance between rights holders, users and consumers. IP-rich and creative industries make a significant contribution to the UK economy. Chapter 14 of the EU Japan EPA contains measures aimed at protecting and enforcing IP rights. The Government takes note of the above provisions. While we will seek to include provisions in some areas that go beyond our multilateral obligations, any provisions in a UK-Japan FTA will need to be compliant with the WTO TRIPS Agreement, to which both the UK and Japan are Members.
Competition law, subsidies, procurement and state-owned enterprises
The UK and Japan are both countries with robust competition rules, which allow businesses to compete freely and fairly to the benefit of consumers. Chapters 11, 12 and 13 of the EU-Japan EPA cover competition, subsidies and state-owned enterprises.
The main views and recommendations relating to competition law, subsidies, procurement and state-owned enterprise for trade between the UK and Japan raised by 30 respondents are split into two sections below.
Competition
With regard to competition, respondents wanted consumer protection provisions included in a future FTA, such as a specific consumer chapter to support consumer rights in trade, a standstill provision to be included so that there is a ‘floor’ on consumer rights with provisions dedicated to enhancing them.
On other competition matters respondents called for an FTA to have provisions for:
- both the UK and Japan to maintain an independent competition authority
- provisions preventing anti-competitive conduct which grant business legal certainty and transparent reciprocal market surveillance and enforcement co-operation to be more explicitly mentioned
Policy explanation
The government recognises that NGOs and other interested parties in the UK want to see consumer protections covered in a future UK-Japan FTA. The government notes the views that there should be no regression in the current commitments to consumer rights and competition policy.
Procurement
Procurement provisions in FTAs promote transparency, non-discrimination and competition within the trading partners’ public procurement markets, ensuring that in those procurements covered by the agreement, suppliers from the other party are treated the same as national suppliers. Chapter 10 of the EPA includes specific provisions on government procurement which extend beyond both EU and Japanese commitments in the WTO agreement on government procurement (GPA). The EPA therefore gives businesses increased and improved access to contracts with both the EU and Japan committing to treat suppliers to government from the other party in a fair and non-discriminatory manner.
The main views and recommendations related to UK and Japanese businesses’ access to one another’s procurement markets raised by respondents are below:
- To maintain guaranteed access to Japanese ‘core cities’ and further open the public procurement market, including energy and infrastructure markets.
- To ensure access to government procurement for financial and related professional services in respective markets.
- To ensure the EPA includes regulatory frameworks providing for fair and transparent public procurement regimes.
- To retain access to the EU-Japan government procurement portal or equivalent.
- To retain the SME facilitation provisions in the EPA and for Japan to provide procurement thresholds which are adjusted to SMEs.
- To ensure that local authorities should still be able to take into consideration environmental and social considerations in awarding contracts.
- Concern about allowing Japanese firms to bid for publicly funded healthcare contracts and a request that a future UK-Japan FTA should exclude the NHS.
- To favour domestic suppliers and limit the scope of the procurement chapter in future FTAs.
- Concern that the government procurement dialogue (between regulators of the EU and Japan) created by the EPA lacks appropriate scrutiny from national legislatures.
Policy explanation
The government recognises the importance of the non-discrimination provisions in the EPA and its position is that these should be maintained. The government’s position is to also secure the level of market access opportunities for UK businesses and explore opportunities to build on the EPA, whilst retaining existing protections for key UK public services. The EPA does not apply to the procurement of UK healthcare services. Furthermore, it does not apply to the procurement of goods and services indispensable for national security or defence purposes. This will not change in a UK-Japan agreement.
There were some comments calling for the UK’s international procurement obligations to favour UK domestic suppliers, but the UK’s domestic regulations, which apply to government procurement, generally require contracting authorities and contracting entities to treat suppliers equally and without discrimination. These principles will continue now the UK has left the EU.
Sustainability, labour, gender equality and environment
In the context of a trade agreement, labour, environment and sustainability provisions typically refer to commitments made through international obligations like the International Labour Organisation (ILO) conventions and multilateral environmental agreements (MEAs). Trade agreements also often stipulate commitments to cooperation in these areas.
The EU-Japan EPA contains a full trade and sustainable development (TSD) chapter. This chapter sets out commitments to effectively implement obligations on labour and environment and highlights the EU and Japan’s recognition of the linked nature of economic, social and environmental development.
The main views and recommendations relating to sustainability, labour, gender equality and the environment for trade between the UK and Japan raised by nine respondents are below:
- That the TSD chapter in the EU-Japan EPA should be used as a baseline, building on the provisions included. This could include anti-corruption measures, or further cooperation on environmental goods and services in the future.
- That labour and human rights provisions, sustainable development and environmental standards should be protected and enforceable, as well as closely aligned with the UK-EU FTA and consistent with multilateral commitments and international agreements such as the Paris Agreement and the United Nations Framework Convention on Climate Change (UNFCC).
- That gender equality and women’s economic empowerment should be protected and promoted in the UK-Japan FTA. The UK should recognise and address the impacts of trade policy on different genders and ensure all agreements align with other international commitments on human rights.
- For a full impact assessment covering environmental and social issues to be carried out prior to and during the lifespan of a future agreement.
- That the future agreement should uphold the right to regulate and ensure that the UK and Japan have the freedom to develop and implement domestic law and policy.
- That robust, transparent and reliable procedures for monitoring the implementation of the commitments should be contained in the agreement, that trade unions be given a role in this process, and that these commitments are paired with adequate enforcement mechanisms.
Policy explanation
We recognise that for the environment, climate, labour, and human rights, the key message communicated from the responses received is that the government should maintain the provisions already set by the EU-Japan EPA and not roll back on these, including on how these provisions are enforced. The government shares these views. Furthermore, we recognise that gender equality is an important issue and that women continue to face barriers in accessing the opportunities of free trade. More broadly the government is exploring domestic and international best-practice in order to develop our own approaches on how best to support women in trade. Furthermore, the government is committed to encouraging all states to uphold international human rights obligations.
Dispute settlement and trade remedies
Dispute settlement refers to the formal state-to-state mechanism for resolving disputes where one or more parties consider that there has been a breach of obligations under the relevant international trade agreement and it has not been possible to resolve the dispute informally. Chapter 21 of the EU-Japan EPA sets out the system to resolve disputes between the EU and Japan. It is only available to governments and does not relate to investor-state dispute settlement, which is not part of the EPA.
The main views and recommendations relating to dispute settlement and trade remedies for trade between the UK and Japan raised by nine respondents were:
- they wanted an independent, transparent dispute settlement mechanism
- that a dispute settlement mechanism be able to levy fines or other penalties
- the agreement includes provisions to permit the application of anti-dumping, countervailing measures and safeguards as per the WTO rules book
Policy explanation
The government considers an effective dispute settlement mechanism to be an appropriate part of an FTA. Effective dispute settlement mechanisms give the parties and stakeholders the confidence that commitments made under the agreement can be upheld, and that any disputes will be addressed fairly and consistently. Chapter 21 of the EU-Japan EPA contains state-to-state dispute settlement mechanisms to resolve disputes between the EU and Japan under the EPA, unless it states an area is specifically out of scope of the chapter. The UK considers this an effective and appropriate mechanism.
The government views trade remedies as an important part of a rounded trade policy. They provide a safety net to protect domestic industries if injured by unforeseen import surges or certain aspects of unfair trading (dumping and subsidy) or injury caused by unforeseen surges in imports. They can therefore help to build a broad base of support for trade liberalisation including from sensitive sectors. Trade remedies are about restoring a fair competitive environment, applying measures that are at a high enough level to provide protection, but without harming our downstream users or consumers.
SMEs
SMEs are an integral part of the UK economy. Over 99 percent of the business population in the UK are SMEs.[footnote 19] Barriers to trade disproportionately affect smaller firms and can even prevent them from exporting altogether. Chapter 20 of the EU-Japan EPA currently contains measures specifically aimed at helping SMEs, although the benefits are available to all businesses.
The main views and recommendations relating to SMEs for trade between the UK and Japan raised by sixteen respondents were:
- for Chapter 20 measures to help SMEs be preserved, including the creation of free online information that explains parts of the EPA relevant to SMEs and enable them to have easier access to procurement contracts
- reduction of non-tariff barriers for SMEs
- that an SME committee is established and can collaborate with other committees on SME issues, including on rules of origin and custom issues
- for low cost IP protection for SMEs
- that we consider improvements in the areas of e-commerce, intellectual property, trade facilitation and the use of obligatory language
- ensuring that simplified customs procedures and trusted trader schemes are suitable for SMEs
Policy explanation
The government is committed to seeking an FTA that reduces potential barriers to trade. The government recognises the varied views around the opportunities and the risks for SMEs. We will seek to ensure that even SMEs with limited organisational capacity can take advantage of the benefits achieved through the agreement, supporting businesses exporting both services and goods. We will also seek commitments from Japan to make information about rules relating to trade and investment transparent and easily accessible.
We will seek to agree an appropriate framework for collaborating with Japan on issues affecting SMEs.
The government recognises that the EU-Japan EPA provided SMEs with better market access. Preserving these benefits and enhancing them where possible will be important to the UK.
Next steps
As we have been developing our independent UK trade policy, the government has been consulting with stakeholders through both informal and formal mechanisms. These have included dialogues with the Secretary of State for International Trade, Ministers and Officials.
We will ensure that our new agreements and our future trade policy work for the whole of the UK and its wider UK family, Parliament, local government, business, trade unions, civil society and the public from every part of the UK will have the opportunity to engage and contribute. We will ensure that we continue to work closely with the devolved administrations in developing trade policy.
This will be delivered by:
- open public consultations, to inform our overall approach and the development of our policy objectives
- use of the Strategic Trade Advisory Group (STAG), to seek informed stakeholder insight and views on relevant trade policy matters
- use of Expert Trade Advisory Groups (ETAGs), to contribute to our policy development at a detailed technical level
- engagement outreach events across the English regions and in the Devolved Nations.
The STAG’s principal purpose is for the government to engage with stakeholders on trade policy matters as we shape our future trade policy and realise opportunities across all nations and regions of the UK through high level strategic discussion. The STAG’s remit extends across the breadth of trade policy.
Find out who is currently a member of the STAG.
The objective of the ETAGs is to enable the government to draw on external knowledge and experience to ensure that the UK’s trade policy is backed up by evidence at a detailed level and is able to deliver positive outcomes for the UK. We will draw on the expertise of these groups to gather intelligence for informing the government’s policy positions.
The government is committed to ensuring we will have appropriate mechanisms in place during negotiations to inform the government’s position. As we move forward, we will review our approach to engagement, and consider whether existing mechanisms are fit for purpose.
The government will ensure that our trade policy is transparent and subject to appropriate Parliamentary scrutiny. We will publish our approach to negotiations, call for input response and scoping assessment, and work with the appropriate Parliamentary scrutiny committees. During negotiations with Japan, the government will provide updates to Parliament.
After launching negotiations with Japan, we will seek to agree a high-quality and mutually beneficial trade agreement which furthers the UK’s key interests. Throughout this process we will be reflecting on the responses to the public call for input conducted in 2019 as well as those submitted via the CPTPP consultation in 2018, and will continue to work closely with stakeholders to deliver high quality agreements for the UK.
Chapter 4: scoping assessment
Summary
The Department for International Trade (DIT) is preparing for negotiations with Japan. This scoping assessment provides a preliminary assessment of the potential long run impacts of a free trade agreement (FTA) between the UK and Japan prior to the launch of negotiations.
The importance of trade and investment links between the UK and Japan
Japan is the world’s third largest economy[footnote 20] and the UK’s fourth largest non-EU trading partner (and 11th globally).[footnote 21] Total trade between the two countries was worth around £29.5 billion in 2018, with over half of this being goods trade. The UK is the second largest recipient of Japanese direct investment.[footnote 22]
UK businesses and UK jobs
In 2018, 9,500 VAT-registered businesses exported goods to Japan, employing 2.4 million people. Around 6,700 VAT-registered businesses, supporting 2.5 million jobs, imported goods from Japan.
- 9,500 UK businesses export
- 2.4 million employees work in these businesses
Source: HMRC UK Trade in goods by business characteristics 2018
Goods trade
Cars and trucks are the UK’s largest export to Japan and the largest imported good from Japan.
- £0.9 billion car and truck exports
- £1.4 billion worth of car and truck imports
Source: HMRC using a 2016-18 average at the HS4 level
Services trade
The UK’s largest service export to Japan is financial services and this is also the largest services sector imported from Japan.
- £3.9 billion finance exports
- £1.9 billion finance imports
Source: ONS using a 2016-18 average. Where data is disclosed, averages only account for years in which data is available.
Source: HMRC and ONS data, 2016-18 annual averages.
Scope to further enhance trade and investment
The EU-Japan Economic Partnership Agreement (EPA) entered into force on 1 February 2019. In January 2019, the UK and Japan agreed to negotiate a new bilateral agreement. While there are strong trade and investment links between the UK and Japan already, evidence on trade and investment barriers between the two countries suggests that there is scope to further enhance this relationship. Several sources of evidence on trade barriers, including responses from the Japan FTA call for input, indicate there are barriers which could be liberalised through an FTA.
In February 2019 the EU-Japan Economic Partnership Agreement (EPA) entered into force. The UK was party to this agreement as a member of the EU, and it remains in place during the transition period. The new agreement will build on the EU-Japan EPA and secure additional benefits for UK business.
The potential impact of a UK-Japan free trade agreement
International evidence suggests that FTAs can reduce the costs of trade and investment, by eliminating tariffs and reducing non-tariff barriers, and regulatory restrictions to services trade. The analysis in this scoping assessment draws on robust evidence and the best tools available for this type of analysis. The results should be interpreted with caution, due to inherent uncertainty, and should not be considered as an economic forecast for the UK economy.
The scenario used for modelling is based upon the UK’s current tariff schedule (the EU’s ‘Common External Tariff’). The government is currently developing its new UK MFN tariff schedule.
Coronavirus has had a major impact on most major economies. Its’ economic impact is expected to be highly significant for the next few years. However, the analysis of the impact of a trade agreement with Japan relates to the long term. It is too soon to say what the lasting impacts of the pandemic will be on international trade and domestic sectors. Our analysis therefore implicitly assumes that in the long term, the UK, Japan and global economies will have recovered from the impacts of the coronavirus. At this point in time it is too early to identify whether or how the estimated impacts in this document might be affected by the current situation.
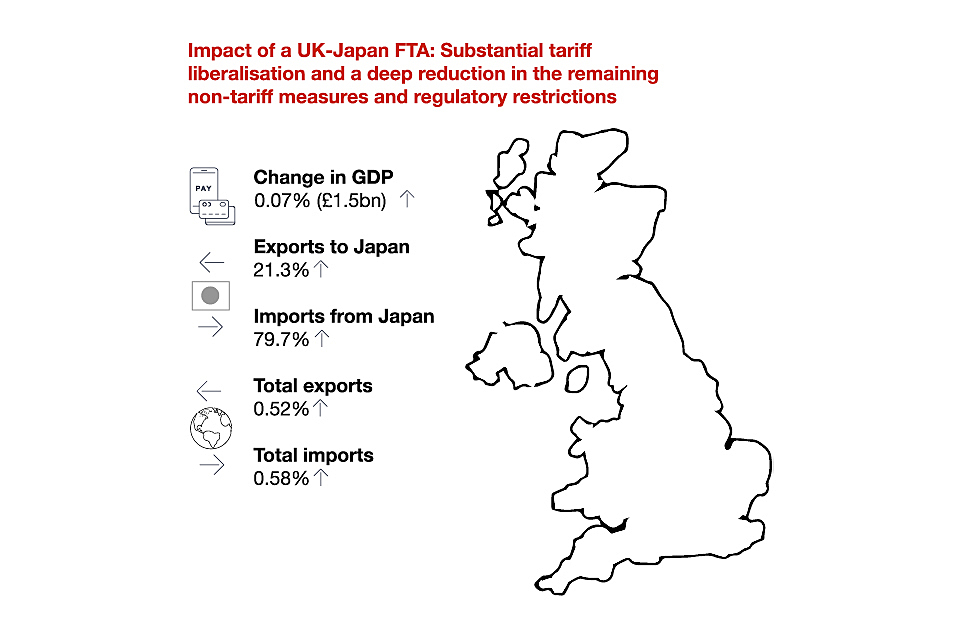
The image shows that there would be substantial tariff liberalisation and a reduction in remaining non-tariff measures and regulatory restrictions if a free trade agreement between the UK and Japan came into effect.
Source: external CGE modelling. £ values in 2018 terms
As the final details of a bilateral agreement between Japan and the UK have not yet been negotiated, the modelling is based on a plausible scenario that represents the depth of a potential agreement. This scenario assumes substantial tariff liberalisation and deep reductions in the level of actionable non-tariff measures (NTMs) affecting goods trade and regulatory restrictions affecting services trade between the UK and Japan, compared to not having a trade agreement with Japan. This scenario is used to generate the potential magnitude of impacts of trade liberalisation but should not be interpreted as the specified option for a future agreement.
A bilateral trade agreement with Japan could increase UK GDP in the long run by around 0.07% under the modelled scenario. This is equivalent to an increase of £1.5 billion in total GDP compared to its 2018 level. This increase reflects changes to the underlying economy brought about by a reduction in barriers with Japan through an FTA compared to the UK not having a trade deal with Japan. These reduced costs for firms and consumers result in changes to domestic specialisation and the composition of imports. Productivity gains are driven by resources moving to where they are more productive, including between sectors and industries, as well as between firms within sectors.
In the long run, almost all UK sectors are estimated to increase output, suggesting productivity gains from further specialisation are likely within sectors, through the reallocation of resources to more productive firms. Resource reallocation also occurs between sectors, with some sectors reducing employment as workers are drawn to other growing sectors. In the modelled scenario, workers are expected to experience increases in real wages.
UK goods and services are expected to become relatively more competitive in Japan, and exports to Japan are expected to increase by 21.3% in the modelled scenario. Firms would be able to expand trade as a result of the reduction in trade costs on both imported inputs and exported outputs to Japan, generating productivity gains. This could also lead to an increase in the global competitiveness of UK firms, and exports to other countries outside of the agreement are estimated to grow.
Imported goods and services from Japan facing lower trade costs could drive efficiency gains for UK businesses relying on or switching to inputs from Japan. UK consumers may also benefit if cheaper consumer goods become available. In the long run prices adjust to higher demand, but imports from Japan are estimated to increase by 79.7%.
Imports from Japan could increase significantly relative to UK exports to Japan as a result of the assumed tariff and NTM reductions, especially in areas where Japan is relatively competitive, including categories such as ‘chemical, rubber and plastic products’, ‘manufactures of materials’, ‘motor vehicles and parts’,’ other machinery and equipment’ and ’other transport equipment’.[footnote 23] Although imports from Japan increase significantly, in the context of overall UK imports from all countries (including Japan), expected growth in the UK’s total imports resulting from the FTA with Japan is 0.6%. For context, in 2018 UK imports from Japan were £15.2 billion (2.3% of UK total imports).
The modelling estimates an increase in the long run level of the average real wage in the UK of around 0.09% (£0.8 billion).
The UK economy is expected to grow as a result of a UK-Japan FTA. Based on the distribution of sectoral value added, a UK-Japan FTA has the potential to increase long run output across all nations and regions of the UK relative to the baseline. London, the East Midlands and Scotland expand the most relative to the baseline in the scenario set out here.
As outlined previously, the increased imports from Japan could be beneficial for both UK businesses and UK consumers as they could facilitate greater choice and lower prices for UK producers and consumers. Compared to not having a trade deal with Japan, both consumers and importing businesses may directly benefit from substantial tariff liberalisation, with total annual tariff reductions on UK imports from Japan estimated to be around £183 million to £275 million per year in the long run.[footnote 24] Non-tariff trade cost reductions can drive import prices even lower, creating further direct benefits captured in the macroeconomic analysis above.
The economic impacts of a UK-Japan FTA are expected to have some wider social and environmental implications. A preliminary assessment of the implications on groups within the labour market finds that the representation of protected groups (in relation to age, gender, ethnicity and disability) in sectors where employment falls relative to the baseline, is largely in line with the general population of the workforce.[footnote 25] Workers within any of these sectors may be presented with employment opportunities within expanding sectors. The extent to which the UK-Japan FTA impacts the environment is dependent on the negotiated outcome, which will determine changes in the pattern of trade and economic activity. Changes in the UK’s production and global trading patterns could favour UK sectors which are currently more or less emissions-intensive and could impact transport emissions. The government is committed to ensuring that a UK-Japan FTA will not threaten the UK’s ability to meet its existing environmental commitments, or its membership of international environmental agreements, and will pursue opportunities to further environmental and climate policy priorities.
Finally, GDP in Japan is expected to increase by 0.04% equivalent to an increase of £1.5 billion compared to its 2018 level, demonstrating a UK-Japan FTA can drive economic gains for both countries.
Next steps
Following the conclusion of negotiations and once the text of a UK-Japan agreement is known, a full impact assessment will be published prior to implementation. The final impact assessment will update and refine the preliminary estimates of the scale and distribution of impacts outlined in this scoping assessment.
The Department for International Trade would like to thank CEPR and Professor Joseph Francois for conducting economic modelling to support this assessment.
1. Background
A free trade agreement (FTA) is an international agreement which seeks to increase trade and investment between its signatories by removing or reducing tariffs, non-tariff measures and regulatory restrictions to services prohibiting trade and investment between partner countries.[footnote 26]
Trade and investment barriers make it more difficult and costlier to trade or invest overseas. By removing or reducing them, FTAs can make it easier for businesses to export, import and invest. FTAs can also benefit consumers by providing a more diverse and affordable range of imported products.
The government is committed to a transparent, inclusive and evidence-based approach to trade policy. A call for input on a renegotiated FTA between the UK and Japan was held between September and November 2019.
The aim of the scoping assessment is to provide parliament and the public with a preliminary assessment of the broad scale of the potential long run impacts of a renegotiated FTA between the UK and Japan prior to the launch of negotiations. Both countries have agreed to use the EU-Japan EPA as the basis for a future economic partnership, committing to make it ‘as ambitious, high standard and mutually beneficial’ as the EPA, enhanced in areas of mutual interest.[footnote 27]
While the UK-Japan agreement will be based on the EPA, some provisions will likely differ, and the exact content of a future FTA is therefore not yet known. Once the provisions of the agreement have been negotiated, the government will publish an impact assessment based upon the provisions of the agreement.
The UK has already signed an exchange of letters on mutual recognition of conformity assessment, which maintains the operational aspects of the EU-Japan mutual recognition agreement (MRA) on conformity assessment after the UK completes the transition period.[footnote 28]
This scoping assessment includes the rationale for an FTA with Japan, a description of the approach used for assessing its potential impacts, the results from modelling a possible scenario for a UK-Japan FTA, and sensitivity analysis.
The government is currently developing its new UK MFN tariff schedule. For the purposes of this analysis, the MFN rates assumed are those that are currently applied by the UK.
The economic impact of the coronavirus is expected to be significant for the next few years. It will affect both the supply and demand for goods and services and could drive significant changes to the pattern of trade between the UK and Japan. However, the analysis of the impact of a trade agreement with Japan relates to the long term. It is too soon to say what the lasting impacts of the pandemic will be on international trade and domestic sectors. Our analysis therefore implicitly assumes that in the long term, the UK, Japan and global economies will have recovered from the impacts of the coronavirus. At this point in time it is too early to identify whether or how the estimated impacts in this document might be affected by the current situation.
2. Rationale for a free trade agreement with Japan
This section provides an overview of the current UK-Japan trade and investment relationship and sets out the rationale for further trade liberalisation by highlighting tariff and non-tariff measures that exist in goods and regulatory restrictions to services trade.
Japan is the world’s third largest economy and the UK’s fourth largest non-EU trading partner (and 11th globally). Total trade between the two countries was worth approximately £29.5 billion in 2018, with over half of this being goods trade. The UK is an important investment partner for Japan. The UK is the second largest recipient of Japanese outward foreign direct investment.
The EU-Japan Economic Partnership Agreement (EPA) entered into force on 1 February 2019. The UK has the opportunity to sign a bilateral agreement with Japan that is further tailored to the UK economy. A UK-Japan FTA has the potential to generate further benefits for the UK. Strategically, it would build on existing cooperation in international fora, such as the G20 and World Trade Organisation, which include supporting trade liberalisation and the rules-based system.
While there are strong trade and investment links between the UK and Japan, evidence on trade and investment barriers between the two countries suggests that there is scope to enhance this relationship. Several sources of evidence on trade barriers, including responses from the Japan call for input, indicates that there could be benefits from an FTA which addressed such barriers.
2.1. Policy objectives
A renegotiated free trade agreement (FTA) with Japan represents an opportunity to strengthen the economic relationship between the UK and Japan.
Specific policy objectives for negotiations with Japan are set out in the outline approach for negotiations. The overarching objectives are to:
- Agree an ambitious and comprehensive free trade agreement with Japan that builds on the EU-Japan Economic Partnership Agreement (EPA), and secures additional benefits for UK businesses.
- Increase UK GDP by opening up opportunities for UK businesses, including small and medium-sized enterprises (SMEs) and investors, and facilitating greater choice and lower prices for UK producers and consumers.
- The Government has been clear that when we are negotiating trade agreements, the National Health Service (NHS) will not be on the table. The price the NHS pays for drugs will not be on the table. The services the NHS provides will not be on the table. The NHS is not, and never will be, for sale to the private sector, whether overseas or domestic.
- Throughout the agreement, ensure high standards and protections for British consumers and workers, and build on our existing international obligations. This will include not compromising on our high environmental protection, animal welfare and food standards.
- Secure an agreement which works for the whole of the UK and takes appropriate consideration of the UK’s constitutional arrangements and obligations.
2.2. Overview of Japan’s economy and trade policy
2.2.1. Economy
Japan is the third largest economy in the world with a high income per capita.
Japan is the third largest economy in the world[footnote 29] and the eleventh most populated country in the world, with an expected population of 121 million in 2030.[footnote 30]
Japan has the world’s 25th highest GDP per capita, at $38,430[footnote 31] (£29,819).[footnote 32] This compares to the UK’s GDP per capita of $39,954 (£31,001), which ranks 22nd highest in the world.[footnote 33] The average Japanese consumer spends $26,989 (£20,941) per year on goods and services in 2017.[footnote 34]
2.2.2. Business
Japanese businesses have the potential to provide a wider variety of goods and services for UK consumers.
According to the Statistics Bureau of Japan, in 2016 there were around 5.6 million firms in Japan, employing nearly 57 million people.[footnote 35]
Most of these firms are in ‘wholesale and retail trade’, ‘accommodations, eating and drinking services’ and ‘construction’.[footnote 36] The sector with the highest number of people employed (12 million) is ‘wholesale and retail trade’. This is followed by ‘manufacturing’ and ‘medical, health care and welfare’ which employed an estimated 9 million and 7 million respectively.[footnote 37]
The manufacturing sector contributed 20.7% to the Japan economy in 2017. The major industries in this sector include machinery, chemical, iron and steel, and fabricated metal products industries.[footnote 38]
Japan has a favourable environment for businesses, ranking 39th out of 190 countries in the World Bank Ease of Doing Business rankings.[footnote 39]
2.3. Overview of existing trade and investment relationship
Japan and the UK already work closely together to pursue common interests in international fora.
The UK and Japan have a global strategic partnership, underpinned by mutual interests, common values and a commitment to upholding the rules-based international system. The UK and Japan are close security and trading allies, and have worked together in international fora such as the UN, G7, G20 and the World Trade Organisation. Despite both the UK and Japan being advanced economies, there are differences in economic structure. Table 1 below shows the areas of revealed comparative advantage (RCA), or relative export specialisation, for the UK and Japan. Each country is relatively specialised in exports within sectors where the RCA index is greater than zero (shaded green). This can be considered as a proxy for the specialisations of the UK and Japan economies. The differences in specialisations point to a degree economic complementarity between two economies overall.
Table 1 – Relative export specialisations by sector[footnote 40]
| Type | Sector | UK RCA | Japan RCA |
|---|---|---|---|
| Agri-foods | Agriculture | -0.67 | -1.01 |
| Agri-foods | Beverages and tobacco products | 0.28 | -0.24 |
| Agri-foods | Semi-processed foods | -0.41 | -0.82 |
| Agri-foods | Processed foods | -0.23 | -0.68 |
| Industry | Chemical, rubber, plastic products | 0.31 | 1.12 |
| Industry | Electronic equipment | -1.52 | -2.98 |
| Industry | Energy | -3.07 | -5.76 |
| Industry | Manufactures of materials | -1.29 | 0.85 |
| Industry | Motor vehicles and parts | 0.03 | 5.30 |
| Industry | Other machinery and equipment | -0.93 | 8.16 |
| Industry | Other Manufacturing | -0.03 | -0.21 |
| Industry | Other transport equipment | 0.39 | 0.20 |
| Industry | Paper and printing products | -0.01 | -0.31 |
| Industry | Textiles, apparel, and leather | -0.94 | -1.28 |
| Services | Business services | 3.74 | -1.03 |
| Services | Communications | 0.33 | -0.20 |
| Services | Construction | -0.06 | 0.37 |
| Services | Financial services | 2.49 | -0.30 |
| Services | Insurance | 0.55 | -0.15 |
| Services | Other services (transport, water, dwellings) | 0.46 | -0.75 |
| Services | Personal services | 0.29 | -0.26 |
| Services | Public services | 0.18 | -0.30 |
| Services | Wholesale and retail trade | 0.10 | 0.28 |
Source: GTAP9 and DIT Calculations (2020).
Japan is an important trade and investment partner for the UK.
Japan is currently the UK’s fourth largest non-EU export market (and 11th globally), accounting for just over 2% of the UK’s total exports in 2018.[footnote 41]
Total UK trade (exports plus imports) with Japan was £29.5 billion in 2018.[footnote 42] The UK is one of Japan’s biggest trade and investment partners, representing Japan’s 13th largest export market, accounting for approximately 2% of Japan’s total exports in 2018.[footnote 43]
In 2018 the UK was the second largest recipient of Japanese outward investment (accounting for 10% of Japan’s outward FDI stock). In addition, the UK was the fifth largest investor in Japan (accounting for 8% of its inward FDI stock).[footnote 44] Meanwhile, Japan is the sixth largest investor in the UK.[footnote 45]
Of all UK exports to Japan in 2018, 49% were goods. Bilateral trade data in Chart 1 illustrates the goods sectors in which the UK exports the most to Japan and in which Japan exports the most to the UK on average between 2016 and 2018. The three goods sectors in which the UK exported the most to Japan in this three-year period were turbojets, machinery and engines; vehicles; and pharmaceutical products. The three goods sectors in which the UK imported the most from Japan are nuclear reactors, boilers; vehicles; and pearls and precious metals, base metals.
Chart 1: sector shares of UK goods exports and imports to/from Japan as a proportion of total goods exports and imports to/from Japan (annual average shares 2016-18)
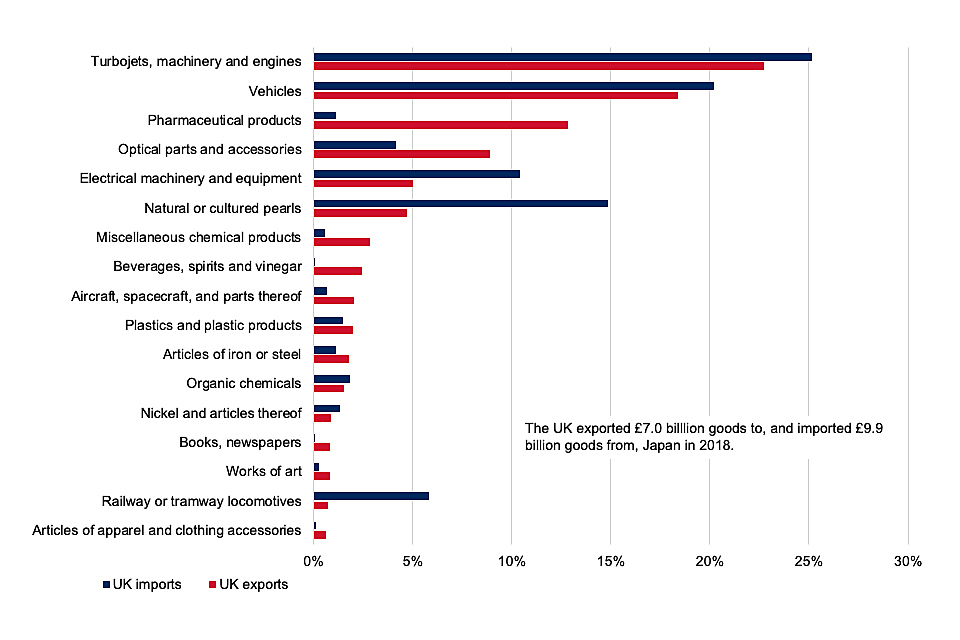
Chart 1 shows that the UK exported £7.0 billion goods to, and imported £9.9 billion goods from, Japan in 2018.
Note: the UK exported £7.0 billion goods to, and imported £9.9 billion goods from, Japan in 2018
Source: HMRC trade statistics by commodity code. Sectors classified according to Harmonised System Sections. Data uses an average from 2016 to 2018.
In 2018, just over half of UK exports to Japan were in services.[footnote 46] Chart 2 below shows that the most important services for bilateral trade between Japan and the UK are financial services and ‘other business services’. ‘Other business services’ captures professional services, including auditing, accounting and legal services. The pattern of the UK’s services exports to Japan is broadly mirrored by the pattern of Japan’s services exports to the UK, apart from ‘intellectual property’, which accounts for around a third of Japanese exports, and a much lower share of UK exports. ‘Intellectual property’ covers the authorised use of intangible, non-produced, non-financial assets and propriety rights (such as trademarks, franchises, literary works etc.).
Chart 2: sector shares of UK services exports and imports to/from Japan as a proportion of total services exports and imports to/from Japan (annual average shares 2016-18)
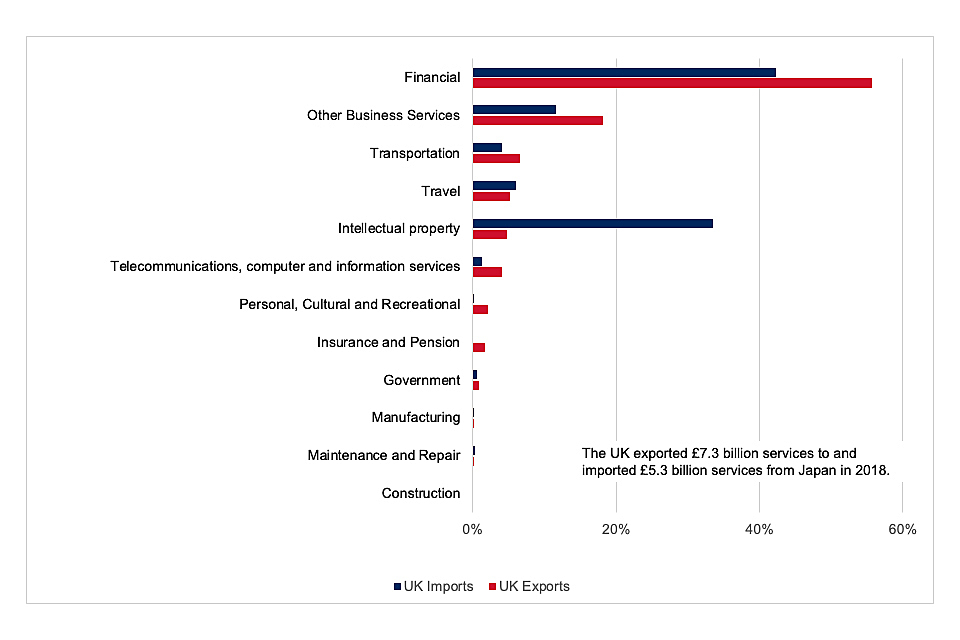
Chart 2 shows that the UK exported £7.3 billion services to and imported £5.3 billion services from Japan in 2018.
Note: the UK exported £7.3 billion services to and imported £5.3 billion services from Japan in 2018.
Source: ONS (2019), UK trade in services: service type by partner country, non-seasonally adjusted.
Supply chains are an important feature of UK-Japan trade and could provide extra gains from liberalisation.
Supply chains – where imported goods and services are used in the production of goods and services which are either consumed domestically or re-exported – are an increasingly important feature of international trade. Reductions in UK-Japan trade barriers (tariff, non-tariff measures and regulatory restrictions to services) can facilitate and reduce the cost of trade in these intermediate goods, with the gains passed on to other businesses and final consumers.
According to UN Comtrade data, 59% of all Japanese goods imported into the UK and 44% of all UK goods exported to Japan were in intermediate goods (Table 2).
Table 2: Value of UK-Japan trade in goods according to end-use, 2016-2018 average[footnote 47]
| Intermediate goods | Capital goods | Consumer goods | |
|---|---|---|---|
| UK imports from Japan | £5.2 billion (59%) | £1.5 billion (17%) | £2.0 billion (23%) |
| UK exports to Japan | £2.2 billion (44%) | £0.7 billion (14%) | £2.1 billion (41%) |
Source: DIT analysis, UN Comtrade data.
Supply chains can be measured using “trade in value-added” data which measures the proportion of UK exports containing goods or services that were initially imported from Japan, and vice versa. The UK sectors with the highest amount of Japanese value-added in exports are motor vehicles, “other transport equipment”, electrical equipment, and computer, electronic and optical products (less than 1% of the value of these UK exports originates from Japan).[footnote 48]
Japanese sectors with the highest amount of UK value-added in exports are “other transport equipment”, chemicals and pharmaceutical products, rubber and plastic products, and financial and insurance activities (less than 1% of the value of these Japanese exports originates from the UK).
Japan is an important export destination for all regions of the UK.
In 2018, the regions with the highest proportion of their goods exports destined for Japan were the South East, the South West and the East of England, with around 3% of each region’s exports to the world going to Japan. Chart 3 displays the percentage of each region’s goods exports that were destined for Japan.[footnote 49]
Chart 3: UK regional goods exports to Japan as a share of regional goods exports to the world, 2018
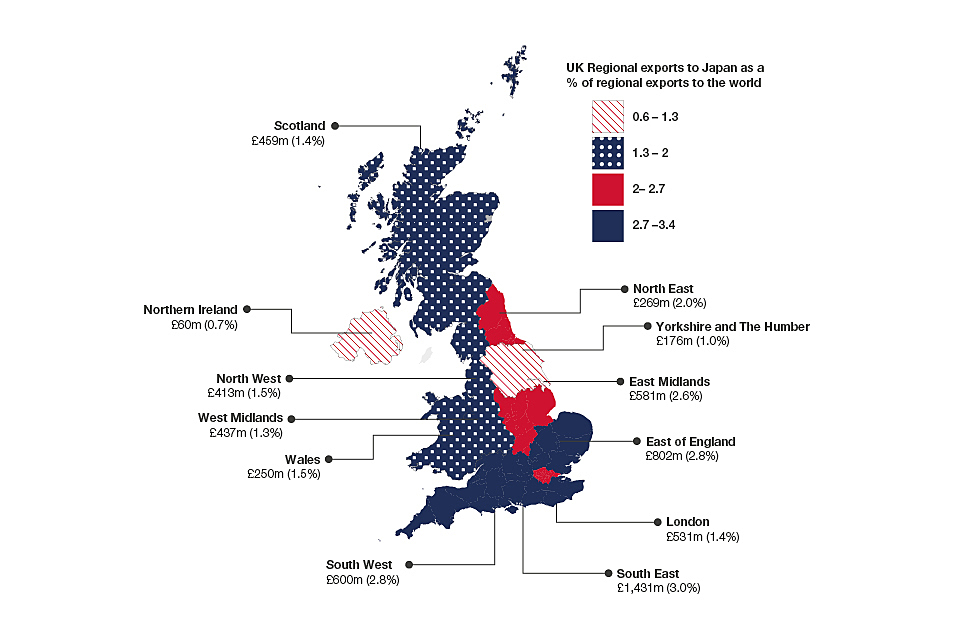
Chart 3 shows UK nations and regions’ goods exports to Japan as a share of each region’s total exports in 2018.
Source: HMRC Regional Trade Statistics. DIT analysis (2020).
Table 3 below highlights the importance of Japan for each UK nation by top goods sectors. This highlights the diversity between exports in different UK nations to Japan.
Table 3: top three UK goods exports to Japan by nation (annual average 2016-18)
| Nation | Goods exported | Values, £ million |
|---|---|---|
| England | Road vehicles (including air cushion vehicles) | £994.4 |
| England | Power generating machinery and equipment | £747.9 |
| England | Medicinal and pharmaceutical products | £642.0 |
| Northern Ireland | Medicinal and pharmaceutical products | £20.3 |
| Northern Ireland | Professional, scientific and controlling instruments and appliances | £12.7 |
| Northern Ireland | Machinery specialized for particular industries | £6.1 |
| Scotland | Power generating machinery and equipment | £97.5 |
| Scotland | Beverages | £93.0 |
| Scotland | Chemical materials and products | £27.8 |
| Wales | Power generating machinery and equipment | £81.2 |
| Wales | Non-ferrous metals | £21.9 |
| Wales | Professional, scientific and controlling instruments and appliances | £17.0 |
Source: HMRC Regional Trade Statistics
Trade with Japan is also important for a wide range of UK businesses, including small and medium sized enterprises (SMEs).
SMEs (firms employing less than 250 employees) are important to the UK economy. In 2018 these made up over 99% of the total number of private sector businesses, representing 60% of employment and 52% of private sector turnover.[footnote 50] UK SMEs play an integral role in engaging with the international economy. SMEs are increasingly international traders in their own right. For example, in 2018, 97% of businesses exporting goods were SMEs, representing 28% of the UK’s total exports.[footnote 51] SMEs also form a key part of the supply chain for larger UK and global firms, by producing intermediate goods used to manufacture other goods.
A wide range of UK firms already export to and import from Japan, across many industries. Table 4 below sets out the UK industries which trade goods with Japan, identifying the industries which are particularly reliant on goods trade with Japan. Over a quarter of importing and exporting aerospace firms traded with Japan. 21% of pharmaceuticals firms that exported in 2018 sent goods to Japan. A large proportion of UK businesses exporting to and importing from Japan are in the services sector.
Table 4: number of UK VAT registered businesses trading with Japan, 2018
| UK Sector | Number of businesses importing from Japan | % of importing businesses which import from Japan | Number of businesses exporting to Japan | % of exporting businesses which export to Japan |
|---|---|---|---|---|
| Agriculture and food | 241 | 2% | 693 | 9% |
| Mining, petroleum products and waste | 64 | 3% | 107 | 6% |
| Chemicals | 130 | 8% | 273 | 18% |
| Pharmaceuticals | 43 | 16% | 49 | 21% |
| Electronic and electrical equipment | 567 | 13% | 795 | 20% |
| Other machinery and equipment | 222 | 7% | 466 | 14% |
| Motor vehicles, transport equipment | 120 | 8% | 200 | 15% |
| Aerospace and related machinery | 52 | 28% | 57 | 31% |
| Other manufacturing | 475 | 3% | 992 | 8% |
| Services | 4426 | 2% | 5,539 | 5% |
| Unknown | 355 | 2% | 326 | 4% |
| Total | 6,695 | 3% | 9,497 | 6% |
Source: HMRC, UK Trade in Goods by Business Characteristic 2018
2.4. Further scope to maximise trade and investment potential (UK-Japan barriers)
While there are strong trade and investment links between the UK and Japan, evidence on trade and investment barriers between the two countries suggests that there is scope to further enhance this relationship.
DIT has consulted widely on stakeholders’ priorities for a renegotiated FTA with Japan. The evidence gathered from these exercises includes:
- responses from DIT’s public call for input
- DIT’s Public Attitudes to Trade Tracker
- targeted stakeholder engagement across UK nations and regions
2.4.1. Responses from DIT’s public call for input
In September 2019, the UK government launched an online call for input for members of the public, businesses, trade experts and any other interested organisations to submit their views on a renegotiated free trade agreement (FTA) with Japan.[footnote 52] Chapter 3 outlines the response to that call for input.[footnote 53]
2.4.2. Public attitudes to trade tracker
In September 2018, DIT commissioned a nationally representative survey of the UK public to examine public attitudes towards trade and to understand the public’s priorities as they relate to trade policy, and how these may change over time.[footnote 54] This found that 66% of the UK public support the UK establishing an FTA with Japan (the remaining 31% said they “don’t know” or “neither oppose or support”, and 3% said they “opposed” or “strongly opposed” FTAs).
2.4.3. Evidence on barriers in UK-Japan trade in goods
The average tariff on UK-Japan goods trade is relatively low but varies by type of good. WTO data suggests that sanitary and phytosanitary measures (SPS) and technical barriers to trade (TBT) are the most prevalent non-tariff measures on goods trade.
2.4.3.1. Tariffs
The government is currently developing its new UK MFN tariff schedule. The simple average applied tariff on Japanese goods imported into the UK (EU) is 7%, based on MFN currently applied by the UK. For UK goods exported to Japan, the simple average applied tariff is 8%. However, on a trade-weighted basis (which accounts for the specific value of bilateral UK-Japan trade in different sectors), the average tariff is 3% for Japanese goods imported into the UK and 1% for UK goods exported to Japan.[footnote 55]
Chart 4 illustrates the tariff barriers UK firms would currently face under an MFN scenario compared to the average tariff barriers faced by the trade partners with which Japan already has a trade agreement in force.[footnote 56] The UK faces higher tariffs in the Japanese market trading under MFN terms compared to several other countries. A UK-Japan FTA would seek to increase the competitiveness of UK businesses by reducing barriers in key sectors.
Chart 4: Japanese simple average MFN tariffs on UK exports, compared to simple average tariffs faced by Japan’s FTA partners, 2017
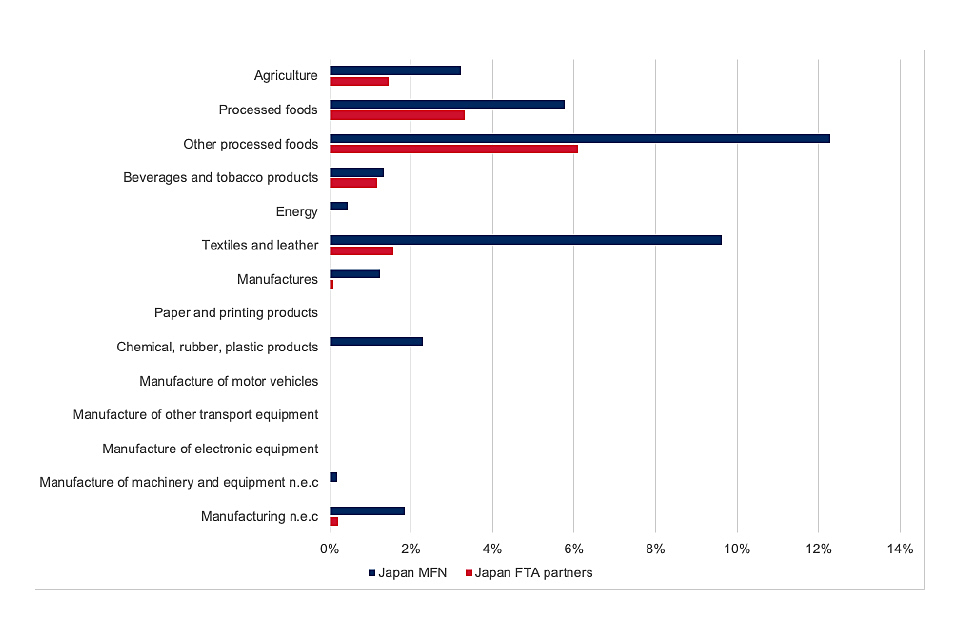
Chart 4 shows Japan’s simple average MFN tariffs on UK exports, compared to simple average tariffs faced by Japan’s FTA partners in 2017.
Source: World Integrated Trade Solution system (WITS), 2017 data. DIT analysis (2020).
2.4.3.2. Non-tariff measures on goods
Non-tariff measures (NTMs) are defined as all barriers to goods trade that are not tariffs. This includes customs controls and differences in national regulatory regime. Evidence from the WTO’s Integrated Trade Intelligence Portal (I-TIP) suggests that most NTMs faced in Japan fall under the categories of technical barriers to trade (TBT) and sanitary and phytosanitary measures (SPS).[footnote 57] TBT barriers refer to mandatory technical regulations and voluntary standards that define specific characteristics that a product should have, such as its size or shape. SPS is a category which covers any standards a country applies to ensure food safety, animal health or plant health standards (see Chart 5).
Chart 5: non-tariff measures (NTMs) in the UK and Japan, by frequency[footnote 58]
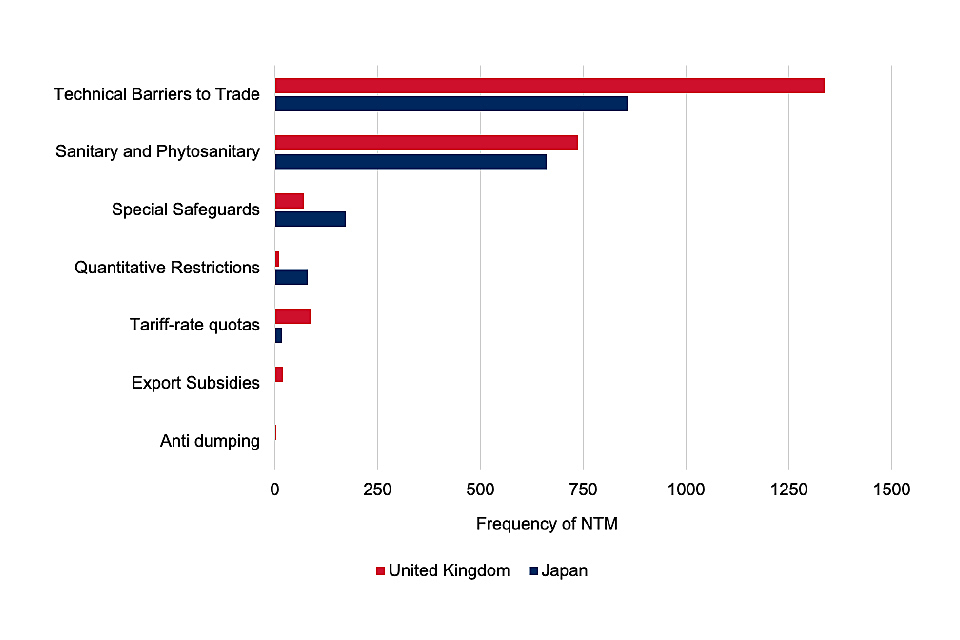
Chart 5 shows non-tariff measures in the UK and Japan, by frequency. The most frequent NTMs for both the UK and Japan are technical barriers to trade.
Source: WTO, Integrated Trade Intelligence Portal (I-TIP). NTMs either initiated or in force.
2.4.4. Evidence on barriers in UK-Japan trade in services
Trade in services is important for both countries. Data from the OECD highlights the restrictions that are in place that affect foreign providers of services, including digital services trade.
In 2018 just over half of UK exports to Japan were in services. The UK’s total services trade with Japan – imports plus exports – was worth £12.6 billion in 2018. Of this, £7.3 billion were services exported to Japan and £5.3 billion were services imported from Japan.[footnote 59]
The OECD’s Services Trade Restrictiveness Index (STRI) provides a measurement of regulatory restrictions to trade in services across 22 sectors, with 0 representing a sector which is completely open to foreign service suppliers and 1 representing a sector which is completely closed. The services sectors with the highest levels of restrictiveness in Japan are legal, air transport, courier, and broadcasting services. By type of restriction, the restrictions in Japan are highest in foreign entry (e.g. equity restrictions on business ownership) and transparency of regulation (e.g. visa processing time).
Chart 6: UK and Japan Services Trade Restrictiveness Index (STRI)
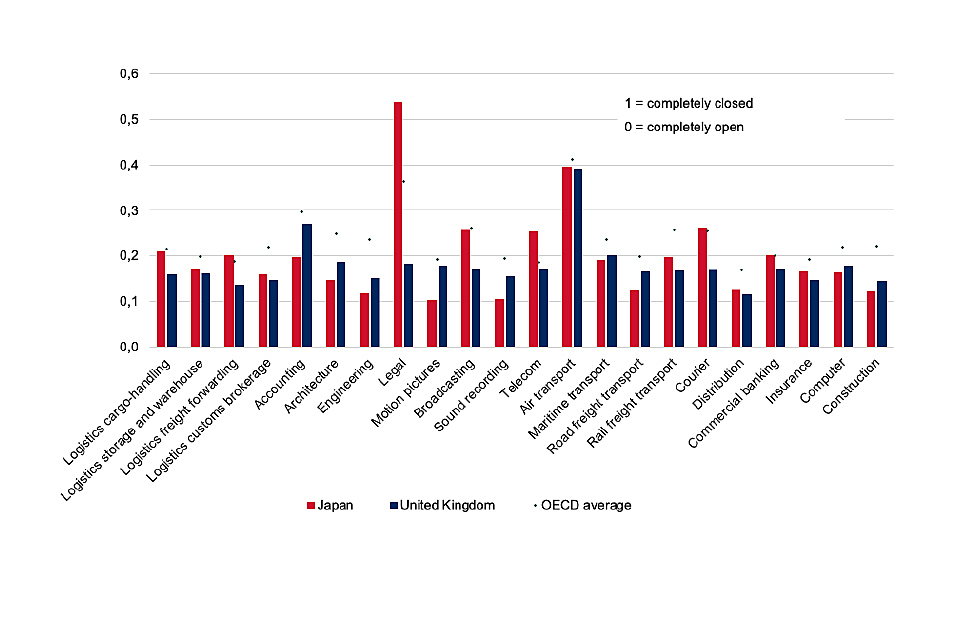
Chart 6 shows the services trade restrictiveness index for Japan, UK and OECD average in 2018.
Source: OECD Services Trade Restrictiveness Index (STRI), 2018.
2.4.4.1. Evidence on barriers in UK-Japanese trade in digitally enabled services
The OECD’s Digital Services Trade Restrictiveness Index (Digital STRI) builds on the STRI by identifying cross-cutting barriers that affect all types of services traded digitally across five broad categories. The index shows that Japan is relatively more open to foreign trade in digitally traded services than other OECD countries on average (see Chart 7). The majority of Japan’s digital trade restrictiveness falls under the categories of ‘infrastructure and connectivity’ (that is, restrictions related to communication infrastructures essential to engaging in digital trade, e.g. cross-border data flows) and electronic transactions (that is, the sale or purchase of goods or services, whether between businesses, households, individuals, governments, and other public or private organisations, conducted over computer-mediated networks. The goods and services are ordered over those networks, but the payment and the ultimate delivery of the good or service may be conducted on or off-line).
Chart 7: UK and Japan Digital STRI, by type of restriction
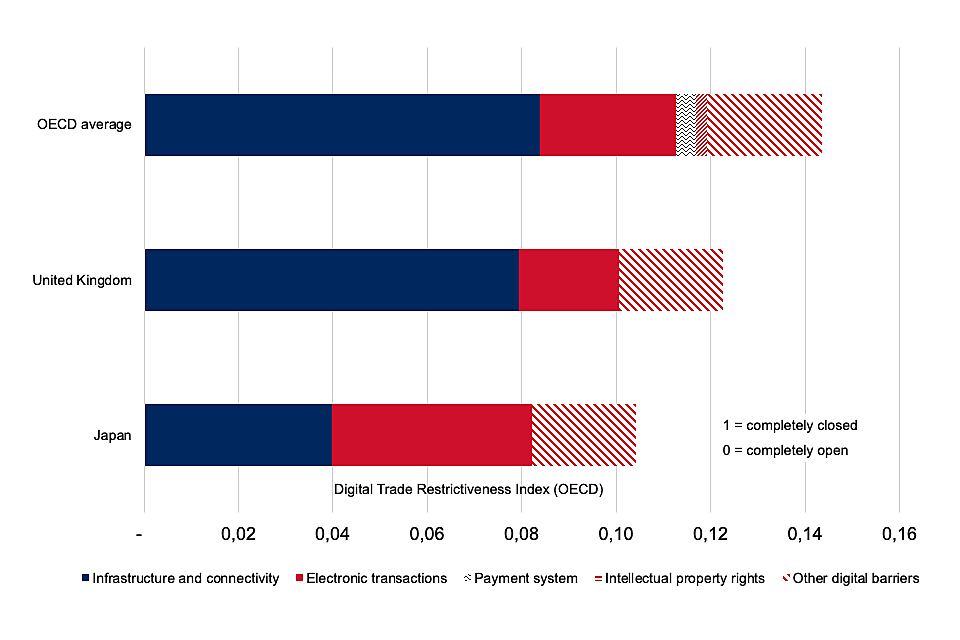
Chart 7 shows UK and Japanese Digital STRI, by type of restriction. The UK and Japan have similar levels of restrictiveness across the five sections shown.
Source: OECD Digital Services Trade Restrictiveness Index (Digital STRI), 2018.
2.4.5. Evidence on barriers in UK-Japan investment
The OECD’s FDI Regulatory Restrictiveness Index assesses the restrictiveness of a country’s FDI rules across the four main types of restrictions. The index shows that Japan is relatively more restrictive to FDI compared to the UK. Both parties score a lower regulatory restrictiveness score compared to OECD countries on average. The majority of Japan’s FDI barriers fall under the category of ‘equity restrictions’ – that is, restrictions on the proportion of a business that can be owned by individuals who are not Japanese citizens.
Chart 8: UK and Japanese investment restrictiveness, by type of restriction
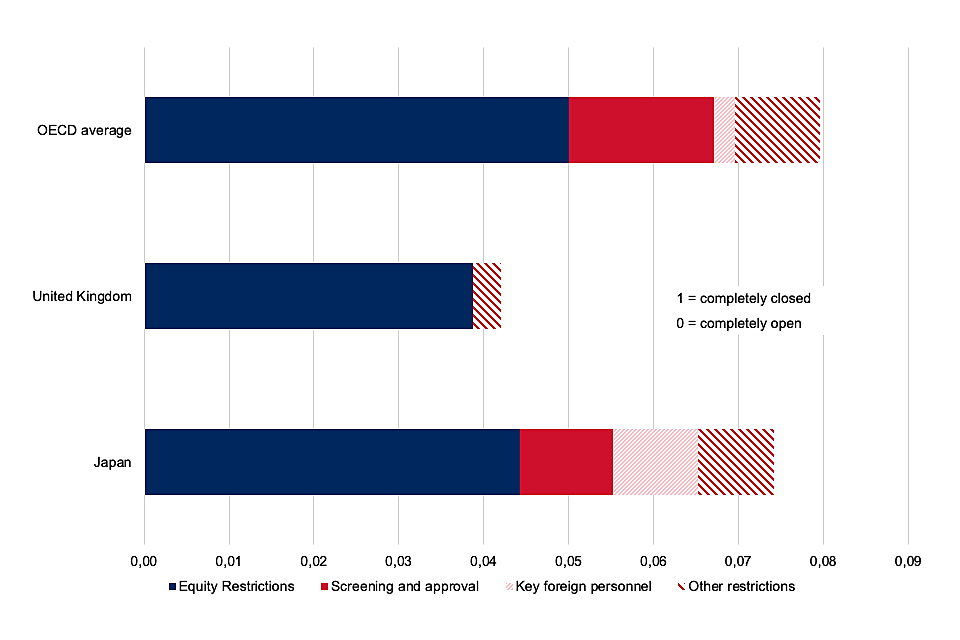
Chart 8 shows UK, Japanese and OECD average investment restrictiveness. Japan is more restrictive than the UK across all 4 types of restriction shown.
Source: OECD FDI Regulatory Restrictiveness Index, 2018.
Overall, the evidence on existing UK-Japan trade barriers suggests that that there is scope to further enhance the trading relationship, to maximise the trade and investment potential of the two countries.
2.5. Previous Japan trade agreements
Since the early 2000s Japan’s policy of trade liberalisation has predominantly focused on bilateral agreements. Japan is currently party to 18 trade agreements covering 47 countries.[footnote 60] These trade agreements have substantially reduced the tariffs faced by countries which have already secured trade deals with Japan.
Japan is a founding member of the Comprehensive and Progressive Agreement for Trans-Pacific Partnership (CPTPP), a broad and deep plurilateral trade agreement between 11 countries. As of October 2019, these 11 countries represented 13% of global GDP, increasing to more than 16% if the UK were to join.[footnote 61]
Since the late 1960s Japan has pursued a policy of unilateral, bilateral and multilateral trade liberalisation. Weighted average applied tariffs have fallen from 4.0% in 1991 to 2.5% in 2017.[footnote 62]
Chart 9: Japanese applied tariff rate, all products, weighted average (%) 1991 to 2017
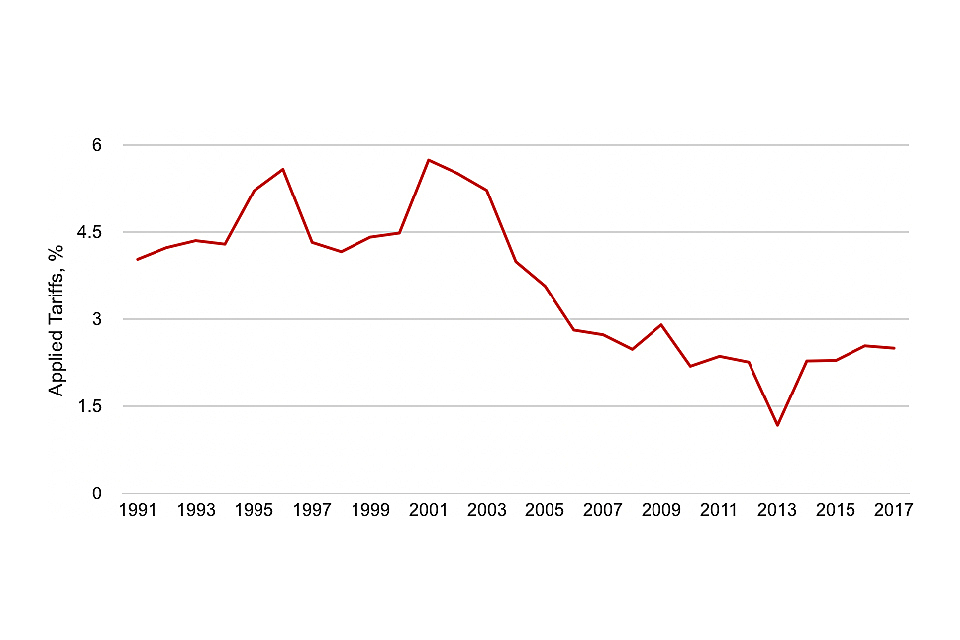
Chart 9 shows the Japanese weighted average applied tariff rate for all products from 1991 to 2017.
Source: World Bank staff estimates using the World Integrated Trade Solution database (WITS).
Japan has relatively low tariffs across all goods products. However, recent FTAs signed with CPTPP members and the European Union have reduced Japan’s tariffs further. On services, Japan has consistently committed to barriers below most favoured nation (MFN) bound rates as part of its previous free trade agreements.
Japan has included investment as part of FTAs signed with Australia and Switzerland. This means that UK firms looking to invest in the Japanese market may be required to meet more stringent conditions than investors from countries which have FTAs with Japan.
3. Approach to assessing the potential impact of a free trade agreement with Japan
The approach used to assess the impacts of a UK-Japan free trade agreement is discussed below.
Tariff data and estimates of non-tariff measures and regulatory restrictions to services from econometric modelling are used as inputs into the Computable General Equilibrium (CGE) model. This is a stylised model of the world economy capturing links between countries and sectors within those countries. The text of a bilateral agreement between Japan and the UK has not yet been negotiated, so a scenario has been created to illustrate the possible impacts of an agreement. This scenario assumes substantial tariff liberalisation and deep reductions in the level of actionable non-tariff measures (NTMs) affecting goods and regulatory restrictions to services affecting services trade between the UK and Japan, compared to not having a trade agreement. This scenario is used to model a range of long-term impacts on the economy. The economic modelling described above has been conducted on behalf of the Department for International Trade by CEPR (Professor Joseph Francois).
Other analytical approaches are used to assess the impacts on UK nations and regions, protected groups and the environment.
3.1. Tools of analysis
The tools used to estimate the impacts in this scoping assessment include externally commissioned econometric modelling, Computable General Equilibrium (CGE) modelling and techniques to explore potential impacts on UK nations and regions, businesses, protected groups and the environment.
International evidence suggests that FTAs reduce the costs of trade and investment, through eliminating tariffs, reducing non-tariff measures (NTMs) or reducing regulatory restrictions to services. In doing so, FTAs can have a wide range of macroeconomic, social and environmental impacts while also having important distributional consequences across economic sectors, groups, and individuals. This report employs a suite of economic tools to assess these impacts:
-
Econometric modelling, NTM and tariff analysis: as NTMs and regulatory restrictions to services are not directly observable, gravity modelling techniques are used to estimate the existing level of NTMs and regulatory restrictions to services for a given country. For tariffs, the GTAP10 database was investigated to understand the current mix of tariffs across sectors.[footnote 63] These estimates are transformed into scenario inputs, which feed into the Computable General Equilibrium (CGE) model. This modelling has been conducted on behalf of the Department for International Trade by the CEPR (Professor Joseph Francois).[footnote 64] Annex B provides further details on the derivation of modelling inputs.
-
Computable General Equilibrium modelling: the primary tool of macroeconomic analysis used in this report is a Computable General Equilibrium (CGE) trade model. The model is a stylised representation of the global economy and trade linkages that capture long-term economic responses to changes in trade policy. It can be used to assess macroeconomic variables, such as output, wages, and trade both at the sectoral and economy-wide level. This modelling has been conducted on behalf of the Department for International Trade by CEPR (Professor Joseph Francois).[footnote 65] As a result, the CGE model used for this assessment is different from that used in HMG’s recent analysis of the Economic Impact of leaving the European Union[footnote 66], act and different from that used in other Scoping Assessments, such as that for an agreement with the United States. Annex A provides further detail on the model structure and methodology.
-
Impacts on regions and main groups: a range of tools are used to further assess the CGE outputs and to explore the potential impacts on UK nations and regions, businesses, protected groups, and the environment. The approaches are developed and implemented by the Department for International Trade. Annexes B, C, D, E, and F describes the methodologies used for these in further detail.
The results of the overall approach can be interpreted as an estimation of the long-term economic impact of the FTA relative to a baseline, with the long term generally assumed to mean 15 years from the implementation of the agreement.
Chart 10: Summary of modelling approach of a UK-Japan FTA
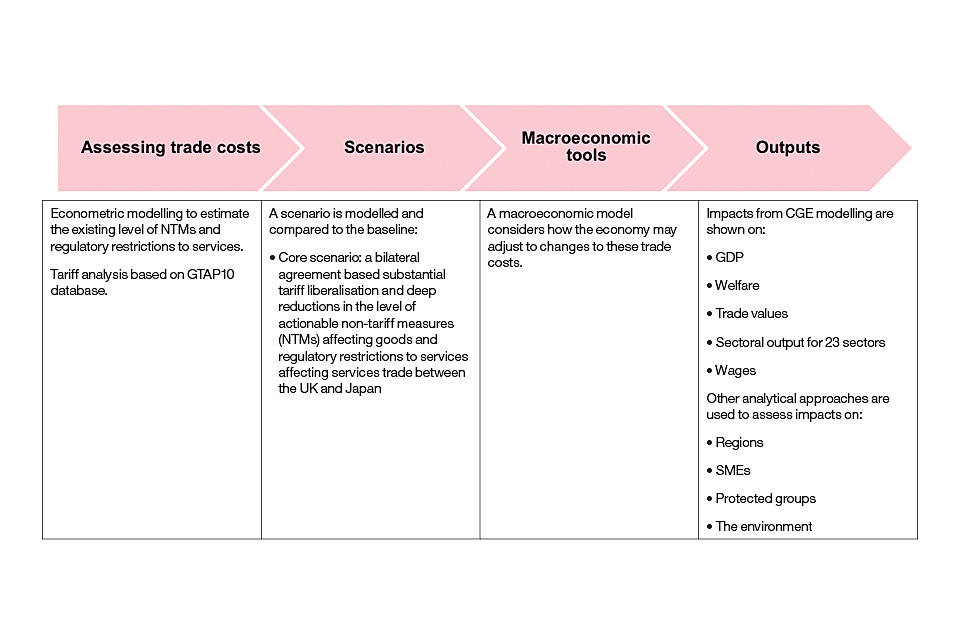
This image outlines how we used econometric, macroeconomic and scenario modelling to assess the economic impacts of a UK-Japan FTA.
CGE models and the economic impacts of trade policy
CGE modelling is a standard method for assessing the impact of free trade agreements used by trade economists and international organisations. The modelling allows for an assessment of the economic impacts across different sectors, nations and regions of the UK, and agents. This approach provides the long-term impacts resulting from trade liberalisation, capturing the supply chains between sectors as well as the wider economic interactions between households, firms, and government.
The impacts of trade policy are captured through trade cost reductions in the form of changes to tariffs, non-tariff measures and regulatory restrictions to services (see Box 2 for more information). The model calibrates to an initial equilibrium based on the underlying data, simulates the assumed changes to trade costs, and subsequently adjusts to a new equilibrium accounting for the wider economic impacts from these changes. The adjustment path to the new equilibrium is not modelled but it is typically assumed that the economy adjusts over a 15-year period. A comparison of the initial with the new equilibrium provides the long run economic impact of the trade policy change.
The modelling has “closure rules” that allows the economy to be in equilibrium. In this modelling the labour market is assumed to clear and capital stocks adjust to reflect changes in investment levels. Further information on these assumptions can be found in Annex B.
Application to sectors
The sectoral results presented in the next chapter are estimates derived from CGE modelling, which is typically conducted at a high level of sectoral aggregation. This implies that the results cannot provide a full account for impacts on granular sub-sectors and so while a CGE sector may be showing a particular outcome, it is uncertain as to whether all of its component sectors would experience the same direction of impact.
An alternative modelling approach is Partial Equilibrium (PE) modelling. This allows for more granular levels of analyses targeted at sub-sectors and more complex tariff or NTM structures – this is often used for investigating the impacts on specific agricultural commodities and other specific industrial goods. However, it does not consider the wider economic impacts and the potential knock-on effects that may occur as a result of changes to trade policy.
Consequently, when comparing the two approaches, PE modelling results are often referred to as the “first round” impacts while CGE impacts are associated with the longer-term economic impacts capturing the wider feedback effects across the economy (e.g. reallocation of resources across sectors).
3.2. Inputs and assumptions
The CGE model in this scoping assessment combines an assumption for the UK’s future trading relationship with the EU (baseline) with a scenario representing the ‘depth’ of a renegotiated UK-Japan FTA, as measured by reductions in tariffs, non-tariff measures on goods trade and regulatory restrictions in services trade.
3.2.1. Baseline
The baseline represents the state of the economy in the absence of a UK-Japan free trade agreement. Several assumptions are included in the baseline to ensure that it is a reasonably accurate representation of the world economy should the UK sign an FTA with Japan. As the GTAP10 database is based on 2014 data, the modelling simulates a number of trade shocks to account for recent trade agreements that could materially change the pattern of UK trade, but may not have been fully accounted for in the underlying data.
The baseline incorporates:
- The entry into force of the CPTPP, without UK membership, which occurred on December 30th 2018
- The entry into force of recent EU Agreements, that are assumed to be implemented prior to a UK-Japan FTA entering into force. These are: CETA,[footnote 67] the EU-Andean Agreement,[footnote 68] the EU-Singapore FTA, the EU-Vietnam FTA and the EU-Japan EPA.
A change in the trade relationship between the UK and the European Union, resulting from the UK’s departure from the EU. For this assessment, stylised assumptions are made to represent a trading relationship between the UK and EU based on a hypothetical free trade agreement, with zero tariffs and an increase in non-tariff measure costs based on historical FTAs.[footnote 69]
The baseline of this assessment does not include new FTAs that have been recently signed by Japan such as the US-Japan FTA which could affect the results presented in this assessment.
These assumptions about the long run relationship are required to establish a baseline for modelling new trade agreements, but do not represent government policy. The modelling does not explicitly take account of any impacts arising from the Protocol on Ireland/Northern Ireland (to the Withdrawal Agreement).
We have also estimated the impacts against an alternative baseline where the UK trades with the EU under WTO MFN rules.[footnote 70] This is to illustrate the potential effects of a UK-Japan FTA in this context, but again does not reflect government policy. This is assessed in the “Sensitivity analysis and limitations” section of this document.
3.2.2. Scenario
As full details of the potential FTA between the UK and Japan are not yet known, a core scenario has been defined to estimate plausible impacts. This scenario assumes substantial tariff liberalisation and deep reductions in the level of actionable non-tariff measures (NTMs) affecting goods and regulatory restrictions to services affecting services trade between the UK and Japan, compared to not having a trade agreement.
This scenario is used to generate the potential magnitudes of impacts but should not be interpreted as the specified option for a future agreement. In line with the literature, the provisions within the free trade agreement are modelled as reducing the costs associated with trading between the UK and Japan.
The scenario does not reflect or assume the presence or otherwise of any specific provisions contained in an eventual UK-Japan agreement. The scenario is intended to reflect plausible outcomes relating to the potential depth of an eventual agreement.
In light of the uncertainties surrounding the scenario, the results should be interpreted as providing an indicative order of magnitude for the expected impacts of a UK-Japan FTA.[footnote 71]
The impacts of alternative baseline assumptions are outlined in the sensitivity section.
For further details on non-tariff measures, regulatory restrictions to services and actionability, and their derivation see Box 2 and Annex B .
Tariffs, NTMs, regulatory restrictions to services and actionability
Tariffs
The external analysis makes assumptions about tariff levels in the baseline of the modelling and when simulating implementation of the UK-Japan agreement.
Under the scenario, tariffs faced on Japanese exports to the UK, and on UK exports to Japan are reduced. The tariff reductions used in the modelling are based on the tariff schedules agreed between the EU and Japan in the economic partnership agreement, however these could differ in a new UK-Japan FTA.
Note that tariffs are not always utilised under preferential agreements.[footnote 72] A number of costs, including complying with rules of origin documents and understanding the agreement’s terms often reduce the take-up of preferences. In order to account for these effects, effective tariff liberalisation is reduced in the modelling. Econometric estimates for the costs of compliance are added to the change in non-tariff measures outlined in the next section. These act to reduce the total gains from tariff liberalisation.[footnote 73]
NTMs and regulatory restrictions to services
Non-tariff measures include all barriers to goods trade that are not tariffs. This includes customs controls, differences in national regulatory regime and restrictions on the international movement of people. These only capture barriers to trade flows, not to investment or policy measures affecting domestic productivity.
Services trade is not subject to tariffs. However, services trade can be subject to a range of regulatory restrictions which raise the costs associated with trade in services.
Levels and actionability
To simulate the potential changes in non-tariff measures and regulatory restrictions to services that could occur following a UK-Japan FTA, this assessment uses historical precedent as its basis. A gravity model is used to estimate the historic impact of ‘shallow’, ‘medium’ and ‘deep’ FTAs[footnote 74] on barriers to trade.[footnote 75] A renegotiated UK-Japan FTA is assumed to reduce actionable non-tariff measures affecting goods and regulatory restrictions to services affecting trade further than the historical precedent.
As typically assumed in modelling exercises, only a portion of initial NTM levels and regulatory restrictions to services are assumed to be ‘actionable’[footnote 76] in a trade agreement. The definition of ‘actionability’ in this context is taken to be the difference between the MFN-based NTM levels and the intra-EU NTM levels. It is assumed that intra-EU NTM levels represent the lowest possible level of barriers from bilateral liberalisation.
There is a degree of uncertainty surrounding the estimates of non-tariff measures and regulatory restrictions to services and the scenarios chosen. These uncertainties are common to all modelling simulations used to estimate the impact of trade agreements. The actual change in non-tariff measures and regulatory restrictions to services that results from a UK-Japan FTA may be different from these assumptions, and the exact terms of the agreement are not yet known. Therefore, this assessment uses the impact of historical deep trade agreements as a proxy.[footnote 77]
In reality, actionability for individual goods or services may be either higher or lower than the levels assumed within this modelling. The provisions within the FTA are modelled as reducing the costs associated with trading between the UK and Japan – i.e. reducing the “ad valorem equivalent” of tariff, non-tariff measures and regulatory restrictions to services which currently exist between the two countries.
Annex B sets out the data and methodology used to estimate the initial levels of non-tariff measures affecting trade in goods and regulatory restrictions affecting trade in services and how these are converted to “ad valorem equivalents” for the purpose of modelling.
The modelled reductions in tariff and non-tariff trade costs for each sector are shown in Charts 11, 12 and 13.[footnote 78] Box 3 sets out some indicative examples of how various FTA provisions can result in trade cost reductions between countries.
Chart 11 shows that the reductions in tariff barriers are larger than the reductions in non-tariff measures for Japanese exporters. For UK exporters reductions in non-tariff measures are smaller than the reductions in tariff barriers for UK exporters. The chart also shows potential tariff reductions faced by Japanese exporters are expected to be higher than for UK exporters, whilst the potential reductions in NTMs and regulatory restrictions faced by UK exporters are expected to be higher than for Japanese exporters.
Chart 11: average trade cost reductions, percentage point change[footnote 79]
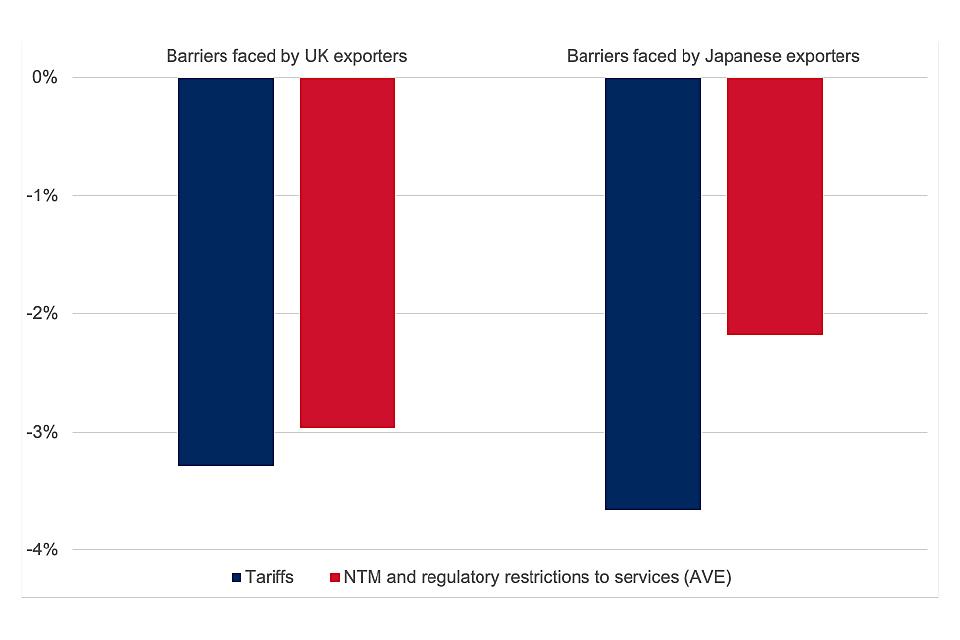
Chart 11 shows the average trade cost reduction in the UK-Japan free trade agreement scenario. It shows that reductions in non-tariff measures are smaller than those in tariffs for both parties.
Source: external CGE modelling
Charts 12[footnote 80] and 13[footnote 81] show that UK and Japanese exporters would experience the greatest trade cost reductions in agri-food sectors.
Chart 12: average change in trade costs, barriers faced by UK exporters, by sector[footnote 82]
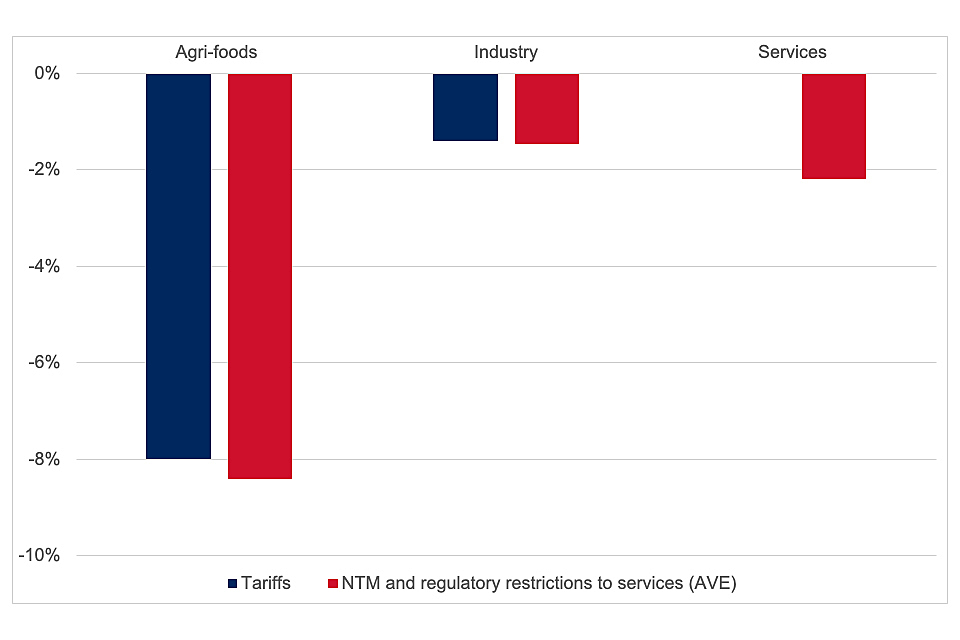
Chart 12 shows the average change in trade costs for UK exporters. It shows that they would experience the greatest tariff reductions in agri-food sectors.
Source: external CGE modelling
Chart 13: average change in trade costs, barriers faced by Japanese exporters, by sector
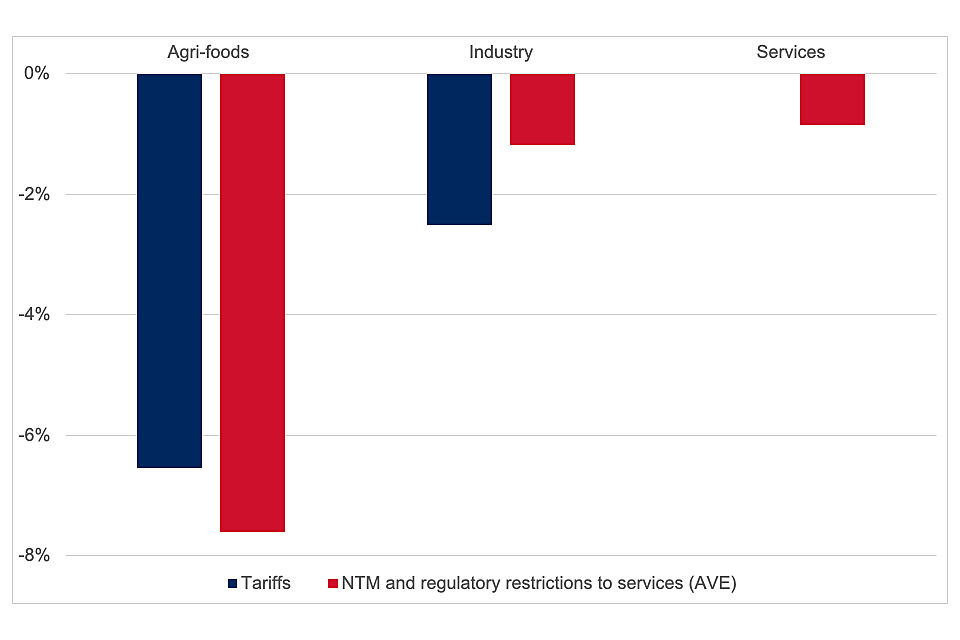
Chart 13 shows the average change in trade costs for Japanese exporters. It shows that they would experience the greatest tariff reductions in agri-food.
Source: external CGE modelling
The approach set out above is not an assessment of specific provisions of an agreement, as these are not yet known. As such the results should be interpreted as providing indicative expected impacts depending on the depth of a UK-Japan FTA.[footnote 83] Box 3 below explains the types of FTA provisions that change the cost of trading internationally.
FTA provisions which reduce the costs of trading internationally
Charts 11 to 13 describe the scenario relating to the assumed scale of trade cost reductions resulting from the trade agreement. The actual trade cost reductions will be determined by the provisions within the eventual agreement. This box describes examples of the types of provisions within an FTA which can reduce the costs of trading goods and services.
Reductions in costs associated with trading agricultural and industrial goods
The tariff reductions in Charts 12 and 13 reflect the reduction or removal of tariffs on goods trade. The reductions in non-tariff measures reflect generalised assumptions of ambition and do not attempt to model any specific provisions. These could include:
- providing greater certainty to goods traders (for example removing or reducing the gap between maximum tariffs countries have committed to in their WTO schedules and the tariffs they apply in practice)
- providing greater ease for goods traders (for example streamlining customs procedures, reducing administrative costs and reducing delays at the border)
- addressing ‘behind-the-border’ barriers to goods trade (for example improving bilateral or international cooperation on non-tariff measures)
The CGE modelling does not account for rules of origin compliance which may affect estimated impacts.
Reductions in costs associated with trading services
Services trade is not subject to tariffs. However, services trade can be subject to a range of regulatory restrictions which raise the costs associated with trading services. The trade cost reductions in Charts 12 and 13 reflect the reduction or removal of these regulatory restrictions.
From an economic perspective, it is assumed FTAs can reduce the costs associated with trading services by introducing provisions which:
- lower barriers and ensure fair competition (thereby allowing greater market access for foreign service suppliers)
- provide greater certainty to service suppliers by ‘locking-in’ current levels of market access
- reduce policy uncertainty on digital trade and flows of data which may positively impact a wider range of industries
4. Overall impact of a UK-Japan trade agreement
This section presents estimates of the long run impacts of a UK-Japan FTA on welfare, GDP, trade and sectoral output in the UK.
A renegotiated trade agreement with Japan could increase UK GDP by 0.07% in the modelled scenario compared to the UK not having a trade deal with Japan, which would be sustained over time. This is an equivalent of £1.5 billion compared to GDP in 2018 level.[footnote 84] This increase reflects changes to the underlying economy brought about by a reduction in barriers with Japan. The reduced costs for firms and consumers result in changes to domestic specialisation and the composition of imports. Productivity gains are driven by resources moving to where they are more productive, including between sectors and industries, as well as between firms within sectors. The long term is generally assumed to mean 15 years from implementation of the agreement.
In the long run, many sectors are estimated to increase output, suggesting productivity gains from further specialisation taking place within sectors, through the reallocation of resources to more productive firms. There is some resource reallocation between sectors, with several sectors reducing employment as workers find employment in other sectors. However, many of these sectors still experience increased output due to productivity gains. In the modelled scenario, workers are expected to experience increases in real wages overall.
UK goods and services could become relatively more competitive in Japan with exports to Japan estimated to increase by 21.3%. UK firms could expand production to meet increased demand from Japan, experiencing productivity gains from increasing returns to scale.
Imported goods and services from Japan facing lower trade costs could drive efficiency gains for UK businesses. This could occur either because firms already rely on or switch to inputs from Japan. UK consumers may also benefit if cheaper consumer goods become available. Although in the long run prices may also adjust upwards to reflect higher demand, imports from Japan are estimated to increase by 79.7%.
Imports from Japan increase significantly relative to UK exports to Japan due to the assumed tariff and NTM reductions, especially in areas where Japan is relatively more competitive such as ‘chemical, rubber and plastic products’, ‘manufactures of materials’, ‘motor vehicles and parts’,’ other machinery and equipment’ and ‘other transport equipment’. Although imports from Japan increase significantly, total UK imports from all countries (including Japan) are expected to increase by a more modest 0.6%. For context, in 2018 UK imports from Japan were £15.2 billion (2.3% of UK total imports).
Welfare gains of around £1.2 billion are driven by better paid jobs and changes to the prices and variety of goods and services available to households and firms. The modelling estimates an increase in the long run level of the average real wage in the UK of around 0.09% (£0.8 billion).
Based on the changes to output by sector, a renegotiated UK-Japan trade deal has the potential to increase long run output across all nations and regions of the UK. Output is estimated to increase the most in London, the East Midlands and Scotland relative to the baseline.
Finally, the impacts on GDP in Japan and countries outside the agreement are also presented. GDP in Japan is expected to increase by 0.04%, demonstrating a UK-Japan FTA can bring substantial economic gains to both parties.
4.1. UK macroeconomic impacts
Results from modelling a UK-Japan FTA show long-term increases in the UK’s GDP, trade, welfare and wages. In the long run, theory and evidence suggests that international trade increases output and raises living standards through four key channels:
- domestic specialisation allows for each country to place more resources into what it is best at producing, leading to higher productivity and real wages
- greater variety of inputs and products for businesses and consumers, increased competition and lower prices lead to more efficient production for businesses, better value for money and increased consumer choice
- access to new markets allows firms to expand their production leading to efficiency improvements where there are increasing returns to scale
- exposure to competition leads to demand shifting away from the least competitive firms while the most productive firms gain new opportunities
The macroeconomic impacts estimated using the CGE model are summarised in Table 5.
While the analysis draws on robust evidence and the best tools available for this type of analysis, there is inherent uncertainty in the results. Results should be interpreted with caution and not considered economic forecasts for the UK economy.
The impacts indicate that a combination of increased competitiveness of UK exports in Japan, increased competition from Japanese firms and price changes are expected to drive productivity gains in the UK. These can in turn lead to an expected long run increase in GDP, welfare and trade with Japan.
Table 5: summary of UK macroeconomic impacts, long run change on baseline
| Change on baseline | |
|---|---|
| Change in GDP | 0.07% |
| Change in GDP | £1.5 billion |
| Change in UK exports to Japan | 21.32% |
| Change in UK imports from Japan | 79.67% |
| Change in total UK exports | 0.52% |
| in total UK imports | 0.58% |
| Change in real wages | 0.09% |
| Change in real wages | £0.8 billion |
Source: external CGE modelling, £ values in 2018 terms
4.1.1. Real GDP
Gross domestic product (GDP) can be defined in the following ways:
- the total value of goods and services produced domestically
- total domestic expenditure
- total income from domestic production
Equivalent variation and real GDP measure different aspects of the potential impacts of the trade agreement. The former focuses on welfare and the latter looks at the wider economic effects on a country’s domestic production value.
Increases to long run GDP in the CGE model are driven by changes to the relative cost of materials and factor inputs (labour and capital) which are influenced by reductions in the cost of imports and exports (through lower tariffs, non-tariff measures and regulatory restrictions to services). The increases in GDP derive from a more efficient reallocation of resources across the economy. Further, higher returns to capital can increase investment and productivity, which can also contribute to higher long run GDP.
A UK FTA with Japan is estimated to increase the UK’s long run annual GDP by 0.07%. In 2018, the GDP of the UK was around £2.12 trillion.[footnote 85] This increase would apply to the UK’s future GDP, rising in monetary value as the economy grows. Applied to 2018 GDP levels (£2.12 trillion), it translates into a £1.5 billion increase.
The long term is generally assumed to mean 15 years from implementation of the agreement.
The components of GDP covering spending by consumers and government, investment and trade are summarised in Table 6.
Table 6: impact on the components of GDP relative to the baseline, long run percentage change[footnote 86]
| Components of GDP | Percentage change relative to the baseline |
|---|---|
| Consumption expenditure | 0.05 |
| Investment | 0.05 |
| Government expenditure | 0.05 |
| Exports | 0.52 |
| Imports | 0.58 |
Source: external CGE modelling
The modelled trade cost reductions are set out in section 3.2, which show that the estimated reductions for non-tariff measures and regulatory restrictions to services are larger than for tariffs for UK exports to Japan. The exact magnitude of the increase in GDP from an FTA is uncertain and will depend upon the actual trade cost reductions achieved through negotiations.
4.1.2. Trade
UK exports to Japan are estimated to increase by 21.3% in the modelled scenario. Using UK trade data for 2018[footnote 87], this would imply an increase in UK exports to Japan of £3.0 billion. UK imports from Japan are estimated to increase by 79.7%. Using UK import data for 2018, this would imply an increase in UK imports from Japan of £12.1 billion.
Imports from Japan increase significantly relative to UK exports to Japan due to the assumed tariff and NTM reductions, especially in areas where Japan is relatively more competitive such as ‘chemical, rubber and plastic products’, ‘manufactures of materials’, ‘motor vehicles and parts’,’ other machinery and equipment’ and ‘other transport equipment’. Although imports from Japan increase significantly, total UK imports from all countries (including Japan) are expected to increase by a more modest 0.6%. For context, in 2018 UK imports from Japan were £15.2 billion (2.3% of UK total imports).
4.1.3. Welfare
The impact of a UK-Japan FTA on overall welfare in the UK is driven by better paid jobs but also changes to the prices and variety of goods and services available to consumers and firms. Welfare in the CGE model is calculated using “equivalent variation” which estimates the change in income that, in the absence of the agreement, would have given households the same increase in wellbeing.
A UK FTA with Japan is estimated to increase in welfare in the UK by 0.05% in the modelled scenario. Using 2018 data, this implies a long run annual increase in welfare in the UK of around £1.2 billion.[footnote 88]
4.2. UK Impacts on sector gross value added (GVA)
Overall output for the UK is expected to increase. Almost all sectors (as aggregated within the model) are estimated to increase output, suggesting productivity gains from further specialisation within sectors and the reallocation of resources to more productive firms.
Gross value added (GVA) is a measure of economic output.[footnote 89] The sectoral pattern of changes to GVA can depend on a variety of effects including the scale of assumed trade cost reductions, the existing sector trade flows, the relative competitiveness of the sector in relation to trade partners, and the reliance on other sectors’ products in their own production.
The results in this scoping assessment provide an indication of the potential changes from assumed reductions in tariffs, non-tariff measures and regulatory restrictions to services across all sectors. These results are direct outputs of the CGE model (for discussion on sectoral analysis using CGE modelling, see Box 1. The actual pattern of changes to sectoral GVA resulting from implementation of an agreement will depend heavily upon the provisions of the agreement, which will determine the pattern of trade cost reductions across sectors. Therefore we may see changes in sectoral results (and other analysis such as the regional results that rely on the sectoral figures) between the scoping assessments and final impact assessments.
Under the modelled scenario, the largest percentage increase in GVA is estimated to be in the textiles and leather sector which is primarily driven by the assumed 11% tariff reduction on UK exports to Japan for this sector.[footnote 90] A small reduction in GVA relative to the baseline is estimated in the manufacture of motor vehicles and the manufacture of machinery and equipment sectors due to tariff and NTM reductions. It is likely that the fall in GVA (relative to the baseline) is driven by a reallocation of resources (capital and labour) away from these sectors to other sectors of the economy that are growing more in response to the FTA.
As the details of a potential FTA between the UK and Japan are not yet known, potential impacts have been estimated for a broad scenario. These impacts illustrate a range of potential outcomes. While broadly based on the existing EPA, the scenario does not reflect any specific provisions that could be contained in an eventual UK-Japan agreement. Additionally, at this stage prior to negotiations beginning, the analysis does not attempt to capture the impacts of reducing barriers to foreign direct investment or changes to regulations governing the temporary movement of service workers across borders.
Impacts on the motor vehicles and chemicals, rubber and plastics sector
Overview of motor vehicles sector
In 2018, the UK motor vehicle industry contributed £17.0 billion to the economy, 1% of UK GVA.[footnote 91] UK exports and imports of motor vehicles, totalled £40.1 billion and £56.0 billion respectively in 2018.[footnote 92]
According to SMMT, in 2018, three out of the top four British car best-sellers worldwide were from Japanese brands, namely Nissan, Honda and Toyota.[footnote 93] Motor vehicles made up around 19% of UK imports from Japan in 2018.[footnote 94]
As part of the EU-Japan EPA, the majority of tariffs on Japanese automotive exports (in final and intermediate goods) to the EU will be eliminated by 2025. Furthermore, the EU-Japan EPA aligns EU and Japanese standards in automotive and automotive parts which simplifies processes for EU and Japanese exporters.
Overview of chemicals, rubber and plastics sector
In 2018, the chemicals, rubber and plastics sector contributed £35.1 billion to the economy, 2% of UK GVA.[footnote 95]
The UK imported £0.7 billion of chemicals, rubber and plastics from Japan, and exported £1.1 billion to Japan in 2018.[footnote 96] Under the EU-Japan EPA, EU tariffs on chemical, rubber and plastic imports from Japan were mostly removed at entry into force of the agreement.
Potential impacts on motor vehicles and chemicals, rubber and plastics sectors
The CGE modelling assumes long-run tariff reductions of around 6 percentage points on vehicles imports to the UK from Japan and reductions of around 4 percentage points on chemicals, rubber and plastics sector imports from Japan. For UK exports to Japan, the CGE modelling assumes long-run tariff reductions of around 1 percentage point on chemical, rubber and plastic products whereas the MFN tariffs on vehicles are already zero so no further tariff reductions are modelled.
The modelling also assumes reductions of non-tariff measure reductions for both Japan and the UK affecting the motor vehicles sector of around 6 and 7 percentage points respectively. The modelling does not assume any non-tariff measure reductions for the UK or Japan for the chemicals, rubber and plastics sector.
In the long run, both bilateral UK exports and imports increase for both sectors as a result of this agreement, however the increase in imports outweighs the increase in exports for both sectors. As Japan is relatively competitive in these sectors, the increase in imports across both sectors could lead to higher competition for domestic producers, resulting in a reduction of value added in the motor vehicles and chemicals, rubber and plastics sector of between -0.05 to -0.5% for motor vehicles and below -0.5% for chemical, rubber and plastic products.
It is likely that the modelled contraction in UK output against the baseline (measured by GVA) in the motor vehicles and chemicals, rubber and plastics sector reflects a reallocation of resources from this industry to other expanding sectors.
Although not captured in the modelling, there is a body of literature which points to the relationship between a tariffs and foreign direct investment. The evidence suggests there is an ambiguous relationship.[footnote 97]
The impact of a UK-Japan FTA on the both sectors is uncertain as the specific provisions of the FTA have yet to been negotiated. CGE modelling is a standard methodology used for assessing the impact of trade agreements. More generally, the modelling uses the GTAP 10 dataset which does not take account of significant recent changes in each country’s production profile or recent changes in trade between the UK and Japan. As a result, the estimated impact of a UK-Japan FTA in both the motor vehicles and chemical, rubber and plastic products sectors is subject to uncertainty.
Table 7: changes in UK output (GVA, long run % change)[footnote 98]
Key: above 0.5% (++), 0.05 to 0.5% (+), -0.05 to 0.05% ( ), -0.05 to -0.5% (-), Below -0.5% (–)
| Type | Sector | Sector GVA Share | GVA change |
|---|---|---|---|
| Agri-food | Agriculture | <1% | + |
| Agri-food | Processed foods | 1% | + |
| Agri-food | Other processed foods | <1% | + |
| Agri-food | Beverages and tobacco products | <1% | + |
| Industry | Energy | 3% | + |
| Industry | Textiles and leather | <1% | ++ |
| Industry | Manufactures | 2% | + |
| Industry | Paper and printing products | 1% | + |
| Industry | Chemical, rubber, plastic products | 2% | – |
| Industry | Manufacture of motor vehicles | 1% | - |
| Industry | Manufacture of other transport equipment | <1% | + |
| Industry | Manufacture of electronic equipment | 1% | |
| Industry | Manufacture of machinery and equipment | <1% | - |
| Industry | Manufacturing n.e.c. | <1% | + |
| Services | Other services (transport, water, dwellings) | 12% | + |
| Services | Construction services | 6% | + |
| Services | Wholesale and retail trade | 14% | |
| Services | Communications services | 1% | + |
| Services | Financial services | 6% | + |
| Services | Insurance services | <1% | + |
| Services | Business services | 23% | + |
| Services | Personal services | 4% | + |
| Services | Public services | 19% |
Source: external CGE modelling
4.3. Impact on GVA in UK nations and regions
A UK-Japan FTA has the potential to increase long-run output across all nations and regions of the UK. International evidence suggests that trade agreements and trade liberalisation more generally have the potential to affect regions within an economy differently.[footnote 99] This is because trade agreements affect sectors differently and the sectoral composition of output and employment vary systematically across regions.
As explained further in Annex C, the preliminary assessment in Chart 14 apportions the UK-wide results to the nations and regions of the UK based upon the sectoral composition of employment in each area, accounting for some second-round effects where a sector is particularly important (or not) for a region.[footnote 100]
Based upon the pattern of estimated sectoral GVA changes in Table 7, the results suggest that an FTA with Japan could increase GVA in all nations and regions of the UK. Output is estimated to increase the most in London, the East Midlands and Scotland relative to the baseline. In comparison, output is estimated to increase the least relative to the baseline in the North East, North West and West Midlands.[footnote 101]
Chart 14: changes in Regional Value Added, long run % change
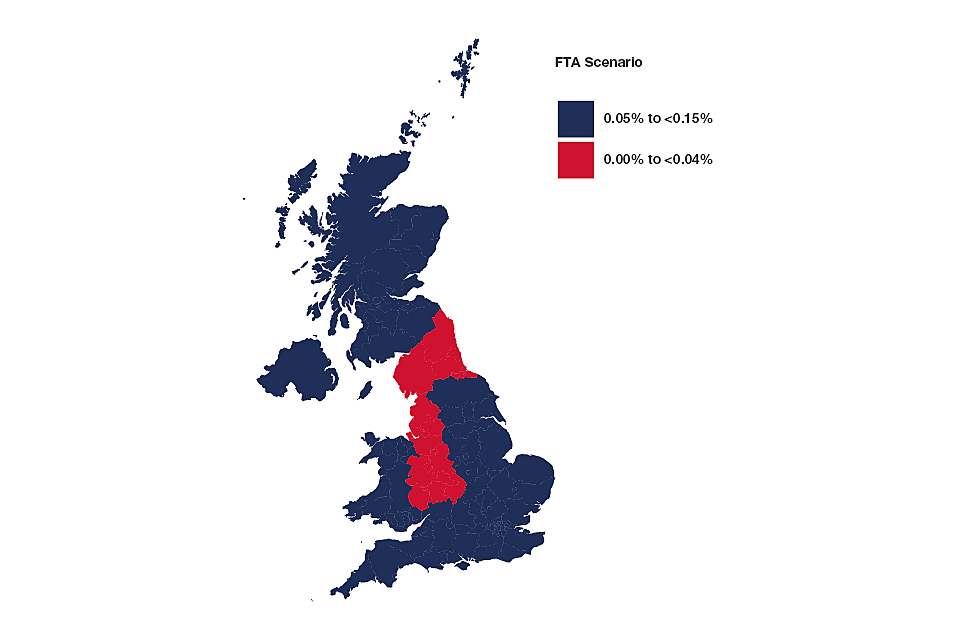
Chart 14 shows the estimated long run change in GVA by UK nations and regions in the modelled scenario. It shows GVA could increase in all nations and regions.
Source: DIT modelling (2020)
4.4. Macroeconomic impacts on Japan
Results from modelling a UK- Japan FTA show a long-term increase to Japan’s GDP.
As a result of a renegotiated UK-Japan trade deal, Japan’s annual GDP is estimated to increase in the long run by 0.04% compared to not having a deal with the UK. Using Japan’s GDP values for 2018, this would equate to an increase in Japan’s GDP of £1.5 billion. Summary results for the impact on Japan’s economy are set out in the table below.
Table 8: summary of estimated long-run impacts on Japan
| Impact | Metric | Change |
|---|---|---|
| GDP | Change in GDP | 0.04% |
| Trade | Change in Japan’s exports to UK | 79.67% |
| Trade | Change in Japan’s imports from UK | 21.32% |
| Trade | Change in total JPN exports | 0.49% |
| Trade | Change in total JPN imports | 0.49% |
Source: external CGE modelling results
4.5. Impact on developing countries
Developing countries with a higher share of their trade with the UK and Japan, including countries in the Asia Pacific region, are more likely to be impacted.
A UK-Japan trade agreement could affect output in other countries outside of the agreement. On the one hand, increased UK-Japan economic activity may positively affect other countries through increases in the size of the UK and Japan as export markets.[footnote 102] On the other hand, consumers and businesses may shift their demand for imports from other countries, preferring cheaper imports from the UK and Japan.[footnote 103]
Based on the scenario presented above, the impact of a UK-Japan FTA on developing countries is likely to be negligible. At this stage, it is not possible to identify the specific countries that will be impacted. However, Table 9 presents developing countries’ dependency on UK-Japan goods trade.[footnote 104] The breakdown is likely attributable to the geographic closeness of the Asia-Pacific region to Japan and the long-standing relationship between countries in the Asia-Pacific region and the UK.
Table 9: developing countries’ share of goods trade with the UK and Japan[footnote 105]
| Dependency | Countries |
|---|---|
| High dependency (top 20) | The Bahamas, Belize, Cambodia, Cook Islands, Grenada, Indonesia, Kiribati, Liberia, Marshall Islands, Federated States of Micronesia, Niue, Palau, Papua New Guinea, Philippines, Seychelles, South Africa, Tuvalu, Vanuatu, Vietnam |
| Low dependency (bottom 20) | Afghanistan, Armenia, Benin, Cape Verde, Comoros, Democratic Republic of Congo, East Timor, Eritrea, Guinea, Guinea-Bissau, Kyrgyz Republic, Lesotho, Mali, Niger, Somalia, South Sudan, Swaziland, Syrian Arab Republic, Tajikistan, Togo |
Source: UN Comtrade database
5. Detailed impacts by main groups
This section provides an initial assessment of impacts on UK businesses, consumers, and workers. UK businesses may benefit from the opportunity to expand into the Japanese market by exporting more and increasing business investment in Japan in response to increased returns from investment.
As output in most sectors of the UK is estimated to expand, the positive gains from the FTA will be distributed across the economy. Analysis of the distribution of SMEs across sectors does not provide any evidence that SMEs would be disproportionately impacted by the FTA.
Compared to not having a trade agreement with Japan:
- total annual tariff reductions on UK imports from Japan were estimated to be between £183 million and £275 million per year
- businesses could face annual tariff savings from liberalisation of intermediate goods of between £65 million and £98 million
- cost savings due to tariff liberalisation on final goods are expected to be between £118 million and £177 million, which could be passed to consumers
Workers of all skill types are expected to benefit from a marginal increase in real wages. The modelling suggests some small reallocation of jobs across sectors. This does not account for labour adjustment as the model assumes that in the long run the overall employment level is unaffected by changes in trade costs. A preliminary assessment of the labour impacts finds that the representation of protected groups (in relation to age, gender, ethnicity and disability) within sectors where employment is expected to fall relative to the baseline, is largely in line with the general population of the workforce. In the modelled scenario, however, there is expected to be a higher proportion of men than women in these sectors compared to their representation in the working age population.
5.1. Impacts on UK businesses
A UK-Japan FTA could positively impact on business in the UK and Japan, through export and investment growth, potential tariff savings, and gains for SMEs.
FTAs can generate a range of opportunities and challenges for businesses. Existing exporters and importers can benefit from the new trade opportunities offered by tariff liberalisation and reductions in non-tariff measures and regulatory restrictions, while firms that do not currently export may be more incentivised to do so.[footnote 106]
FTAs can also benefit businesses by expanding access to cheaper and increased varieties of imported inputs. Greater access to global supply chains are an important source of competitive advantage for businesses.
Some businesses may experience greater competition from imports from Japanese exporters. The evidence shows that competition from trade promotes business innovation and growth. Some businesses may expand, creating more jobs, but some businesses may be adversely affected due to the increased competition.
5.1.1. Business growth
FTAs can help businesses expand their presence in a market into which they export. As well as increasing turnover, this can allow businesses to benefit from economies of scale which lower their operating costs and raise profitability. This can help them attract investment and expand further.
The modelling results estimate a 0.05% increase in investment in the UK. Note that these investment effects do not include any changes in the incentives of Japanese firms to avoid tariffs to the UK by investing directly.
The modelling results also estimate a 21.3% increase in UK exports to Japan. This demonstrates that expanded market access to Japan could create opportunities for UK exporters.
5.1.2. Cost savings due to tariff liberalisation on UK imports of intermediates and capital goods
By reducing tariffs on imports, FTAs can reduce costs and expand the choice of imported inputs for UK businesses. This can help to raise their competitiveness.
The extent to which UK firms (and consumers) benefit from reduced tariffs depends on whether importers or exporters bear the burden of the tariff when goods are traded across borders. Although the academic evidence is inconclusive,[footnote 107] it is generally accepted that importers in a country bear the cost associated with tariffs.[footnote 108]
Table 10 presents estimated annual duty savings for UK imports between the MFN regime and the EU-Japan EPA tariff schedule in two specific timeframes: 2021 and 2033.[footnote 109] These two periods have been selected to reflect the progressive duty saving increase over time due to the staged tariff reduction process that is set out in the EU-Japan EPA.
The magnitude of potential tariff savings for UK businesses that trade in goods with Japan can be calculated by considering the impact on tariffs levied on intermediate goods entering the UK, shown in table 10. This is based on the EU’s Common External Tariff (CET) schedule and the Japan-EU EPA tariff schedule. The government is currently developing its new UK MFN tariff schedule. For the purposes of this analysis, the MFN rates assumed are those that are currently applied by the UK.
Table 10: potential scale of annual tariff reductions owing to tariff liberalisation on UK imports of goods from Japan, £ million per year
| 2021 Lower bound | 2021 Upper bound | 2033 Lower bound | 2033 Upper bound | |
|---|---|---|---|---|
| Intermediate goods | 60.2 | 86.2 | 64.9 | 97.9 |
| Final goods | 56.9 | 78.3 | 118.5 | 177.5 |
| Total savings | 117.2 | 164.5 | 183.3 | 275.4 |
Source: DIT internal analysis (2020), annual average 2017-18
Note: the upper bound only accounts for the percentage of trade that entered the UK from Japan as “MFN Non-Zero” (thereby paying some tariff) between 2017 and 2018). The lower bound only accounts for the percentage of trade which did not claim some duty relief for inward or outward processing between 2017 and 2018. Due to lack of data, we assume a 100% duty relief for this lower bound estimate. Tariff reductions are also subject to rules of origin. UK consumers and UK businesses which use components imported from the FTA partner will only benefit from cheaper imports if the goods being imported meet rules of orequirements. See Annex D for more details.
In the long run, total annual tariff reductions on UK imports from Japan are estimated to be around £183 million to £275 million per year.
5.1.3. Cost savings due to tariff liberalisation on UK exports
UK exporters could benefit from the removal or reduction in tariffs on UK goods exported to Japan, resulting in increased competitiveness for UK products in the Japanese market. Increased competitiveness in the Japanese market is expected to result in UK firms expanding production and trade.
Although it is generally accepted that tariffs are paid by importers, tariff liberalisation in Japan may result in decreased costs for Japanese consumers and UK exporters. For example where UK exporters operate under “delivered duty-paid agreements”,[footnote 110] decreases in tariffs may not change the prices that are paid by Japanese importers but may directly reduce costs for UK exporters. Even if goods are not under ‘delivered duty-paid’, lower tariffs will make UK goods more attractive to Japanese importers.
Table 11 presents estimated duty savings for UK exports between the MFN regime and the EU-Japan EPA tariff schedule in two specific timeframes: 2021 and 2033.[footnote 111]
Based upon the pattern of annual average UK-Japan trade flows between 2017-18 and tariffs in 2018, UK exports of final goods to Japan could remove tariff costs of around £18 million annually when eliminating the majority of MFN tariffs in the long run (2033).[footnote 112] UK exports to Japan of intermediate goods could remove tariff costs of around £14 million in 2021 and around £15 million annually when eliminating the majority of MFN in the long run (2033).[footnote 113]
Table 11: potential scale of annual tariff reductions owing to tariff liberalisation on UK exports of goods to Japan, £ million per year
| 2021 | 2033 | |
|---|---|---|
| Intermediate goods | 13.5 | 14.9 |
| Final goods | 15.2 | 18.4 |
| Total savings | 28.7 | 33.3 |
Source: DIT internal analysis (2020)
Small and medium sized enterprises (SMEs)
SMEs may be defined as:
- firms employing fewer than 50, and fewer than 250 employees respectively
- firms not exceeding either (a) £44 million in annual turnover or (b) an annual balance-sheet total of £38 million
SMEs play an integral role in engaging with the international economy. They are increasingly international traders in their own right. The data suggest that 97% of businesses exporting goods in 2018 were SMEs, accounting for 28% of total UK goods exports.[footnote 114] Moreover, SMEs form a key part of the supply chain for larger UK and global firms, by producing intermediate goods used to manufacture other goods.
Non-tariff barriers to trade addressed in FTAs may have a greater impact on SMEs than on larger businesses. This is because SMEs may have more limited financial and human resource capacities than larger businesses. They may be less well equipped to overcome the challenges posed by different regulatory frameworks, have less access to information to help them navigate through trade regulations and absorb the financial risks associated with international trade. This means that FTA provisions which reduce the fixed costs of exporting can provide particular benefits for small and medium sized enterprises. This can raise the number of smaller firms which find it profitable to export, helping to spur innovation and increase productivity.
Using Business Population Estimates turnover data, Annex D shows that the distribution of SMEs varies across the 23 sectors included in the CGE model.
Overall, sectoral impacts from the CGE model suggest that most sectors are estimated to expand (as measured by GVA). This suggests that the positive gains from the FTA will be distributed across the economy, so there is no evidence to suggest a disproportionate impact on SMEs (note that turnover data is not available for financial services or insurance sectors). Under the scenario small (including micro) and medium businesses represent 53% of businesses across all expanding sectors, in line with the general business population (see Annex D below).[footnote 115]
Some businesses may experience greater competition from imports from Japanese exporters than others. At this stage we are not able to compare the impacts on SMEs compared to other businesses in the UK economy.
5.2. Impacts on UK consumers
Lowering tariff and non-tariff trade measures through a UK-Japan FTA could benefit consumers directly through increased consumer choice, better product quality and lower prices for imported goods.
Lower consumer prices for a given quality of product (known as quality-adjusted prices), can result from reductions in tariffs and regulatory barriers which reduce the costs associated with the cross-border trade. Consumers can also benefit indirectly from the lower costs and greater variety of imported intermediate goods that are used by firms to produce final consumption goods and services.
The modelling estimates show that real consumer expenditure in the UK (a component of GDP) increases by 0.05%.
5.2.1. Consumer savings owing to tariff liberalisation on UK imports
Table 12 presents estimated duty savings for UK imports between the MFN regime and the EU-Japan EPA tariff schedule in two specific timeframes: 2021 and 2033 where the majority of remaining tariffs are eliminated.
The scenario represents the broad magnitude of potential savings for UK consumers resulting from the reduction in tariffs on goods imports from Japan. As previously discussed, the evidence of the extent to which UK consumers, as opposed to Japanese exporters, could benefit from these tariff reductions is inconclusive.
Based upon the pattern of annual average UK-Japan trade flows between 2017-18 and tariffs in 2018, in the long run UK imports of final goods from Japan could remove tariff costs of around £118-£177 million annually based on substantial tariff reductions against the MFN tariffs.[footnote 116] In addition, in the long run UK imports from Japan of intermediate goods could remove tariff costs of around £65-£98 million annually, some of which could be passed onto to consumers.
Table 12: potential scale of annual tariff reductions[footnote 117] owing to tariff liberalisation on UK imports of goods from Japan, £ million per year[footnote 118]
| 2021 Lower bound | 2021 Upper bound | 2033 Lower bound | 2033 Upper bound | |
|---|---|---|---|---|
| Intermediate goods | 60.2 | 86.2 | 64.9 | 97.9 |
| Final goods | 56.9 | 78.3 | 118.5 | 177.5 |
| Total savings | 117.2 | 164.5 | 183.3 | 275.4 |
Source: DIT internal analysis (2020)
Note: the upper bound only accounts for the percentage of trade that entered the UK from Japan as “MFN Non-Zero” (thereby paying some tariff) between 2017 and 2018). The lower bound only accounts for the percentage of trade which did not claim some duty relief for inward or outward processing between 2017 and 2018. Due to lack of data, we assume a 100% duty relief for this lower bound estimate. Tariff reductions are also subject to rules of origin.
If the savings are passed onto consumers, then consumers may also benefit from reductions in the cost of intermediate goods imported by business in the form of lower prices. However, not all of the tariff reductions will pass through into consumer prices as some businesses may absorb the benefit from the reduced tariff cost on intermediate goods. Calculated in this way, consumer savings when importing final goods are equivalent to the reduction in tariff revenues accruing to the UK Exchequer.
5.3. Impacts on UK workers
Workers of all skill types are expected to benefit from an FTA through a marginal increase in real wages. The modelling suggests some small reallocation of jobs across sectors.
Workers can benefit from FTAs through a variety of channels.
-
Higher incomes and wages. Where FTAs boost productivity within firms and sectors, and across the economy, this is likely to increase employment opportunities and worker incomes. Where FTAs lower consumer prices, this is likely to benefit workers in the form of higher real wages, meaning that they can purchase more even if wages were constant.
-
Changes to the composition of employment. Trade liberalisation can affect the structure of the economy over time. Workers may move between jobs and sectors, as changes in the pattern of trade cause some sectors to expand and others to decline. The UK has one of the most dynamic and flexible labour markets in the world, which helps to facilitate adjustment and reduce transitional costs for workers.[footnote 119]
The CGE model estimates long-run impacts (with the long-run interpreted as the period of time taken for the economy to fully adjust to the FTA). Therefore, the model does not provide estimates of the magnitude of any potential short-run impacts, such as the impact on unemployment associated with workers moving jobs within or across sectors or within and across geographical nations and regions of the economy.
As is common in CGE modelling exercises, the CGE model assumes that both the supply of labour and overall rates of employment and unemployment in the economy are fixed in the long run (i.e. they are assumed to be unaffected by the FTA). This is appropriate as over the long term the labour market would be expected to adjust over this timeframe and FTAs would not be expected to influence the underlying drivers of the long-run employment rate.
The results below show estimates of the impacts on wages (5.3.1) and the composition of employment across sectors over the long run (5.3.2), but do not provide estimates of any potential impacts on the short or long-run employment and unemployment rates.
5.3.1 Impacts on wages
The modelling estimates an increase in the long-run level of the average real wage in the UK (nominal wages adjusted for impact of inflation) of around 0.09% (£0.8 billion).
The real wage changes can be broken down into type of occupations which vary in their skill levels (Table 13). The results show that all skill types benefit from increasing liberalisation.
Table 13: gains in wages by occupation, %
| Occupations | Gains in wages |
|---|---|
| Managers | 0.09% |
| Technicians | 0.09% |
| Clerks | 0.09% |
| Service workers | 0.08% |
| Labourers | 0.09% |
Source: external CGE modelling
5.3.2. Impact on sectoral employment
This section presents indicative estimates of long-run impacts on the composition of employment in UK sectors.[footnote 120]
There is estimated to be some variation in the sectoral employment impacts. The sectors in which the greatest proportionate decrease in employment could occur are chemicals, rubber and plastic products, motor vehicles and other services (transport, water and dwellings). In the long run, employment could increase the most in the textiles and leather sector compared to the baseline.
The modelling assumes no overall changes in the total UK employment, so this represents a movement of labour between sectors.
Table 14: long-run changes in employment (% change)
Key: above 0.5% (++), 0.05 to 0.5% (+), -0.05 to 0.05% ( ), -0.05 to -0.5% (-), Below -0.5% (–)
| Type | Sector | Change in employment |
|---|---|---|
| Agri-food | Agriculture | + |
| Agri-food | Processed foods | |
| Agri-food | Other processed foods | + |
| Agri-food | Beverages and tobacco products | |
| Industry | Energy | + |
| Industry | Textiles and leather | ++ |
| Industry | Manufactures | + |
| Industry | Paper and printing products | |
| Industry | Chemical, rubber, plastic products | - - |
| Industry | Manufacture of motor vehicles | - |
| Industry | Manufacture of other transport equipment | + |
| Industry | Manufacture of electronic equipment | |
| Industry | Manufacture of machinery and equipment n.e.c | - |
| Industry | Manufacturing n.e.c | + |
| Services | Other services (transport, water, dwellings) | - |
| Services | Construction | |
| Services | Wholesale and retail trade | |
| Services | Communications | |
| Services | Financial services | |
| Services | Insurance | |
| Services | Business services | |
| Services | Personal services | |
| Services | Public services |
Source: external CGE modelling
Modern, dynamic economies change continuously in response to global developments. This causes an ongoing process of worker and job transition in the labour market. Lower trade barriers and greater import competition could accelerate this ongoing process.
However, it is important to note that this does not necessarily represent the movement of individuals and that the magnitudes are small in comparison with regular changes in the labour market.
These results show the change in the composition of employment across sectors over the long run, but do not provide estimates of any potential impacts on total employment or unemployment rates. The model assumes that both the supply of labour and overall rates of employment and unemployment in the economy are fixed in the long run (i.e. they are assumed to be unaffected by the FTA). This is appropriate, as over the long term, the labour market would be expected to adjust, and FTAs would not be expected to influence the underlying drivers of the long-run employment rate.
The transition of employment across sectors has the potential to generate long-run gains for workers, for example leading to higher wages. However, some workers may also incur short-term adjustment costs and periods of transitional unemployment. The UK has a dynamic and flexible labour market, helping to facilitate adjustment and reduce the transition costs for workers. It is, however, important to ensure that the potential for adjustment costs are not concentrated disproportionately among certain groups of the labour market.
5.4. Preliminary assessment of implications for protected groups in the labour market
The representation of protected groups, in relation to age, gender, ethnicity and disability, within sectors affected by a UK-Japan FTA are estimated to be largely in line with the general population of the workforce.
The pattern of potential long-run changes to the sectors where workers are employed may affect different groups in the labour market differently. This is because the characteristics, such as gender, age, ethnicity and disability status, of workers differ across sectors (see Table 22 ).
Annex E provides statistics describing the characteristics of workers located in sectors where employment is expected to fall relative to the baseline as a result of the agreement.
Workers currently located in sectors where employment is estimated to be lower than would otherwise have been the case (in the absence of the agreement) cannot be assumed to be adversely affected by the FTA. For example, in some cases, workers who remain in the sector could benefit from increases in wages, owing to higher productivity in the sector. In addition, some of the adjustment may take place as workers leaving the labour market are not replaced, with new entrants more likely to find employment in sectors where employment is higher. Any workers who do transition across sectors may incur short-term adjustment costs or periods of transitional unemployment but could also benefit from the creation of higher wage jobs in other sectors of the economy. The analysis is based on the structure of the UK workforce from 2015-17, whereas the CGE modelling results reflect the global economy in the long run when the composition of the workforce may have changed.
In summary, the descriptive statistics show no evidence of a disproportionate impact of an FTA with Japan on protected groups in the UK. The only exception to this are men who are disproportionally concentrated in sectors where employment is estimated to fall relative to the baseline in both scenarios 1 and 2.
Gender
47% of those in employment in the UK are female and 53% are male.[footnote 121]
25% of the workforce in sectors where employment is estimated to fall relative to the baseline are female and 75% are male.
Ethnicity
12% of those in employment in the UK are from an ethnic minority group and 88% report that they are white.
13% of the workforce in sectors where employment is estimated to fall relative to the baseline are from an ethnic minority background and 87% are white.
Age
12% of those in employment in the UK are aged 16-24, 85% are 25-64 and 4% are over 65.
The proportion of workers in sectors where employment is estimated to fall relative to the baseline who are aged 16-24 is around 8%. The proportion of workers in sectors where employment is estimated to fall relative to the baseline who are aged 65+ make up around 4%.
Disability
Around 12% of those in employment in the UK report that they have a disability (as defined by the Equalities Act 2010).[footnote 122]
The proportion of workers in sectors where employment is estimated to fall relative to the baseline who have a disability is estimated to be around 12% and those without a disability are estimated to be around 88%.
6. The environment
This section presents current environmental policy in the UK and Japan and the potential implications of a UK-Japan FTA on the environment, including a preliminary assessment of the potential implications on UK CO2 emissions, trade-related transport emissions, biodiversity, natural resources and air pollution.
Changes in the UK’s production and global trading patterns as a result of a UK-Japan FTA could favour more or less emissions-intensive sectors and could change levels of transport emissions. However, the extent of the environmental impacts – positive or negative – is dependent on the negotiated outcome of the agreement, which will determine changes in the pattern of trade and economic activity. The government is committed to meeting its environmental commitments, as the first major economy to set a legally binding commitment to reach net zero greenhouse gas emissions, and as set out in the 25 Year Plan to Improve the Environment. This agreement may provide opportunities to further environmental and climate policy priorities.
6.1. Background – Japan and UK environmental policy and performance
Both the UK and Japan are party to a range of multinational environmental agreements and have domestic legislation in place to protect the environment.
FTAs have the potential to impact on the environment, by changing patterns of production, the types of goods and services that are traded and the commitments made by countries in respect of environmental policies and outcomes.
Sustainable development is a key objective of the UK government, highlighted across the UK’s Industrial Strategy,[footnote 123] Clean Growth Strategy,[footnote 124] Bioeconomy Strategy,[footnote 125] and 25 Year Environment Plan.[footnote 126] The Climate Change Act commits the UK government by law to reducing greenhouse gas emissions by at least 100% of 1990 levels (net zero) by 2050, and to set legally-binding ‘carbon-budgets’ to act as stepping stones towards the 2050 target.[footnote 127] The UK has met its first (2008-12) and second (2013-17) carbon budgets and is on track to outperform its third (2018-2022).[footnote 128] In Japan there are a range of laws that enshrine efforts to promote protection of the environment in Japanese law, including the Basic Act on Biodiversity.
The UK and Japan are party to a range of multilateral environmental agreements that aim to improve global environmental conditions across a broad range of issues, such as air pollution, chemicals and waste, fisheries, terrestrial ecosystems and biodiversity and species.[footnote 129] The UK and Japan are also members of international agreements related to the prevention of climate change, including the Paris Agreement.[footnote 130]
The findings from the Department for International Trade’s call for input highlighted a number of priorities and concerns related to FTAs and the environment.[footnote 131] A preliminary assessment of the environmental impacts of a future UK-Japan trade agreement has been undertaken.
The Environmental Performance Index (EPI), an internationally comparable index of environmental variables, is used to outline each country’s environmental performance. The EPI score reflects how close countries are to the best environmental outcomes for a given measure – a score of 100 indicating a world-leading performer. As shown in Chart 15, the UK is better performing than the OECD average in all measures apart from forestry and fishing. Japan performs better than the OECD average in 6 of 11 selected measures.
Chart 15: Environmental Performance Index scores for UK and Japan, 2018[footnote 132]
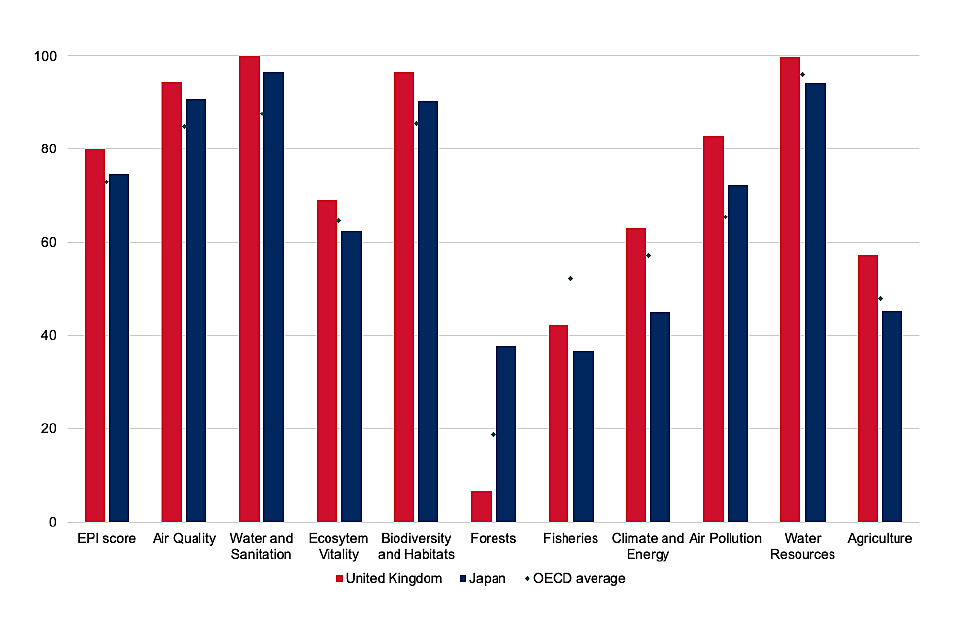
Chart 15 shows Environmental Protection Scores across 11 measures for the UK, Japan and OECD average in 2018.
Source: DIT analysis 2020
6.2. Potential implications of free trade agreements on the environment
The government is committed to meeting its environmental commitments, as the first major economy to set a legally binding commitment to reach net zero greenhouse gas emissions, and as set out in the 25 Year Plan to Improve the Environment. The overall environmental impact of FTAs is difficult to assess, but environmental impacts could arise due to the resulting changes in production and trade volumes, shifting of economic activity across different sectors and efficiency gains. Free trade fits into the government’s wider environmental agenda and this agreement may provide opportunities to further the UK’s environmental and climate policy priorities.
Further economic integration of the UK and Japan economies through an FTA could be used to foster greater cooperation on addressing these environmental issues, both bilaterally and globally.[footnote 133]
Assessing the impact of any future environmental provisions in FTAs is challenging for two reasons: (a) the content of the environmental provisions is not yet agreed, and (b) the currently available empirical studies have not robustly concluded whether provisions in FTAs intended to protect the environment have had a significant effect.[footnote 134] This is particularly true when an agreement is between two high income economies, such as the UK and Japan, where high existing environmental standards are expected to already be enforced.
However, the economic changes resulting from FTAs have the potential to affect some aspects of the environment including, for example, greenhouse gas emissions, air pollution, water quality and land use. Impacts on the environment may occur:
- as a direct result of greater volumes of bilateral and world trade (e.g. from increased production and transport emissions)
- as economic activity shifts between sectors with different levels of emissions (a ‘composition effect’)
- as economic activity shifts between countries with differing levels of environmental protection[footnote 135]
- as increased trade leads to the transfer and adoption of new, and potentially more environmentally friendly, technologies as well as production methods (a ‘technique effect’)
Further, an ambitious and comprehensive trade agreement may bring income gains in both countries, which could be used to pay for measures to mitigate negative environmental impacts, while leaving an economic surplus. However, distributional policies to reallocate benefits towards mitigating measures are outside the scope of the FTA.
6.2.1. CO2 emissions from UK production
The impact of a UK-Japan FTA on CO2 emissions is uncertain but potential changes can result from a shift in economic output between more and less CO2-intensive sectors. This will also be determined by other factors such as efficiency gains, the potential adoption of new technologies, the design of the final agreement or future carbon pricing policies.
A simple preliminary and partial assessment of the potential implications of the estimated shifts in economic activity across sectors for UK CO2 emissions and land is outlined in Annex F.
The results of the preliminary assessment suggest that the resulting shift in sectoral output will marginally move the composition of UK output from sectors that are relatively less CO2-intensive towards sectors which are, on the whole, more CO2-intensive. In the UK, power and heat generators and energy-intensive industrial sectors, must pay for the carbon they emit under the EU Emissions Trading System and will continue to do so under any UK replacement.
For these sectors, expansion may translate into greater costs to business which are not captured in the modelling.[footnote 136]
The assessment does not account for potential efficiency gains or the potential adoption of new technologies and production techniques resulting from the agreement (which would change the CO2 intensity of output within sectors) or due to policy external technological improvements. It also does not account for the impacts of any specific environmental provisions in the agreement. Nor instances where increases in domestic output displaces output in third countries (where emissions could be higher or lower) due to trade diversionary effects.
6.2.2. Transport emissions
The UK government has committed to net zero emission by 2050 and the International Maritime Organisation (IMO) has also adopted mandatory measures to reduce emissions of greenhouse gases from international shipping, under IMO’s pollution prevention treaty (MARPOL). The impact of a UK-Japan FTA on transport emissions is uncertain but potential changes may result from the change to the volume of trade, the distance goods are transported, and the composition of goods traded. This agreement may provide opportunities to further the UK’s environmental and climate policy priorities.
International transport is estimated to be responsible for 33% of world-wide trade-related emissions,[footnote 137] with shipping freight alone accounting for at least 3% of global greenhouse gas emissions.[footnote 138] The extent to which trade affects emissions is dependent on three variables, namely: the type of good being traded, the mode of transport and the distance travelled by those goods. For example, different modes of transport vary greatly in their carbon intensity; one kilogram of cargo flown on a plane generates approximately 100 times the emissions of a kilogram of cargo transported by ship (over the same distance).[footnote 139]
A UK-Japan FTA is expected to increase the value of total UK goods trade (exports plus imports). As such, we can expect several potential changes to the level of transport emissions, resulting from:
- Scaling impacts to transport emissions from increased trade.
- Increased UK-Japan bilateral trade displacing trade with partners that are geographically closer to the UK, which could increase the distance travelled by transported goods.
- A change in the types of goods traded between the UK and Japan and the modes of transport used. Transport emissions are aligned with the weight, rather than value of trade. Shifts between sectors where the ‘£ per kg’ ratio is low, such as agriculture and energy, to sectors where it is high, such as electronic equipment, could reduce transport emissions. Shifts between sectors may also impact transport emissions by changing the overall proportion of goods that are travelling by sea and air freight.
Therefore, despite knowing that an FTA will result in goods being transported across greater distances, we cannot state the extent to which total carbon emissions will be affected. A simple preliminary assessment of the impact of transport emissions from bilateral goods trade as well as simple descriptive statistics are outlined in Annex F.
6.2.3. Air pollution
The government has published its Clean Air Strategy which includes new and ambitious goals, legislation and investment. Building on the commitments set out in the Clean Air Strategy, the government has introduced air quality measures in the Environment Bill. Emissions of nitrogen oxides have fallen by 33 per cent since 2010 and are at their lowest level since records began. In addition, more stringent environmental rules regulating shipping emissions came into effect at the start of 2020 under IMO’s pollution prevention treaty (MARPOL). The overall air quality impact of FTAs is difficult to assess, increased trade can result in air pollution from additional production and trade-related transport, however, there is also evidence that membership of Regional Trade Agreements (RTAs) is linked to better air quality. This agreement may provide opportunities to further the UK’s air quality priorities.
Air pollution negatively affects human health and productivity as well as ecosystem integrity and function. Unlike carbon emissions, many of the impacts of air pollution can be localised and depend on both the source of the emissions, the scale of the population in the affected areas and the ecosystems affected. However, legislation such as the Air Pollution Control Act works to control and regulate air pollution in Japan. The UK has experienced declining national air pollutant concentrations, supported by the UK Department for Environment, Food and Rural Affairs (DEFRA), Clean Air Strategy.[footnote 140] In most places where industrial and domestic pollutant sources impact on air quality, effects tend to be steady or improving over time. Traffic pollution problems buck this trend and are generally worsening world-wide.[footnote 141] Air pollution from traffic has been reducing in the UK, but at a slower rate than air pollution from other sources.[footnote 142] Air pollution is not captured in the CO2 emissions modelling, but increased trade could increase pollution from production and trade-related transport. As explained above for CO2 emissions, the impacts would depend the volume of goods and transport modes used.
There is evidence that membership of Regional Trade Agreements (RTAs) both with and without environmental provisions is linked with improvement in two measures of air quality: concentrations of sulphur dioxide and nitrogen oxides.[footnote 143] The study does not find a definite causal link, but academics have suggested that rising incomes as a result of free trade increase demand for environmental protections.[footnote 144] If this is the case, rising incomes from a UK-Japan FTA could help improve air quality.
6.2.4. Biodiversity, land and water use
Modelling shows an increase in trade and production which may result in increased use of resources, in particular due to expansion of the energy and agriculture sectors.
Species population sizes have seen a 60% decline between 1970 and 2014,[footnote 145] highlighting the urgency of action needed to prevent further decline. Some of the main dangers worldwide include those arising from invasive alien species, climate change, nutrient loading, pollution, and ecosystem changes. Habitats which are important for ecosystem services, including water-related ecosystem services, continue to be lost and degraded.[footnote 146] The UK is committed to tackling these threats as a member of the Convention on Biological Diversity and within the 25-Year Environment Plan. Both parties are committed to multilateral environmental agreements (MEAs) such as the Convention on Biological Diversity and the United Nations Framework Convention on Climate Change.
The modelled scenario predicts an increase in bilateral trade and increases in UK and Japanese output and total trade. Additional production will result in increased use of resources – water, land and raw materials – and production of waste products.
The modelling also estimates an increase in the output of the energy sector, and to a lesser extent, agricultural sectors. These are typically land and resource intensive production activities, which can threaten biodiversity through climate change, nutrient loading and ecosystem changes. However, if increased production is already supported by or results in good farming and industrial practices these negative impacts can be mitigated. Improved standards of production could result in improvements to biodiversity, habitats and ecosystems. Agricultural land in the UK accounts for 72%[footnote 147] of total land use while making up less than 1% UK output.[footnote 148] There is limited evidence of an elastic response of land use to increased agricultural output in the UK, therefore land use could remain stable and be used more efficiently instead.
The overall impacts on resource use and biodiversity globally are difficult to fully assess, as some additional production could be the result of trade being diverted from less efficient producers based in countries with lower environmental standards. For example, in some countries with large agricultural exports deforestation for agricultural land use takes place, with negative consequences both for biodiversity and climate change. Until the final negotiated outcome is known, it is difficult to accurately quantify trade diversionary effects.
6.3. Summary of environmental impacts
As described, the government is committed to ensuring that a UK-Japan FTA will not threaten the UK’s ability to meet its environmental commitments or its membership of international environmental agreements. It may provide opportunities to further environmental policy priorities. Changes in the UK’s global trading patterns can have an impact on transport emissions and shifts in production can favour more or less emissions-intensive sectors in the UK. However, these impacts are dependent on the negotiated outcome of the agreement, which will determine changes in the pattern of trade and economic activity.
7. Labour standards
This section provides an overview of the labour protections in place in the UK and Japan and outlines the potential impacts of an FTA on labour standards. Although it is not possible to assess the exact impact of an agreement on labour issues prior to the conclusion of FTA negotiations, Japan maintains high labour standards and, as such, additional imports from Japan resulting from an FTA should be produced in line with such standards. A UK-Japan FTA is also not expected to impact on the UK’s legislation elsewhere related to UK labour issues.
7.1. Labour issues and free trade agreements
Both the UK and Japan have strong legislation on labour standards.
A UK-Japan FTA is expected to increase imports from Japan, and as such the UK will consume more goods and services from Japan produced under Japanese labour standards. The potential impacts of a UK-Japan FTA on labour standards are set out below. Table 15 below provides an overview of the labour protections in place in the UK and Japan.
Table 15: summary of UK and Japanese labour standards
| Provision | Description |
|---|---|
| Wage and statutory leave entitlement | Both the UK and Japan have legislation guaranteeing a national minimum wage, statutory leave and paid parental leave. The UK also guarantees sick pay. |
| International Labour Organisation (ILO) conventions | The UK was a founding member of the ILO and has signed and ratified all 8 fundamental conventions. Japan has adopted all but 2 of the fundamental conventions.[footnote 149] |
| Collective bargaining rights | Both the UK and Japan have legislative acts in place which guarantee the right to collective bargaining.[footnote 150] |
| Preventing labour discrimination | The UK has legislation in place which prevents discrimination of employment on the basis of gender, sexual orientation, ethnicity, religion, race or national origin.[footnote 151] Japan does not have general equality legislation, but its Labour Standards Act 1995 contains prohibitions on discrimination on the grounds of nationality and social status.[footnote 152] Furthermore, Japan has specific legislation that prohibits different types of sex discrimination. Japan has no legislation prohibiting discrimination on the basis of age or disability. |
| Child labour | Both Japan and the UK have legislation in place relating to child labour[footnote 153] and signed the ILO Convention concerning the Prohibition and Immediate Action for the Elimination of the Worst Forms of Child Labour. The UK and Japan are also signatories of the ILO Convention concerning Minimum Age for Admission to Employment, committing to pursue a national policy of having 16 as the minimum age for employment. |
| Prevention of modern slavery | The UK has been a leading country in the prevention of modern slavery, in particular with the introduction of the Modern Slavery Act in the UK in 2015. The Global Slavery Index (GSI) found whilst the UK had ‘strong government responses to modern slavery’, Japan had a ‘limited response’.[footnote 154] However, the GSI notes that Japan has recently made some positive developments in this area; for example, by making reforms to the Technical Intern Training Act. |
7.2. Potential impacts of a UK-Japan FTA
Japan maintains high labour standards and, as such, additional imports from Japan resulting from an FTA will be produced in line with such standards. A UK-Japan FTA is also not expected to impact on the UK’s legislation elsewhere related to UK labour issues.
The UK is a world leader in workers’ rights and will continue to advocate for the highest standards and conditions for its citizens now that we have left the European Union. The UK-Japan FTA may include specific labour provisions that promote higher levels of labour standards and ensure global standards are adhered to among signatories.
Labour provisions can be used to ensure a that partners do not lower their standards in order to gain a competitive advantage in relation to trade. These provisions in trade agreements have become increasingly common over the past two decades,[footnote 155] however, there is limited literature as to their effect on outcomes (for example, on wages).[footnote 156] Where impacts have been identified, they have generally been positive[footnote 157] and provisions have been found to ease labour market access, narrow the gender wage gap and not divert or decrease trade flows.[footnote 158] Cross-country empirical analysis of the impact of labour provisions is difficult for several reasons:
- different agreements contain different kinds of labour provisions
- countries already improving their labour standards may be more likely to agree to sign-up to ambitious labour provisions (a selection bias effect)
- labour provisions are a recent addition to FTAs (meaning limited available data), and depend on effective implementation, which is a lengthy and iterative process
As set out above, Japan also maintains high labour standards and additional imports from Japan resulting from an FTA should be produced in line with such standards. Whilst a UK-Japan FTA is expected to increase average wages in the UK, as set out in Table 13 above, it would have no direct impact on statutory minimum wages or leave entitlement offered within a country. More generally, the UK-Japan FTA is not expected to impact on the UK’s legislation elsewhere related to labour issues. Prior to the conclusion of negotiations, it is not possible to assess the exact impact of an agreement on labour issues.
8. Sensitivity analysis, analytical limitations and risks
To account for the uncertainty associated with the modelled scenario, the baseline and the modelling assumptions, further analysis has been conducted. This section presents modelling results of an alternative baseline for the future trading relationship between the UK and the EU. The limitations of this analysis are also explained, both the data limitations and the areas not covered by the model.
8.1. Alternative baseline
The baseline is based on stylised assumptions to represent the potential long-run future trading relationship between the UK and the EU. However, to reflect uncertainty around the future relationship between the UK and EU, a WTO relationship baseline is also modelled. The WTO baseline results show higher potential gains from a trade agreement with Japan.
The central estimates presented in this document only account for the potential changes in trade costs resulting from an FTA between Japan and the UK. They do not represent an overall economic forecast, nor do they consider the uncertainty of modelling exercises. This modelling has been conducted on behalf of the Department for International Trade by Professor Joseph Francois.[footnote 159] As a result, the CGE model used for this assessment is different from that used in HMG’s recent analysis of the economic impact of leaving the European Union, and different from that used in the United States scoping assessment.[footnote 160]
The inputs and assumptions used to construct the core scenario are uncertain, as the content of the final agreement is unknown. The impacts of the negotiated agreement may differ from the core scenario if it is far deeper or more limited in scope when compared to the headline scenario.[footnote 161]
All modelling outputs are estimated relative to a ‘baseline’. The baseline represents the economy in the absence of a UK-Japan agreement. An important assumption in this case concerns the future trading relationship between the UK and the EU. Stylised assumptions are used to represent a future hypothetical free trade agreement between the UK and EU using assumptions taken from the previous published government long-term economic analysis of EU Exit.[footnote 162]
The choice of baseline influences the impact of the agreement due to the significant trade diversionary impacts resulting from the UK’s future economic partnership with the EU.
To assess the sensitivity of the main results to the choice of baseline inputs, the impacts of the core scenario is assessed against an alternative baseline where the UK trades with the EU on WTO terms and MFN rules. This is the “modelled no deal” in the previous published government long-term economic analysis of EU Exit.
This sensitivity analysis suggests that under an alternative WTO baseline, the impact of a UK-Japan FTA could be 0.09% (equivalent to £2.0 billion based on 2018 GDP values) under the modelled scenario. This is higher than under the core baseline included in the assessment as higher barriers to trade between the UK and the EU provide higher potential for gains from trade with Japan. Table 16 below summarises the differences in results.
Table 16: summary of macroeconomic impacts under WTO baseline[footnote 163]
| Scenario under core baseline | Scenario under WTO baseline | |
|---|---|---|
| Change in GDP | 0.07% | 0.09% |
| Change in UK exports to Japan | 21.32% | 21.30% |
| Change in UK imports from Japan | 79.67% | 80.89% |
Source: external CGE modelling
8.2. Analytical limitations
There are several other limitations not explicitly accounted for in the central estimates or sensitivity analysis described above. This includes data limitations, the statistical uncertainty around model parameters, assumptions and other areas not modelled that could have a potential impact on the results.
8.2.1. Data
The data used to produce the CGE modelling results is drawn from the GTAP 10 dataset, which draws on data from 2004, 2007, 2011, and 2014. As such, changes in the pattern of World trade between 2014 and today will not be reflected in results produced by the model. Depending on changes in the pattern of trade over this period, this could lead to under- or over-estimation of the impact of a UK-Japan FTA. For example, for a given sector an increase in the proportion of UK exports being sent to Japan between 2014 and 2018 could lead to the model underestimating the impact of an FTA with Japan. This data is different to what has been used for the other HMG scoping assessments which are based on GTAP 9.
Similarly, any changes in tariff schedules between 2014 and 2018 will not be reflected in results produced by the model. However, analysis using 2017 tariff and trade data from World Integrated Trade Solution (WITS) showed that there have not been significant, permanent, changes in tariffs and trade shares between Japan and the UK between 2011 and 2017.
In order to assess economy-wide impacts, the model provides a sectoral aggregation of 23 sectors based on the underlying GTAP dataset. While this is appropriate for looking at broad magnitudes of impact, it may not fully capture the more granular interactions that occur at a sub-sector level. This limitation is common to CGE and macroeconomic analysis.
Where available, key elasticities have been sourced from academic literature and the GTAP 10 database.
8.3. Areas not modelled
As detailed in the previous published government long-term analysis of EU Exit, there are a number of areas not explicitly modelled:
- Any future trade policy initiatives that are undertaken by Japan or the European Union. Some of these policies, such as potential further trade agreements between the US and Japan, could change the potential impacts of a UK-Japan FTA. However, there is too much uncertainty in the potential and future scope of these agreements to accurately reflect this in the baseline.
- Future domestic policy choices.
- The future effects of global trends such as the rise of global value chains, the increasing importance of services trade, changing demographics, technological advancement, and economic development.[footnote 164]
- The results set out the potential long-run economic impacts of a trade agreement scenario between the UK and Japan, assuming no other changes. This analysis is not a forecast of the UK economy over a specific timeframe and does not model any transitional or short run impacts.
8.4. Risks
There are resource implications for the government associated with negotiating a UK-Japan FTA. These include staff time as well as the specific costs associated with conducting international negotiations.
The gains outlined in the analysis assume that a negotiated outcome is reached, and an agreement implemented. There is a risk that if the agreement were not implemented, these gains would not materialise, and the government would still incur the operational costs associated with pursuing the negotiations. ###9. Summary of analysis and next steps
The scoping assessment provides a preliminary assessment of the scale of the potential macroeconomic and distributional impacts of a UK-Japan FTA. These are summarised below in Table 17.
Table 17: summary of estimated impacts on macroeconomic indicators (all measured relative to the baseline)
| Impact | Metric | Change relative to the baseline |
|---|---|---|
| Growth | Change in GDP | 0.07% (£1.5 billion) |
| Trade | Change in exports to Japan | 21.32% |
| Trade | Change in imports from Japan | 79.67% |
| Trade | Change in total exports | 0.52% |
| Trade | Change in total imports | 0.58% |
| Wages | Change in real wages | 0.09% (£0.8 billion) |
Source: external CGE modelling
The estimates are based upon a scenario which relates to the scale of trade costs reductions achieved by the agreement. The provisions in the agreement are not yet known and the estimates are subject to a high degree of uncertainty. If the eventual agreement results in different reductions in trade costs across sectors to those modelled in this assessment, then the scale and distributional impacts are likely to differ from those outlined here.
9.1. Next steps
DIT is committed to a transparent and evidence-based approach to trade policy. Therefore, following the conclusion of negotiations and once the text of the agreement is known, a full impact assessment will be published prior to implementation. The full impact assessment will update and refine the preliminary estimates of the scale and distribution of impacts outlined in this scoping assessment.
The full impact assessment will include:
- Updated modelling of the scale and distribution of impacts based upon refinements to the assumptions underpinning the scenario in line with further detail of the negotiated outcome and in line with new evidence as it emerges.
- Further analysis of the sectoral, distributional, social and environmental impacts of the agreement, and of the impacts on developing countries.
DIT has established several stakeholder engagement mechanisms to seek expert insight on relevant trade policy matters and to help build the evidence base to support future detailed impact assessments. These groups will enable the government to draw on external knowledge and experience to enhance the evidence base underpinning the UK’s trade policy.
Prior to implementation of this agreement, DIT will publish a monitoring and evaluation framework explaining how the department intends to monitor and evaluate FTAs. Following implementation of the agreement, over the longer term DIT will monitor the implementation of the agreement and publish an evaluation of the agreement at the appropriate time.
Technical annexes
10. Annex A: description of Computable General Equilibrium model
The externally commissioned macroeconomic analysis uses a CGE model. The model is based on the standard GTAP model and GTAP 10 dataset (referenced to 2014 as the base year) and has been extended further to incorporate insights from modern economic trade theory. The GTAP model and dataset is one of the most widely-used tools for international trade analysis. The following section highlights the key model features and assumptions on model structure underpinning the model.
10.1. Model features
There are two well-established, robust methods used in this assessment to estimate the impact of a UK-Japan FTA:
- Econometric gravity modelling – This type of modelling can test the relative importance of the economic size and geographic distance between two countries in determining bilateral trade flows. In this assessment, gravity modelling has been used to estimate the changes in non-tariff measures and regulatory restrictions to services.
- General equilibrium modelling – This model links all sectors and agents of an economy together and therefore captures any positive or negative spill over effects from a trade agreement. For example, if tariffs are reduced for a particular good, its use as a final and intermediate good may increase due to lower prices. This has expansionary effects for other sectors that rely on the good for their own production and further effects for the incomes of workers, firms, and government.
The CGE model used in this assessment is based upon the most recent version of the Global Trade Analysis Project (GTAP) database, version 10. It is the same model as that used in the recently published Journal Article “Melting Ice Caps and the Economic Impact of Opening the Northern Sea Route,” The Economic Journal, Volume 128.[footnote 165]
The model is a general equilibrium model with multiple countries, multiple sectors, intermediate linkages and multiple factors of production, as developed in Bekkers et al (2018a,b). Trade is modelled as in Eaton and Kortum (2002) with the remaining structure of the model largely following the GTAP model (Hertel, 2013). The main difference from GTAP is the incorporation of the Eaton and Kortum demand structure, where he derives the gravity equation for his structural estimation of the trade elasticities and changes in trade costs, as discussed above, from this same model. The model set-up and calibration combine features of the older computable general equilibrium (CGE) models (cf. Dixon and Jorgenson, 2013), with the micro-foundations of the more recent quantitative trade models (see Costinot and Rodríguez-Clare, 2014, for an overview). This means analytically it models trade linkages with the improved micro-founded Eaton and Kortum (2002) structure, while at the same time he has structurally estimated the trade parameters and relevant trade cost changes employing a gravity model derived from the structural general equilibrium model. In the computational model, parameters are based on the underlying model data – trade elasticities estimated econometrically from the underlying trade data, other (share terms) fitted from the actual model data, and some elasticities (specifically substitution in value added) taken from the literature. Following Egger and Nigai (2015) and Bekkers et al (2018), total trade costs and technology parameters are fit from actual import shares (calibration), imposing an exact fit. Changes in trade costs (the structural general equilibrium experiments themselves) follow from the gravity-based estimates of trade costs arising from NTMs.
It should be noted that the model used in this assessment is different from that used for other HMG economic analyses, including DIT’s scoping assessments related to the United States and government published analysis related to EU Exit.[footnote 166]
Some primary differences (not an exhaustive list) that may affect the results include the following.
This CGE model:
- is based on slightly newer data, 2014, rather than 2011
- assumes perfect competition in all sectors of the economy, and that they are subject to Constant Returns to Scale
- assumes that capital is mobile across regions
- is calibrated to economic estimates of trade cost elasticities derived from structural gravity modelling. See Appendix A of Bekker et al (2018) for more information
- employs a projection of the world economy to 2035
- assumes that non-tariff measures and regulatory restrictions to services are completely deadweight barriers known as “Iceberg Costs”. Other HMG modelling assumes that 30% of non-tariff measures and regulatory restrictions to services are instead rent-generating.
10.2. Sectors
Table 18 shows how the sectors provided in the source data are grouped together for the purposes of this scoping assessment analysis.
Table 18: sector grouping
| Sector name | GTAP 9 code | Sector description |
|---|---|---|
| Agriculture, forestry, and fishing | pdr | Rice |
| Agriculture, forestry, and fishing | wht | Wheat |
| Agriculture, forestry, and fishing | gro | Maize |
| Agriculture, forestry, and fishing | v_f | Vegetables, fruits and nuts |
| Agriculture, forestry, and fishing | osd | Oil seeds and oleaginous fruit |
| Agriculture, forestry, and fishing | c_b | Plants used for sugar manufacturing |
| Agriculture, forestry, and fishing | pfb | Raw vegetable materials used in textiles |
| Agriculture, forestry, and fishing | ocr | Plants and crops |
| Agriculture, forestry, and fishing | ctl | Livestock except swine and poultry |
| Agriculture, forestry, and fishing | oap | Swine, poultry and other animals, live |
| Agriculture, forestry, and fishing | rmk | Raw milk |
| Agriculture, forestry, and fishing | wol | Raw animal materials used in textile |
| Agriculture, forestry, and fishing | frs | Forestry and logging |
| Agriculture, forestry, and fishing | fsh | Hunting and fishing |
| Semi-processed foods | cmt | Livestock meat |
| Semi-processed foods | omt | Meat of swine |
| Semi-processed foods | vol | Vegetable oils |
| Semi-processed foods | mil | Dairy products |
| Semi-processed foods | pcr | Rice semi- or wholly milled |
| Semi-processed foods | sgr | Sugar |
| Other processed foods | ofd | Other processed foods |
| Beverages and tobacco products | b_t | Beverages and tobacco products |
| Energy | coa | Mining of coal |
| Energy | oil | Extraction of crude petroleum and natural gas (part) |
| Energy | gas | Extraction of crude petroleum and natural gas (part) |
| Energy | omn | Mining and quarrying of metals and ores |
| Energy | p_c | Manufacture and processing of fuels |
| Energy | ely | Production, collection and distribution of electricity |
| Energy | gdt | Manufacture and distribution of gas, steam and hot water supply |
| Textiles, apparel, and leather | tex | Manufacture of textiles and man-made fibres |
| Textiles, apparel, and leather | wap | Manufacture of wearing apparel; dressing and dyeing of fur |
| Textiles, apparel, and leather | lea | Leather products |
| Paper and printing products | ppp | Paper and printing products |
| Chemical, rubber, plastic products | crp | Manufacture of basic chemicals, rubbers, and plastics |
| Chemical, rubber, plastic products | lum | Wood products |
| Manufactures | nmm | Manufacture of other non-metallic mineral products |
| Manufactures | i_s | Manufacture of basic iron and steel |
| Manufactures | nfm | Manufacture of non-ferrous and basic precious metals |
| Manufactures | fmp | Manufacture of fabricated metal products, except machinery and equipment |
| Manufacture of motor vehicles | mvh | Manufacture of motor vehicles |
| Manufacture of other transport equipment | otn | Manufacture of other transport equipment |
| Manufacture of electronic equipment | ele | Manufacture of electronic equipment |
| Manufacture of machinery and equipment n.e.c | ome | Manufacture of machinery and equipment n.e.c |
| Manufacturing n.e.c | omf | Manufacturing n.e.c |
| Construction | cns | Construction |
| Wholesale and retail trade | trd | Wholesale and retail trade |
| Other services (transport, water, dwellings) | wtr | Collection, purification and distribution of water |
| Other services (transport, water, dwellings) | otp | Land transport |
| Other services (transport, water, dwellings) | wtp | Water transport |
| Other services (transport, water, dwellings) | atp | Air transport |
| Other services (transport, water, dwellings) | dwe | Dwellings |
| Communications | cmn | Post and telecommunications |
| Financial services | ofi | Financial services |
| Insurance | isr | Insurance |
| Business services | obs | Business services |
| Personal services | ros | Personal, cultural, and recreational services |
| Public services | osg | Public services |
11. Annex B: derivation of modelling inputs
This annex outlines the methodology used to estimate the assumed reductions in non-tariff measures affecting trade in goods and regulatory restrictions affecting trade in services. These are then applied to the modelling as set out in section 3.2 (see Box 3.
11.1. Methodology
Tariff reductions are simulated both in the baseline of the modelling and in the modelled scenario. In the baseline of the modelling tariff shocks are applied between Japan and the UK. These are sourced from the tariff schedule of the EU-Japan EPA.[footnote 167]
For this assessment, stylised assumptions are made to represent a trading relationship between the UK and EU based on a hypothetical free trade agreement, with zero tariffs and average NTM costs, such as standard customs arrangements with the EU. These assumptions about the long-run relationship are required to establish a baseline for modelling new trade agreements, but do not represent government policy.
These assumptions about the long-run relationship are required to establish a baseline for modelling new trade agreements, but do not represent government policy.
11.2. Non-tariff measures (NTMs) and regulatory restrictions to services
NTMs and regulatory restrictions to services are policy measures that can influence trade by changing what can be traded, and at what price. These can increase the cost of trade and therefore reduce the amount that is traded, even though NTMs and regulatory restrictions to services can serve legitimate public policy objectives. Some NTMs and regulatory restrictions to services may also increase trade – for example, the enforcement of high product standards may increase consumer demand for some goods.
NTMs and regulatory restrictions to services can be hard to observe and are often wide-ranging, resulting in difficulties in estimating the cost they place on businesses.[footnote 168] There is a growing body of literature estimating how non-tariff measures affect trade (most commonly expressed in terms of tariff ad-valorem equivalents).[footnote 169] There are two main approaches to estimating the scale of non-tariff measures and regulatory restrictions to services affecting trade between partners in the literature: direct (observing how prices have changed because of barriers or FTAs) and indirect (inferring the impact of NTMs from distortions in the patterns of trade).[footnote 170]
This assessment uses the indirect approach. Building upon best practice in the literature, a gravity model[footnote 171] is used to provide estimates of the historic liberalisation of non-tariff measures that have been reduced by different types of free trade agreements (shallow, medium and deep). Combined with estimates of the level of non-tariff measures and regulatory restrictions to services that are faced when trading with each country, these provide country specific reductions in NTMs resulting from deep FTAs.
More specifically, trading costs of NTMs are modelled by extension of the gravity modelling in ECORYS (2009), CEPR (2012), and Egger et al (2015), meaning iceberg trade cost reductions. In the case of both goods and services, benchmark values for trade costs and for cost reductions are based on gravity-based estimates of the trade cost reductions realized under different types of FTAs, as classified by level of ambition. For this purpose, Professor Joseph Francois’ gravity model data includes a version of the DESTA database indicators of FTA depth.
12. Annex C: methodology and results for preliminary assessment of impacts on production in the regions and nations of the UK
12.1. Methodology
The modelling apportions the UK-wide GVA shocks from the CGE modelling to the NUTS-1 regions of the UK nations and regions.[footnote 172] Firstly, we take the sectoral shocks from the CGE modelling, set out in Table 8, and apply these to the GVA of the relevant sector in each region. The full impact in each region is derived by summing the impact on each sector in a nation or region to give the percentage change from the baseline level of GVA for each nation or region, as set out below:
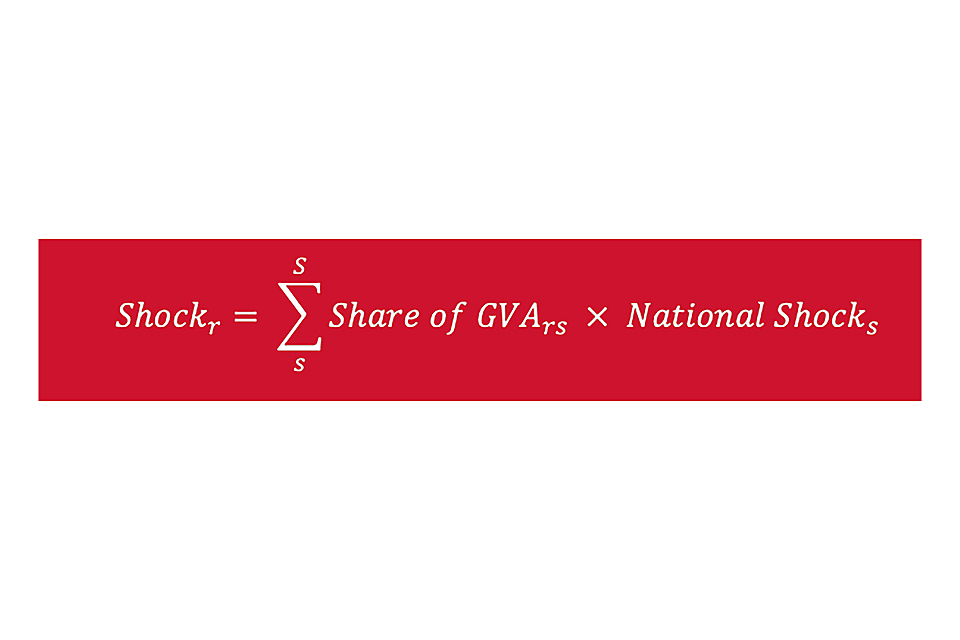
This equation shows the calculation for GVA shocks by region.
There is a risk that this approach underestimates the overall impact in each region because it does not account for second-round effects from a shock resulting from the concentration of, and UK regional specialisation in, different industries. To take this into account and to provide a sensitivity check, the model weights the shock using location quotients (see Box 1 for an explanation of how the location quotients are calculated). For each sector, the shock for each region is derived by multiplying the location quotient for that sector and region by the estimated impact for each sector in each region. The sectoral changes are constrained to ensure the overall change in a sector matches the sectoral change from the CGE results. For this method:
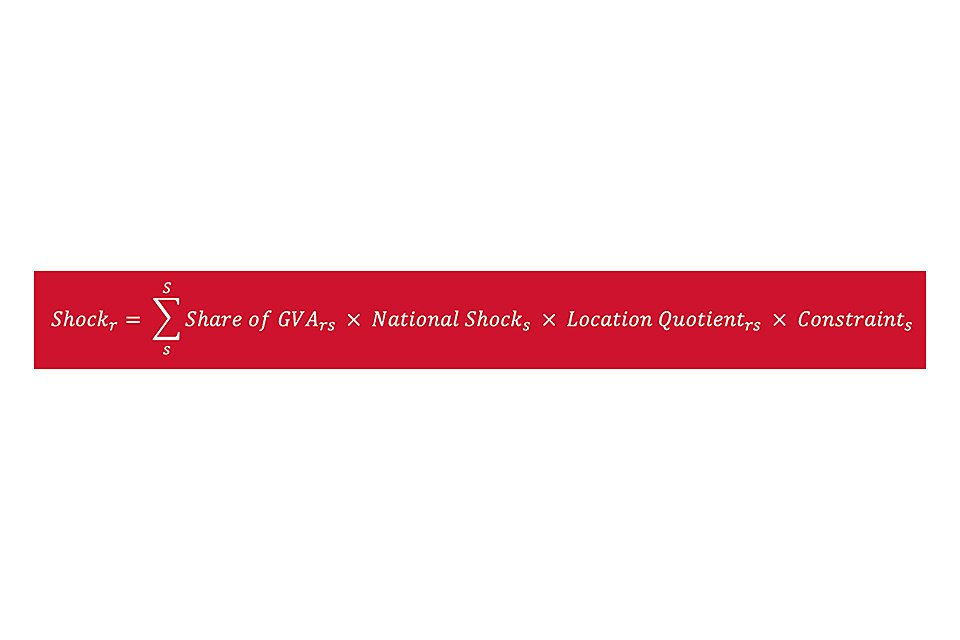
This equation weights the shocks using location quotients. This provides a sensitivity check.
where r stands for NUTS 1 region and s stands for sector.
The location quotient-weighted approach amplifies positive and negative UK regional results, but for most nations and regions the difference is small. In the modelled scenario the methods agree on which nations and regions are estimated to increase or decrease their output relative to the baseline. To acknowledge the uncertainty around the apportionment approach, the maps in Chart 14 use the mid-point of the two methods.
Table 19: specialisation of sectors across the 12 NUTS 1 regions of the UK
| Type | Sectors (27) | NE | NW | Y&H | EM | WM | East | London | SE | SW | Wales | Scotland | N. Ireland |
|---|---|---|---|---|---|---|---|---|---|---|---|---|---|
| Agri-Food | Agriculture | 0.61 | 0.65 | 1.15 | 1.12 | 1.14 | 1.33 | 0.03 | 0.93 | 1.40 | 2.07 | 2.03 | 2.32 |
| Agri-Food | Semi-processed foods | 0.56 | 1.06 | 2.09 | 1.98 | 1.47 | 1.14 | 0.16 | 0.17 | 1.57 | 1.59 | 0.90 | 4.63 |
| Agri-Food | Processed foods | 1.01 | 1.43 | 1.74 | 2.34 | 0.90 | 0.64 | 0.45 | 0.50 | 0.93 | 1.07 | 1.11 | 1.16 |
| Agri-Food | Beverages and tobacco products | 0.32 | 0.78 | 1.23 | 0.60 | 1.15 | 1.54 | 0.37 | 0.40 | 1.36 | 0.82 | 2.98 | 1.34 |
| Industries | Petroleum and coal products | 2.27 | 1.45 | 2.36 | 0.03 | 1.13 | 0.15 | 0.03 | 0.95 | 0.39 | 2.37 | 2.15 | 0.08 |
| Industries | Mining and extraction | 0.85 | 0.24 | 0.73 | 1.16 | 0.09 | 0.29 | 0.38 | 0.32 | 0.63 | 0.99 | 6.63 | 1.37 |
| Industries | Textiles, leather and wearing apparel | 1.58 | 1.49 | 1.32 | 3.28 | 0.91 | 0.41 | 0.46 | 0.35 | 0.54 | 0.64 | 1.48 | 1.06 |
| Industries | Other manufacturing | 0.81 | 1.27 | 1.35 | 1.92 | 1.57 | 0.95 | 0.23 | 0.64 | 1.22 | 0.90 | 1.11 | 1.92 |
| Industries | Paper and printing products | 0.81 | 0.98 | 1.22 | 1.09 | 0.65 | 1.29 | 1.32 | 0.94 | 0.80 | 0.94 | 0.54 | 0.65 |
| Industries | Chemical, rubber, plastic products | 1.83 | 1.57 | 1.37 | 1.66 | 1.22 | 0.96 | 0.16 | 0.84 | 0.83 | 1.29 | 0.81 | 1.55 |
| Industries | Metals | 1.70 | 1.25 | 1.43 | 1.13 | 1.75 | 1.02 | 0.23 | 0.73 | 0.85 | 2.03 | 0.71 | 0.93 |
| Industries | Motor vehicles and parts | 2.61 | 1.33 | 0.62 | 0.70 | 3.89 | 0.60 | 0.18 | 0.70 | 0.75 | 1.29 | 0.29 | 0.93 |
| Industries | Other transport equipment | 0.50 | 1.49 | 0.18 | 1.98 | 0.71 | 0.90 | 0.12 | 0.76 | 2.86 | 1.89 | 0.85 | 1.79 |
| Industries | Electronic equipment | 0.76 | 0.65 | 0.34 | 1.15 | 0.95 | 1.27 | 0.26 | 1.90 | 1.42 | 1.46 | 1.17 | 1.57 |
| Industries | Other machinery and equipment | 1.61 | 0.84 | 1.28 | 1.23 | 1.63 | 1.38 | 0.26 | 0.96 | 1.23 | 0.80 | 0.88 | 1.21 |
| Industries | Manufacturing n.e.c | 1.00 | 0.93 | 1.49 | 1.56 | 1.06 | 0.98 | 0.30 | 1.00 | 1.25 | 2.25 | 0.65 | 1.01 |
| Industries | Electricity and gas | 1.01 | 0.93 | 0.89 | 1.70 | 1.21 | 0.52 | 0.42 | 1.18 | 0.87 | 1.30 | 1.78 | 0.67 |
| Services | Other services (water, dwellings) | 0.77 | 1.08 | 1.08 | 1.00 | 1.24 | 1.09 | 0.97 | 1.13 | 0.79 | 0.63 | 0.83 | 0.61 |
| Services | Construction | 0.86 | 0.87 | 1.05 | 1.09 | 0.83 | 1.20 | 0.78 | 1.07 | 1.14 | 1.16 | 1.17 | 0.90 |
| Services | Wholesale and retail trade | 0.99 | 1.01 | 0.99 | 1.08 | 1.05 | 1.03 | 0.86 | 1.02 | 1.13 | 1.05 | 0.96 | 1.08 |
| Services | Transport services | 1.04 | 1.12 | 0.97 | 1.04 | 0.98 | 0.99 | 1.26 | 0.99 | 0.67 | 0.63 | 0.87 | 0.96 |
| Services | Communications | 1.53 | 1.02 | 0.74 | 0.42 | 0.75 | 1.07 | 1.04 | 1.46 | 0.78 | 0.69 | 1.17 | 0.70 |
| Services | Financial services | 0.61 | 0.85 | 0.87 | 0.46 | 0.65 | 0.65 | 2.23 | 0.71 | 1.01 | 0.50 | 0.91 | 0.71 |
| Services | Insurance | 0.41 | 0.78 | 0.36 | 0.12 | 0.90 | 0.84 | 1.24 | 1.63 | 0.93 | 1.80 | 1.25 | 0.45 |
| Services | Personal services | 0.89 | 0.81 | 0.86 | 0.84 | 0.90 | 0.98 | 1.39 | 0.99 | 0.85 | 0.85 | 1.13 | 0.77 |
| Services | Public services | 1.22 | 1.05 | 1.08 | 0.95 | 1.02 | 0.92 | 0.82 | 0.96 | 1.07 | 1.23 | 1.14 | 1.22 |
Source: Business Register and Employment Survey, 2016 (ONS, NISRA) and DIT calculations.
12.2. Results
Based on this approach, Chart 14 presents the estimated changes in UK national and regional Gross Value Added under the FTA scenario modelled, compared to the baseline. It shows there could be a small positive impact across all the regions of the UK from an FTA with Japan. London, the East Midlands and Scotland expand the most, while the North East, North West and West Midlands expand the least.
12.3. Limitations
The analysis requires several simplifying assumptions and is subject to limitations, for example, it:
- is based on sector results at an aggregate level, so will not fully reflect differences in patterns of production across nations and regions of the UK
- does not explicitly consider the varying trade patterns of individual sectors across each part of the UK
- uses employment location quotients to weight the apportionment of the national, sectoral GVA shock, which may not accurately reflect the structure of regional economies
- assumes the long-term structures of regional economies are consistent with employment location quotients calculated using 2016 Business Register Employment Survey data (ONS, NISRA)
- assumes that the sector GVA shock is the same for all regions i.e., the CGE model provides only a UK-wide sectoral shock
- does not give any insight into how regions adjust to a new long-term equilibrium position
- does not explicitly take account of any impacts arising from the Protocol on Ireland/Northern Ireland (to the Withdrawal Agreement)
The aim is to provide a high-level overview of potential UK regional impacts, using an intuitive analytical approach rather than precise point estimates or forecasts.
13. Annex D: methodology and results for preliminary assessment of potential impacts on businesses, including small and medium-sized enterprises (SMEs)
Free trade agreements can generate a range of opportunities and challenges for businesses. Benefits arise from increased trade liberalisation as firms gain greater market access to cheaper, and more varied, imported inputs. Small and micro/medium enterprises (SMEs) may benefit from increased trading opportunities but may also face increased competition from products sold by businesses from the partner country.
This annex sets out the methodology for providing an approximation of the potential scale of tariff savings for UK businesses on the imports of intermediate and final goods. The impacts on UK SMEs and one-off costs associated with familiarisation of the agreement are also discussed.
13.1. Calculating the scale of improved market access for businesses and cheaper production inputs owing to tariff liberalisation
13.1.1. Methodology
13.1.1.1. UK imports from Japan
The order of magnitude of potential tariff savings for businesses and consumers importing goods from Japan are calculated using trade flow data in 2017 and 2018 at the 8-digit product classification (HS2017) sourced from HMRC.
The HMRC data is aggregated into the UN’s ‘Broad Economic Categories’ via the conversion table developed by the UN. The BEC classification of goods is then assigned to the two basic kinds of domestic end-use categories as laid out in the System of National Accounts (SNA), namely – intermediate or final goods.[footnote 173]
Before aggregation, the trade data is matched to corresponding data for applied tariffs in 2018 in the United Kingdom from the MacMaps database.
The initial scale of tariff liberalisation is calculated by multiplying the 2-year average import values over 2017 and 2018 with the corresponding EU common external tariffs. In line with the assumptions set out for the modelling above – that the UK and Japan eliminates import tariffs in line with the EU-Japan EPA– this presents a simplified estimate of the total potential tariff liberalisation from the agreement.
Upper and lower estimates are provided. To calculate the upper estimate, we multiply the estimated level of tariff reductions by the percentage of trade that entered the UK from Japan as “MFN Non-Zero” (thereby paying some tariff). This includes trade that is not required to pay the full MFN tariff rate. For example; tariff rate quotas that the UK offers to non-EU countries through the WTO; duty relief that is granted for goods traded under inward and outward processing rules; and suspended duties under international agreements. This percentage is estimated from 2017-2018 trade flow data[footnote 174] from the EU Comext Database.[footnote 175]
To calculate the lower estimate, we multiply the figure calculated in the step above by the percentage of MFN Non-Zero trade that claimed no duty relief for inward or outward processing (2017 and 2018 average from EU Comext).[footnote 176] Due to lack of data, this assumes 100% duty relief for trade claiming duty relief. The final estimated results are aggregated to a single figure.
It is important to note that reductions in tariff costs facing importers also reflect an equivalent reduction in government tariff revenues on these products, which may be offset by increased tax revenues from higher economic activity in the UK.
13.1.1.2. UK exports to Japan
The order of magnitude of potential tariff savings for businesses exporting goods to Japan are calculated using trade data from ITC TradeMap for the year’s 2017-2018 at the 8-digit product classification (HS2017).[footnote 177] The TradeMap data is aggregated into the UN’s ‘Broad Economic Categories’ via the conversion table developed by the UN. The BEC classification of goods is then assigned to the two basic kinds of domestic end-use categories as laid out in the System of National Accounts (SNA), namely – intermediate or final consumption goods.[footnote 178] Before aggregation, the trade data is matched to corresponding data for applied tariffs in 2018 in Japan which are downloaded from the MacMaps database.
The initial scale of tariff liberalisation is calculated by multiplying the average import values over the period with the corresponding tariffs.
13.1.2. Limitations
Following a similar approach widely applied in the literature, the calculations aim to provide an indication of the magnitude of direct savings owing to tariff liberalisation.[footnote 179] They are subject to a number of limitations:
- They are based upon current trade patterns and do not take into account the likely changes in trade patterns resulting from the price changes. Therefore, these estimates may understate the gains to UK businesses and consumers from reduced tariffs if trade were estimated to increase after price effects
- The analysis is based on the EU’s Common External Tariff (CET) and does not take into account any future changes to the UK’s MFN tariff levels
- The proportion of the savings passed through to consumers is not known, some businesses may consume final goods or not fully adjust the prices of their products/services to UK consumers
13.2. Impact on small and medium sized enterprises (SMEs)
SMEs may be defined as:
- firms employing fewer than 50, and fewer than 250 employees respectively
- firms not exceeding either (a) £44 million in annual turnover or (b) an annual balance-sheet total of £38 million
SMEs represent a key component of the UK economy: in 2018 these made up over 99% of the total number of private sector businesses, representing 60% of private sector employment and 52% of private sector turnover.[footnote 180] UK SMEs play an integral role in engaging with the international economy. SMEs are increasingly international traders in their own right. For example, in 2018, 97% of businesses exporting goods were SMEs, representing 28% of the UK’s total exports.[footnote 181] Moreover, SMEs form a key part of the supply chain for larger UK and global firms, by producing intermediate goods used to manufacture other goods.
SMEs typically face larger impacts from trade barriers than larger firms, since larger firms are better able to leverage influence or exploit economies of scale to reduce the associated costs and risks of internationalisation. This is particularly the case where trade barriers represent fixed costs to businesses, as regulatory and non-tariff measures can be burdensome to comply with.
This section considers the variation of SMEs across sectors of the economy in order to compare with the estimated pattern of impacts across sectors set out in Table 4.
13.2.1. Methodology
The CGE model presents the indicative impact on each of the 23 sectors of the model, as identified in Table 7 in the main results section.
The BEIS Business Population Estimates (BPE) show that the concentration of SMEs varies markedly across sectors of the economy.[footnote 182] The BPE data – classified according to the Standard Industrial Classifications (SIC) – are mapped to the sectors included in the modelling.
Table 20: SMEs in the profile of UK businesses
| Business size (# of employees) | No. of businesses | % of total businesses | Employment contribution (number of employees) | % of Employee contribution | Turnover contribution (£ million) | % Turnover contribution |
|---|---|---|---|---|---|---|
| None | 4,278,225 | 75.5% | 4,643,000 | 17.1% | 274,917 | 7.2% |
| 1 to 49 | 1,346,940 | 23.8% | 8,242,000 | 30.5% | 1,123,586 | 29.1% |
| 50 to 249 | 34,835 | 0.6% | 3,399,000 | 12.6% | 595,003 | 15.3% |
| > 249 | 7,510 | 0.2% | 10,743,000 | 39.7% | 1,868,106 | 48.4% |
| Total | 5,667,510 | 100.0% | 27,027,000 | 100.0% | 3,861,612 | 100.0% |
Source: BEIS Business Population Estimates (2018)
Table 21: SMEs across sectors by number and turnover
| GTAP sector | Sectoral distribution of SMEs | SMEs turnover by sector (£ million) | Micro/small | Medium | Large |
|---|---|---|---|---|---|
| Agriculture | 2.78% | 38,196.4 | 81.50% | 9.00% | 9.50% |
| Beverages and tobacco products | 0.27% | 9,861.8 | 15.82% | 18.12% | 66.07% |
| Processed foods | 0.40% | 29,585.3 | 15.82% | 18.12% | 66.07% |
| Semi-processed foods | 0.81% | 14,792.7 | 15.82% | 18.12% | 66.07% |
| Chemical, rubber, plastic products | 0.40% | 14,792.7 | 15.82% | 18.12% | 66.07% |
| Electronic equipment | 0.50% | 4,930.9 | 15.82% | 18.12% | 66.07% |
| Energy | 0.13% | 28,325.1 | 14.14% | 9.13% | 76.73% |
| Manufacture of materials | 0.13% | 19,723.6 | 15.82% | 18.12% | 66.07% |
| Motor vehicles and parts | 0.94% | 4,930.9 | 15.82% | 18.12% | 66.07% |
| Other machinery and equipment | 0.40% | 34,516.2 | 15.82% | 18.12% | 66.07% |
| Other manufacturing | 0.54% | 9,861.8 | 15.82% | 18.12% | 66.07% |
| Other transport equipment | 0.27% | 14,792.7 | 15.82% | 18.12% | 66.07% |
| Paper and printing products | 1.34% | 29,480.9 | 24.48% | 16.61% | 58.91% |
| Textiles, leather, and wearing apparel | 0.40% | 14,792.7 | 15.82% | 18.12% | 66.07% |
| Business services | 22.39% | 378,980.3 | 44.65% | 16.38% | 38.97% |
| Communications | 1.07% | 19,619.1 | 30.37% | 15.58% | 54.05% |
| Construction | 17.50% | 238,945.7 | 62.10% | 13.00% | 24.90% |
| Financial services | 1.02% | - | - | - | - |
| Insurance | 0.51% | - | - | - | - |
| Other services (water, dwellings) | 8.62% | 154,104.0 | 36.53% | 13.93% | 49.54% |
| Personal services | 8.97% | 79,056.7 | 28.17% | 10.66% | 61.16% |
| Public services | 15.57% | 128,310.3 | 44.66% | 14.70% | 40.64% |
| Wholesale and retail trade | 15.04% | 723,604.3 | 35.07% | 16.31% | 48.62% |
Source: DIT Internal Analysis of BEIS Business Population Estimates (2018), no turnover data available for Financial and Insurance sectors.
SMEs are present in all sectors of the economy, but four sectors - construction, business services, public services, and retail and wholesale trades – are estimated to make up over two-thirds of the total number of UK SMEs (see Table 21 ).
The data on sectors where SMEs are located above are combined with the sectors where output is expected to increase or decrease relative to the baseline, as set out in Table 7 of the main report.
13.2.2. Results
Overall, sectoral impacts from the CGE model suggest that most sectors are estimated to expand (as measured by GVA). This suggests that the positive gains from the FTA will be distributed across the economy, including across all types of UK firms (note that turnover data is not available for financial services or insurance sectors) and would not exert a disproportionate impact on SMEs. Under the modelled scenario, micro, small and medium businesses account for around 53% of total UK business turnover across all expanding sectors relative to the baseline, in line with the general business population. Micro, small and medium businesses account for 34% of total turnover in sectors where output is expected to fall relative to the baseline, less than in the general business population (see Chart 16 below).
Chart 16: distribution of impacts by firm-size[footnote 183]
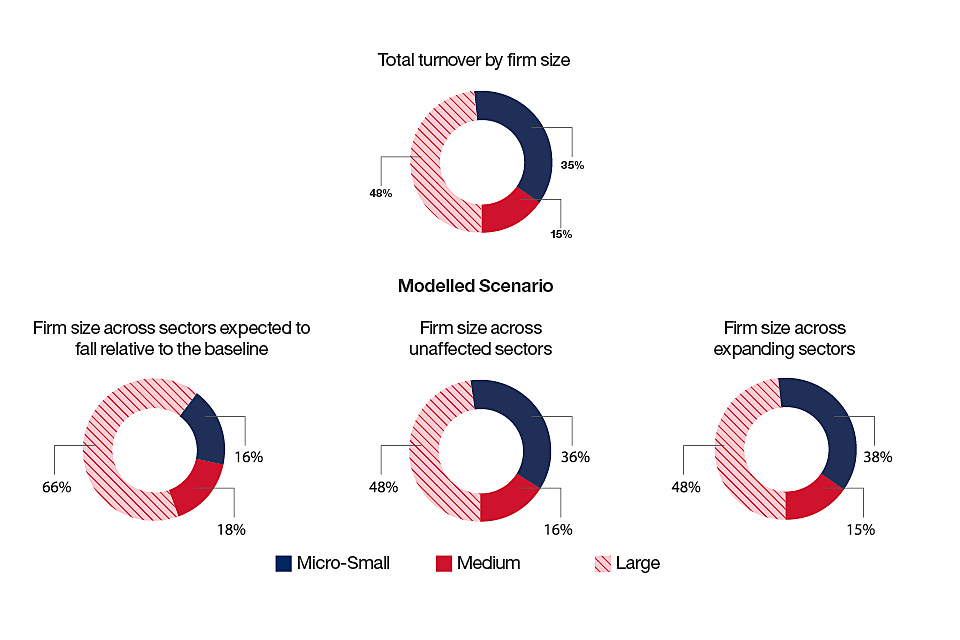
Chart 16 shows the distribution of impacts by firm size. It shows gains from the FTA will be distributed across all types of firms.
Source: DIT Analysis. Calculations based on BEIS BPE 2018 turnover data. Note that data is unavailable for financial services or insurance sectors.
13.2.3. Limitations
The aim of the analysis is to provide an indication of whether the potential implications of long-run changes to the sectoral composition of output are likely to exert a disproportionate impact on SMEs.
The preliminary analysis is in line with best practice in this area but requires several simplifying assumptions and is subject to several limitations:
- this approach does not take into account whether SMEs may be more or less affected by changes in trade barriers than other businesses, for example for reasons set out above
- mapping the Standard Industrial Classifications to the sector aggregations used in the GTAP modelling requires several simplifying assumptions which could result in biases in the estimated distribution of SMEs across GTAP sectors
- BEIS BPE data captures data on unregistered and sole traders, however it does not allow for disaggregation between small and micro businesses and there is no available turnover data for finance or insurance sectors
13.3. Business administration costs for goods trade
There are administration costs incurred by businesses associated with trading internationally. For example, for goods trade there may be administration costs associated with meeting the requirements of border procedures. In the UK, businesses exporting outside of the EU must acquire appropriate licenses and certification and make customs declarations to HMRC through the National Export System (NES).
FTAs have the potential to affect the administration procedures facing businesses trading internationally. Some provisions, such as those which streamline customs and border procedures, can reduce the administration costs. Other aspects of trade agreements may give rise to increases in business administration costs which should be weighed against the overall benefits of the agreement.
Businesses have the option to choose whether to trade with a partner under a new FTA or the current WTO MFN trading terms. Therefore, there is no net cost to businesses for those who do not wish to trade under a new FTA. Below are two broad areas where choosing to trade under an FTA has the potential to increase business administration costs.
Potential changes to rules of origin requirements
FTAs provide an opportunity for members to liberalise tariffs on a preferential basis. In order to ensure that only members of an FTA can benefit from these preferential trade arrangements, the parties to the FTA need to agree a set of rules of origin to determine which goods imported from a partner country can qualify for preferential tariff treatment under the agreement. However, implementing, administering and complying with rules of origin can generate costs for businesses. For example, businesses can submit rules of origin forms to HMRC to process free of charge.
There are a wide range of product-specific rules used to determine whether goods have been substantially produced or transformed within the FTA countries and thereby qualify as originating under an FTA. It is therefore not possible to provide a preliminary assessment of the impact of the FTA on the costs associated with rules of origin at this stage as the implied changes to rules of origin are not yet known.
One-off familiarisation costs
There are costs associated with business becoming familiar with the agreement. Whilst there is data on the number of businesses that trade in goods there is limited data on the number of businesses that trade in services. In addition, one would hope that access to preferences under an agreement would encourage further businesses to begin trading with Japan. It is therefore not possible to comprehensively estimate the one-off familiarisation cost to businesses trading in goods and service.
The one-off familiarisation cost could affect around 9,511 VAT registered businesses that exported goods to Japan in 2018 and 6,703 VAT registered businesses that imported goods from Japan in 2018.[footnote 184] As mentioned above, data is not available on the number of businesses that trade in all service sectors. However for context, of all UK exports to Japan in 2018, £7.0 billion (49%) were goods and £7.3 billion (51%) were services. In addition, of all UK imports from Japan in 2018 £9.9 billion (65%) were goods and £5.3 billion (35%) were services.
Annex E: methodology and results for preliminary assessment of potential impacts of various groups in the labour market
This annex assesses the implications of the agreement for various groups in the labour market including gender, ethnicity, disability and age.[footnote 185]
The international evidence suggest that trade agreements and trade liberalisation have the potential to affect various sectors of the economy and groups differently.[footnote 186] This is because consumption patterns and employment patterns can differ systematically across groups.
14.1. Methodology
The CGE modelling assumes that a renegotiated UK-Japan trade agreement would not impact on overall UK employment compared to not having a trade agreement l with Japan. However, the model presents indicative impacts on the number of jobs located within each of the 23 sectors of the model. For the purposes of estimating potential impacts on groups in the labour market, we only include sectors in which employment changes by more than +/- 0.05%. The analysis shows the proportion of the workforce in each sector that come from particular groups. The analysis does not infer changes in employment for each group nor other work-related impacts such as whether these groups see a change in pay or productivity.
Table 22 presents data from the Annual Population Survey showing estimates of the proportions of those employed in each of the 23 sectors with various characteristics.[footnote 187]
Table 22: proportion of employment by sector and protected characteristics[footnote 188]
| GTAP Sector (23 Disaggregation) | Women | Disabled | Ethnic minorities | Age (16-24) | Age (65+) |
|---|---|---|---|---|---|
| Agriculture, forestry, and fishing | 27.4% | 15.6% | 1.4% | 10.0% | 18.2% |
| Semi-processed foods | 28.4% | 7.6% | 9.5% | 8.2% | 2.1% |
| Other processed foods | 38.0% | 11.6% | 13.8% | 9.7% | 1.5% |
| Beverages and tobacco products | 26.0% | 9.8% | 5.8% | 7.8% | 1.5% |
| Energy | 21.2% | 8.8% | 7.0% | 8.2% | 2.6% |
| Textiles, apparel, and leather | 52.0% | 11.8% | 15.6% | 9.7% | 3.8% |
| Manufactures | 16.6% | 10.6% | 4.6% | 10.2% | 4.4% |
| Paper and printing products | 35.8% | 11.5% | 9.0% | 7.5% | 4.0% |
| Chemical, rubber, plastic products | 31.6% | 9.6% | 8.1% | 8.5% | 2.5% |
| Manufacture of motor vehicles | 16.0% | 10.4% | 8.4% | 9.6% | 2.2% |
| Manufacture of other transport equipment | 14.4% | 9.6% | 5.5% | 10.5% | 2.5% |
| Manufacture of electronic equipment | 27.2% | 8.6% | 10.5% | 8.4% | 3.0% |
| Manufacture of machinery and equipment n.e.c | 19.0% | 10.9% | 6.5% | 8.2% | 3.2% |
| Manufacturing n.e.c | 31.9% | 12.9% | 6.1% | 8.8% | 4.0% |
| Other services (transport, water, dwellings) | 26.3% | 12.5% | 15.9% | 7.7% | 4.2% |
| Construction | 12.2% | 10.2% | 5.4% | 10.4% | 3.6% |
| Wholesale and retail trade | 48.5% | 13.2% | 14.1% | 24.6% | 3.4% |
| Communications | 26.6% | 10.3% | 14.2% | 7.8% | 1.2% |
| Financial services | 43.3% | 8.9% | 15.7% | 8.2% | 2.1% |
| Insurance | 46.5% | 10.4% | 9.0% | 11.6% | 1.6% |
| Business services | 39.6% | 11.1% | 12.9% | 9.0% | 4.7% |
| Personal services | 55.2% | 12.8% | 8.4% | 19.1% | 4.9% |
| Public services | 68.7% | 13.4% | 11.8% | 7.7% | 3.3% |
| Total | 46.9% | 12.2% | 11.6% | 12.1% | 3.7% |
Source: ONS 3-year Annual Population Survey (Mapped using an internal DIT GTAP-SIC mapping)
The estimated employment changes in various sectors are combined with the data from the Labour Force Survey to consider the characteristics of the workforce within sectors where employment may decline or expand relative to the baseline over the long run. The results focus on whether the protected groups are proportionally concentrated in sectors where employment is estimated to fall relative to the baseline to see whether such groups are more or less likely to work in sectors that reduce the size of their workforce. This does not imply other work-related impacts such as changes in wage.
14.2. Descriptive statistics
14.2.1. Gender
Based upon DIT’s analysis of the Annual Population Survey (2015-17), 47% of those in either full-time or part-time employment in the UK are female and 53% are male.
The preliminary analysis shows that the proportion of workers that are female in sectors where output is expected to fall relative to the baseline is 25%, less than the proportion of females in the total workforce. Therefore, female workers are less concentrated in sectors that are expected to reduce the size of their workforce.
Chart 17: gender breakdown for the labour market as a whole and for the contracting sectors
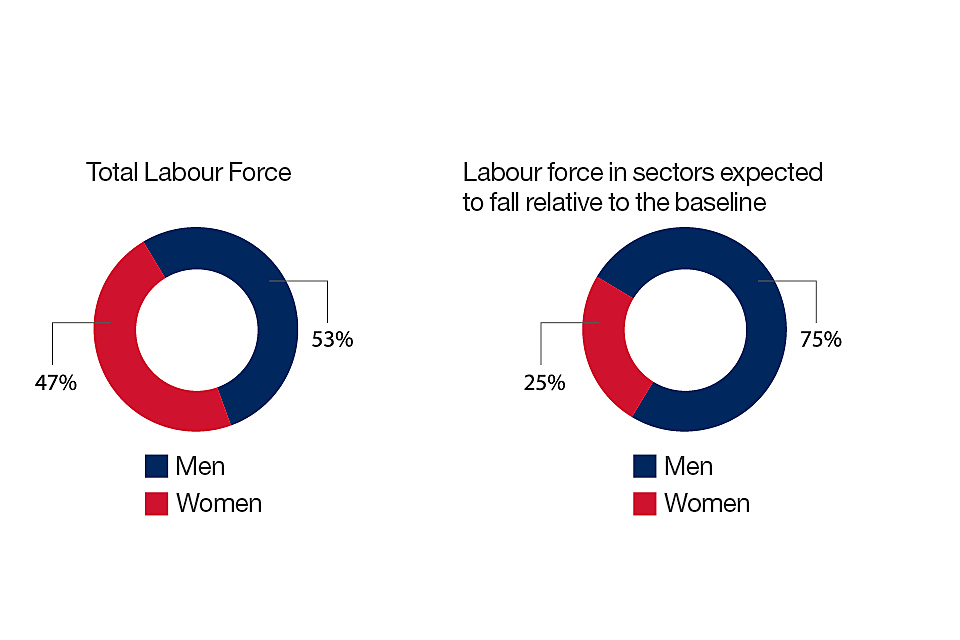
Chart 17 shows that the proportion of female workers in sectors where output is estimated to fall relative to the baseline is less than for the total workforce.
Source: DIT internal analysis using Annual Population Survey
14.2.2. Ethnicity
Based upon DIT’s analysis of the Annual Population Survey, around 12% of those in employment in the UK are from an ethnic minority background and around 88% are white.
The preliminary analysis suggests that the proportion of workers in sectors where employment is estimated to fall relative to the baseline which are from an ethnic minority background is broadly 13%, which is in line with the 12% of ethnic minority workers that make up the total workforce.
Chart 18: ethnicity breakdown for the labour market as a whole and for the contracting sectors
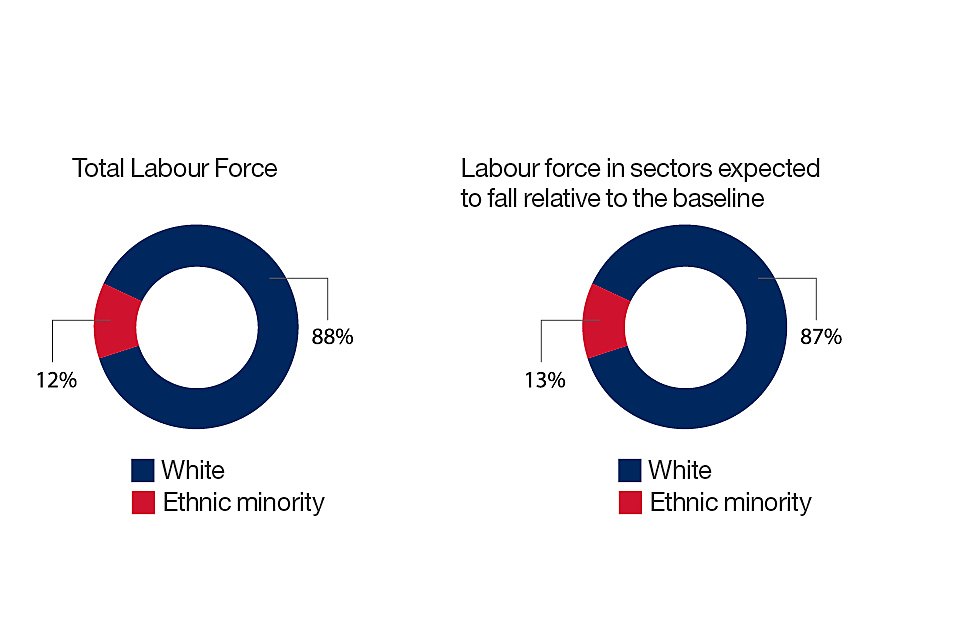
Chart 18 shows that the overall proportion of workers from an ethnic minority is in line with that of sectors estimated to fall relative to the baseline.
Source: DIT internal analysis using Annual Population Survey
14.2.3. Age
Based upon DIT’s analysis of the Annual Population Survey, around 12% of those in employment in the UK are aged between 16-24, 84% are aged between 25 and 64 and 4% are 65+.
The preliminary analysis suggests that the proportion of 16-24 year old workers who are concentrated in sectors where employment is estimated to fall relative to the baseline is in line with the proportion who make up the total workforce, standing at 8% compared to 12% in the wider population.
Workers aged 65 and over are estimated to make up 4% of the workforce in sectors where employment is estimated to fall relative to the baseline, which is in line with the 4% of this age group who make up the total workforce.
Chart 19: age breakdown for the labour market as a whole and for the contracting sectors
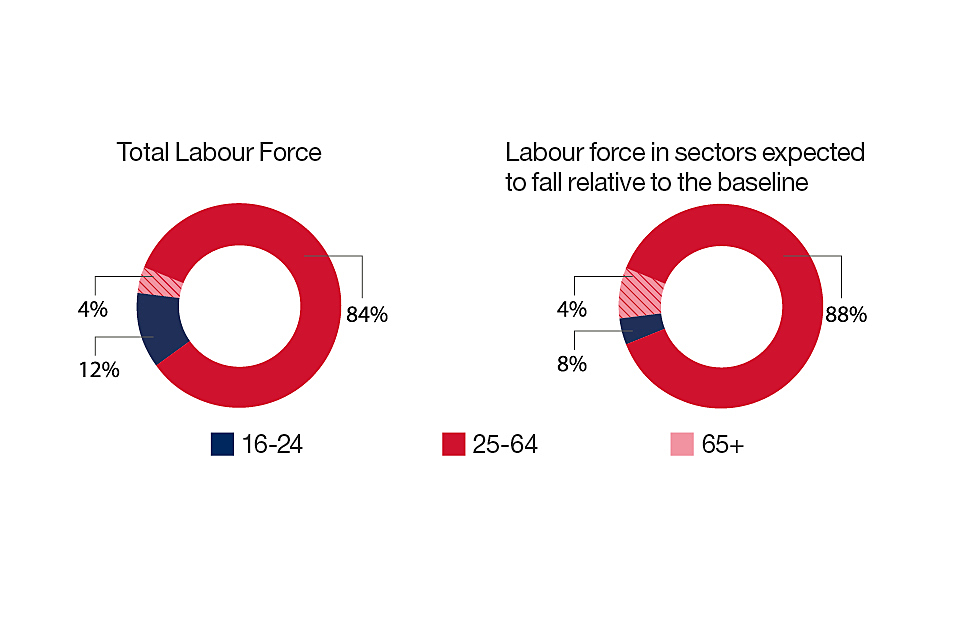
Chart 19 shows that the overall proportion of workers aged 16-24 and 65+ is in line with that of sectors estimated to fall relative to the baseline.
Source: DIT internal analysis using Annual Population Survey
14.2.4. Disability
Based upon DIT’s analysis of the Annual Population Survey, around 12% of those in employment in the UK report that they have a disability (as defined by the Equalities Act 2010). It is possible that non-response to this question in the Annual Population Survey affects the estimated proportion.
The preliminary analysis suggests that the proportion of workers in sectors where employment is estimated to fall relative to the baseline which have a disability is roughly in line with the proportion of the workforce; estimated to be 12%.
Chart 20: disability breakdown for the labour market as a whole and for sectors where employment is estimated to fall relative to the baseline
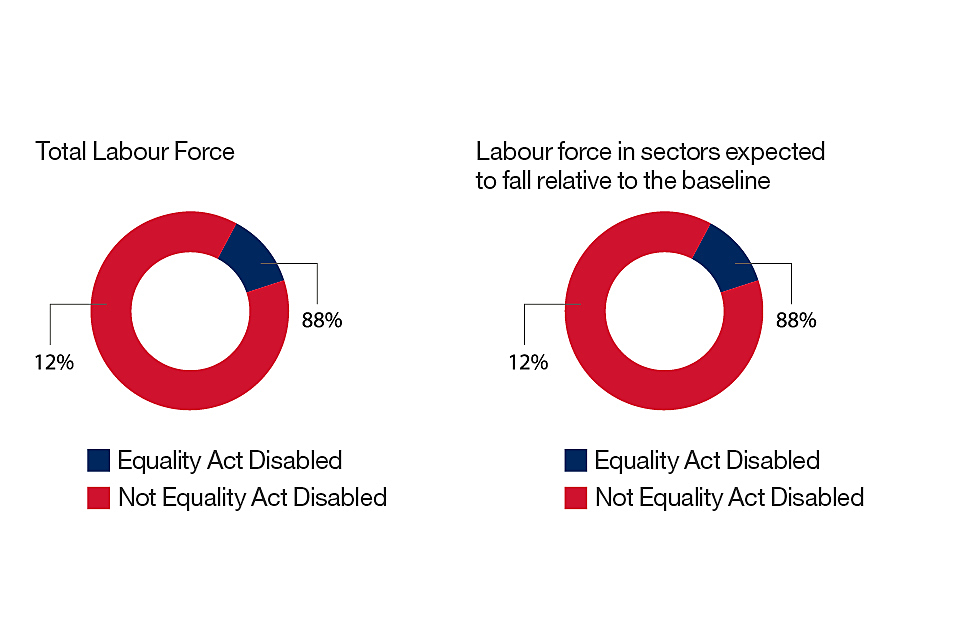
Chart 20 shows that the overall proportion of workers with a disability is in line with that of sectors estimated to fall relative to the baseline.
Source: DIT internal analysis using Annual Population Survey
14.3. Limitations
The aim of the analysis is to provide an indication of the potential implications of long-run changes in employment in various sectors for various groups. This provides a preliminary assessment as to whether the labour market impacts of the agreement may result in a disproportionate impact on specific groups.
The analysis is in line with international best practice in this area but requires several simplifying assumptions and is subject to several limitations.
The data from the Annual Population Survey only allows descriptive analysis of where groups are employed in the economy, not inferential analysis of how groups or employers will respond to sectoral shocks. The analysis therefore cannot make inference about how groups will be impacted.
The analysis uses the available data sources to describe the characteristics of workers in sectors which may increase or decrease their employment relative to the baseline under an agreement. It does not assess the welfare impacts of the trade agreements on various groups.
Mapping the employment data which is recorded in the Annual Population Survey by Standard Industrial Classifications to the sector aggregations used in the GTAP modelling requires several simplifying assumptions which could result in biases in the estimated distribution of employment across GTAP sectors.
The proportions estimated here are based on a snapshot of the demographics. By only using the years available in the APS, the analysis does not take into account trends that may be present in the proportions.
There is a potential problem of missing data in the APS. Employees in some groups, such as those with a disability, may be less likely to respond to the survey meaning that the data collected is not representative of the true employee demographics.
The analysis is based on the structure of the UK workforce from 2015-17.[footnote 189] Whereas the CGE modelling results reflect the global economy in the long run when the composition of the workforce may have changed.
15. Annex F: methodology and results for preliminary assessment of impacts on UK CO2 emissions, transport emissions and U.K agricultural land use.
This annex provides a preliminary, partial assessment of the potential implications of the changes in sectoral output and transport emissions from the modelling exercise outlined in Table 7 for CO2 emissions and wider environmental impacts in the UK.
15.1. Methodology
15.1.1. Emissions intensity by sector
Table 23 uses data from the 2011 GTAP database to show the estimated changes in output for the five highest and lowest emission intensity sectors.
Table 23: emissions intensity by sector
| Highest emission intensive sectors | Output change (GVA increase) |
|---|---|
| Beverages and tobacco products | 0.05 to <0.5% |
| Chemical, rubber and plastic products | Below -0.5% |
| Energy | 0.05 to <0.5% |
| Manufactures of materials | 0.05 to <0.5% |
| Other services (transport, water, dwellings) | 0.05 to <0.5% |
| Lowest emission intensive sectors | Output change (GVA increase) |
|---|---|
| Communications | 0.05 to <0.5% |
| Financial services | 0.05 to <0.5% |
| Insurance | 0.05 to <0.5% |
| Personal services | 0.05 to <0.5% |
| Public services | -0.05 to <0.05% |
Source: DIT analysis, GTAP 9 database.
15.1.2. Bilateral transport emissions
Table 24 presents £ per kg ratios and modal shares of goods trade between the UK and Japan, by weight of trade, for the GTAP sectors used in the CGE modelling above. It shows that over 96% of UK goods exported to Japan travel by sea, while over 97% of imports from Japan also travel by sea freight. However, there are considerable differences across sectors.
Table 24: UK exports to and imports from Japan, sectoral £ per kg ratios and modal shares, by trade weight
| Sector | % of total exports | £ per kg: | Sea | Air | % of total imports | £ per kg: | Sea | Air |
|---|---|---|---|---|---|---|---|---|
| Agriculture, forestry, and fishing | 1.2% | 5.8 | 85.0% | 15.0% | 0.0% | 10.7 | 83.8%. | 16.2% |
| Semi-processed foods | 0.9% | 1.6 | 98.7% | 1.3% | 0.1% | 6.2 | 94.2% | 5.8% |
| Other processed foods | 3.3% | 3.9 | 96.3% | 3.7% | 0.7% | 3.0 | 98.1% | 1.9% |
| Beverages and tobacco products | 24.5% | 1.6 | 99.7% | 0.3% | 0.2%. | 4.0 | 97.5% | 2.5% |
| Energy | 5.3% | 0.2 | 99.4% | 0.6% | 45.3% | 0.3 | 100.0% | 0.0% |
| Textiles, apparel, and leather | 0.9% | 37.1 | 68.6% | 31.4% | 0.7% | 8.3 | 93.8% | 6.2% |
| Manufactures | 13.8% | 8.4 | 97.1% | 2.9% | 9.6% | 15.2 | 98.6% | 1.4% |
| Paper and printing products | 6.8% | 2.1 | 95.1% | 4.9% | 0.1% | 10.6 | 83.0% | 17.0% |
| Chemical, rubber, plastic products | 20.3% | 13.7 | 96.4% | 3.6% | 6.5% | 13.2 | 96.1% | 3.9% |
| Manufacture of motor vehicles | 13.1% | 18.2 | 97.5% | 2.5% | 20.4% | 9.4 | 97.5% | 2.5% |
| Manufacture of other transport equipment | 0.9% | 215.7 | 72.7% | 27.3% | 1.4% | 109.4 | 90.3% | 9.7% |
| Manufacture of electronic equipment | 0.2% | 154.0 | 34.4% | 65.6% | 0.5% | 85.9 | 37.6% | 62.4% |
| Manufacture of machinery and equipment n.e.c | 8.5% | 32.4 | 88.8% | 11.2% | 14.3% | 14.6 | 92.9% | 7.1% |
| Manufacturing n.e.c | 0.2% | 114.7 | 70.0% | 30.0% | 0.3% | 32.7 | 78.0% | 22.0% |
| Weighted Average | - | 12.7 | 96.1% | 3.9% | - | 8.6 | 97.7% | 2.3% |
Source data: HMRC Overseas Trade statistics 2017-18 Data downloads: release period February 2019. Note, UK-Japan trade that has been recorded as travelling by road or rail has been omitted from the table and calculations. In 2017/18, this accounted for 0.086% of UK-Japan trade by weight.
15.1.3. Agricultural land use
Changes to the output of the UK agriculture sector may have implications for agricultural land use in the UK. Increases in agricultural land use are expected to negatively impact other environmental variables, such as biodiversity.
Table 25 sets out UK land use as recorded in the GTAP database.
Table 25: UK Land Use
| Land use | Million hectares |
|---|---|
| Agricultural: Cropland | 7.05 |
| Agricultural: Pasture | 9.94 |
| Forest | 5.01 |
| Built-up land | 0.81 |
Source: GTAP 9 Database.
15.2. Results
15.2.1. Greenhouse gas emissions and energy use
DIT’s analysis suggests that changes in the UK’s production and global trading patterns could favour UK sectors which are currently more emission intensive, driven by the modelled expansion of the emission-intensive ‘energy’, ‘other services (transport, water and dwellings)’ and ‘manufacturers’ sectors.
15.2.2. Total transport emissions
Different modes of transport vary greatly in their carbon intensity. For example, one kilogram of cargo flown on a plane generates approximately 100 times the emissions of a kilogram of cargo transported by ship (over the same distance).[footnote 190]
The type of good being exported, and particularly whether or not it is perishable, will determine the mode of transport used. The location of the export destination, and particularly the proximity to an airport, seaport or rail network will also have an influence. Therefore, even if an FTA results in goods being transported across greater distances, we cannot state the extent to which carbon emissions will be affected. These effects will primarily result from goods trade. Modern FTAs are increasingly focussed on removing regulatory restrictions to services trade, a UK strength, where transport costs are less important.
The environmental effects of increased services trade are particularly difficult to quantify, as not all commercial transactions are recorded as they cross the border. For example, the movement of persons associated with services trade is captured in business travel statistics, but these records are not industry-specific and thus difficult to attribute to increases or decreases in specific service sectors. It is nonetheless recognised that services that involve the movement of persons will have a different environmental footprint than services that do not. Many cross-border services would likely be those without a physical component, such as IT services. These types of services would be less likely to have negative environmental impacts.
15.2.3. Bilateral transport emissions
The following analysis only considers the impact of transport emissions from bilateral trade and doesn’t account for changed trading patterns with other countries resulting from the UK-Japan FTA (e.g. trade diversion away from competitors). Table 26 sets out the estimated changes in total trade between Japan and the U.K. It is estimated that the total weight of trade would increase. There are two explanatory factors; firstly, scaling impacts mean that assuming no change in the sectoral proportions of goods traded, an increase in the value of trade would lead to a 1:1 increase in the weight of trade. Secondly expanding trade in sectors with high ‘£ per kg’ such as manufacture of motor vehicles and manufacture of machinery and equipment explain why the estimated increase in weight of trade is lower than the estimated increase in value of trade. Assuming no change in the modal proportions of goods traded, increases in the weight of trade would be expected to lead to an equivalent increase in transport emissions, however sectoral shifts may contribute to greater emissions by increasing the proportion of trade that is transported by air.
Table 26: estimated changes in bilateral trade and modal proportions
| Scenario | % change in value | % change in weight | Proportion travelling by ship | Proportion travelling by air |
|---|---|---|---|---|
| Baseline | n/a | n/a | 97.3% | 2.7% |
| Scenario | 63.9% | 52.2% | 96.7% | 3.3% |
Source data: DIT Analysis, HMRC Overseas Trade statistics 2017-18 Data downloads: release period February 2019. Note, UK-Japan trade that has been recorded as travelling by road or rail has been omitted from the table and calculations. In 2017/18, this accounted for 0.03% of UK-Japan trade by volume.
15.2.4. Approximation of impacts on agricultural land use in the UK
Agricultural sectors are estimated to increase in the UK under the modelled scenario. Increased agricultural production could increase the intensive use of chemical inputs and increase threats to biodiversity.
15.3. Limitations
The preliminary assessment requires a number of simplifying assumptions and does not assess the full environmental impacts of the agreement. For example, the analysis:
- uses data on emissions and land use from the GTAP 10 database
- assumes that the emissions-intensity of sectors remains unchanged by any regulatory or technological developments
- assumes that the value to volume ratio of goods sectors remains unchanged
- does not consider the impact of environmental provisions within an agreement
- does not consider the impact of the agreement on a range of relevant environmental indicators
The aim is to provide a high-level overview of potential environmental impacts. The estimated environmental impacts will depend on the eventual sectoral distribution of GVA changes as well as the impacts of any environmental provisions included.
Due to the limitations above, the results should not be interpreted as a comprehensive assessment of the environmental impacts of the agreement.
-
UNCTAD: Gross Domestic Product ↩
-
This ranking is based on the main FDI release which does not have a detailed list for all countries: ONS FDI Main Release and JETRO: Japanese External Trade Organization, FDI stock (Based on International Investment Position, net) ↩
-
ONS, UK total trade: all countries, non-seasonally adjusted. 2018 data. ↩
-
DIT Internal Analysis. Based on external CGE analysis compared to 2018 levels. ↩
-
HMRC, UK Trade in Goods by Business Classification, 2018 data. ↩
-
Estimated duty savings are based on the difference between the MFN tariff level and the remaining tariff levels under the EU-Japan EPA in 2033. ↩
-
IMF World Economic Outlook, October 2019. ↩
-
ONS, UK total trade: all countries, non-seasonally adjusted. 2018 data. ↩
-
DIT internal analysis. Based on external CGE analysis. and compared to 2018 levels. ↩
-
DIT internal analysis. Based on external CGE analysis and compared to 2018 levels. ↩
-
For the purposes of this analysis, the MFN rates assumed are those that are currently applied by the UK. Estimated duty savings are based on the difference between the MFN tariff level (based on the EU common external tariff) and the remaining tariff levels under the EU-Japan EPA in 2033. ↩
-
United Nations, Classification by Broad Economic Categories Rev.5, 2018 (passenger motor vehicles have been included within the consumer goods category). 2016-2018 averages ↩
-
HMRC, UK trade in goods by business characteristics 2018 ↩
-
ONS, UK trade in services experimental data (non-seasonally adjusted). Category: ‘other business services.’ Services are categorised based on EBOPS 2010 basis. Figures relate to period 2018. ↩
-
ONS, UK trade in services experimental data (non-seasonally adjusted). Services are categorised based on EBOPS 2010 basis. Figures relate to period 2018. ↩
-
ONS, Goods by commodity: UK trade release (non-seasonally adjusted) is based on SITC codes using a mixture of level 2 and level 3 codes. Figures relate to period 2018. ↩
-
ONS (2018), UK total trade: all countries, non-seasonally adjusted (access date: 9 May 2019). ↩
-
ONS (2018), UK total trade: all countries, non-seasonally adjusted (access date: 9 May 2019). ↩
-
(BEIS 2019), Business population estimates (access date: 20th February 2020). ↩
-
UNCTAD Stat: Gross Domestic Product ↩
-
ONS (2019), UK total trade: all countries, non-seasonally adjusted ↩
-
JETRO, Japanese External Trade Organization, FDI stock (Based on International Investment Position, net) ↩
-
Competitiveness here is based on Revealed Comparative advantage (RCA) or, export specialisation. See Table 1 for further detail. ↩
-
Estimated duty savings are based on the difference between the MFN tariff level and the remaining tariff levels under the EU-Japan EPA in 2033. ↩
-
The proportion of male workers in sectors where employment falls relative to the baseline is above the general population of the workforce. ↩
-
Further background on free trade agreements can be found in the information note for the call for input on a bilateral free trade agreement between the UK and Japan (DIT, September 2019). ↩
-
UK-Japan Joint Statement: 10 January 2019. ↩
-
UK-Japan exchange of letters on mutual recognition. ↩
-
GDP Forecast (Constant Prices), IMF World Economic Outlook Database, April 2019. ↩
-
IMF World Economic Outlook Database, 2024 total population, April 2019. ↩
-
World Bank Development Indicators, current US dollars, 2017. Ranking excludes Macao and Hong Kong. ↩
-
Converted using Bank of England annual average spot exchange rates for 2017. ↩
-
Excluding Macao and Hong Kong. ↩
-
World Bank Development Indicators. ↩
-
Statistics Bureau of Japan: Statistical Handbook of Japan 2019, excludes businesses whose operational details are unknown, national government services, and local government services) ↩
-
Note: Categories are grouped by Japan Standard Industrial Classification ↩
-
Statistics Bureau of Japan 2016 Economic Census for Business Activity ↩
-
Statistics Bureau of Japan: Statistical Handbook of Japan 2019, excludes businesses whose operational details are unknown, national government services, and local government services) ↩
-
World Bank Ease of Doing Business Rankings, 2019. ↩
-
23 Sectors are an aggregation of the 57 GTAP Sectors. The normalized revealed comparative advantage uses a different sectoral aggregation from the Impact Assessment of the EU-Japan EPA on the UK. Normalised Revealed Comparative Advantage formula retrieved from: Yu R., Cai J., and Leung P. 2009. The Normalized Revealed Comparative Advantage Index, The Annals of Regional Science, 43(1): 267-282. ↩
-
ONS (2018), UK total trade: all countries, non-seasonally adjusted. ↩
-
ONS (2019), UK total trade: all countries, non-seasonally adjusted. ↩
-
Japanese Ministry of Finance, Trade Statistics of Japan, Values by Country. ↩
-
JETRO, Japanese External Trade Organization, FDI stock (Based on International Investment Position, net) ↩
-
ONS, Foreign direct investment (FDI) totals for inward and outward flows, positions and earnings: 2018 ↩
-
ONS (2019), UK total trade: all countries, non-seasonally adjusted ↩
-
United Nations, Classification by Broad Economic Categories Rev.5, 2018 (passenger motor vehicles have been included within the consumer goods category). ↩
-
OECD Trade in Value Added. The TiVA database only provides data up to 2015, with preliminary projections to 2016 for select indicators. ↩
-
HMRC regional trade statistics, 2018. Data on services not available. ↩
-
BEIS Business Population Estimates (BPE, 2018) ↩
-
HMRC, UK Trade in Goods by Business Characteristics 2018; estimates based on HMTC OTS and ONS IDBR data. ↩
-
Call for input on a bilateral free trade agreement between the UK and Japan (DIT, September 2019). ↩
-
Summary of responses to call for input on a bilateral free trade agreement between the UK and Japan is part of this document (DIT, May 2020). ↩
-
DIT, Public attitudes to trade tracker: wave 1, 2019 ↩
-
Simple average tariffs represent the mean unweighted average across all HS chapters. A trade weighted tariff accounts for patterns of trade. International Trade Centre MacMaps tariff data and HMRC trade data, 2018. ↩
-
Note that this analysis does not take into account of any trade agreements signed after 2017, such as CPTPP. ↩
-
Comparisons of the I-TIP data across countries may not be accurate due to reporting methods (e.g. not all measures in partner countries are notified by reporting countries). ↩
-
There is a possibility that some NTM types (TBT and SPS) may be double counted. Due to the fact that a single measure may have to be notified to various WTO committees [e.g. a measure on chemicals might be notified to both TBT and SPS committees], any aggregate of the different types of notified NTMs is likely to be marginally overestimated. ↩
-
ONS (2018), UK total trade: all countries, non-seasonally adjusted. ↩
-
Japanese Government, Ministry of Foreign Affairs (MOFA), Free Trade Agreement (FTA) and Economic Partnership Agreement (EPA). The figure includes the EU 28 member states, following the implementation of the EU-Japan EPA. ↩
-
IMF World Economic Outlook Database, April 2019. ↩
-
World Bank Development Indicators. ↩
-
The Global Trade Analysis Project (GTAP) database is a fully documented, publicly available, global database which contains complete bilateral trade information along with transport and protection linkages. This is combined with data on production, consumption and intermediate use of goods and services to provide a representation of the world economy. ↩
-
Joseph Francois: Professor of International Economics, University of Bern. Managing Director, World Trade Institute, Director, European Trade and Study Group. Director FP7 Pronto. Research Fellow, Centre for Economic Policy Research. ↩
-
Joseph Francois: Professor of International Economics, University of Bern. Managing Director, World Trade Institute, Director, European Trade and Study Group. Director FP7 Pronto. Research Fellow, Centre for Economic Policy Research. ↩
-
HMG. ‘EU Exit: Long-term economic analysis’ November 2018 (viewed January 2019) ↩
-
The EU-Canada Comprehensive Economic and Trade Agreement. ↩
-
A trade agreement between the EU and Colombia, Ecuador and Peru. ↩
-
The details of the modelled average FTA scenario is described in the Government’s publication on the long-term economic analysis of EU Exit. This represents a hypothetical FTA between the UK and EU in the long run. HMG (2018), “EU Exit: Long-term economic analysis”. ↩
-
This is the modelled no deal scenario in the HMG (2018). ↩
-
Modelling assumptions will be updated as negotiations progress and the content of the agreement becomes known. ↩
-
For a discussion and analysis of “Utilisation of Preferences, see Nilsson and Preillon (2018). DG Trade, Chief Economist Note, “EU Exports, Preferences Utilisation and Duty Savings by Member State, Sector and Partner Country.” ↩
-
Defined as scores of 1-3, 4-5, and 6-7 on the Design of Deep Trade Agreements Database (DESTA) respectively. ↩
-
This assumption is often known as the “actionability” assumption – the proportion of total barriers that could be actioned upon to reduce in a free trade agreement. For examples and discussion, see Ecorys (2009) or Ciuriak (2018). ↩
-
The primary limitation of this approach is that modern free trade agreements may be evolving faster than the collected data allows economic analysis to assess. This is particularly important for services trade. There is not yet enough data available to assess the trade enhancing effects of modern services agreements such as CETA. Subsequently the estimates used in this paper could underestimate the impacts of services provisions in a UK-Japan FTA. ↩
-
The estimates of the initial levels of non-tariff measures described in Annex B. ↩
-
Trade costs include tariff and non-tariff measures and regulatory restrictions to services. ↩
-
Note that service sectors do not attract tariffs. ↩
-
See Annex B for further detail of how initial NTM levels are estimated. ↩
-
Trade costs include tariff and non-tariff measures and regulatory restrictions to services. ↩
-
Modelling assumptions will be updated as negotiations progress and the content of the agreement is known. ↩
-
Values (in 2018 terms) are used to provide an illustrative pound impact. They do not account for changes in baseline or forecast GDP over 15 years. We do not currently have agreed forecasts for UK GDP over the next 15 years and the CGE model does not produce forecasted pound values. ↩
-
ONS Gross Domestic Product at market prices, seasonally adjusted. ↩
-
Note: the % increases in each of the components of GDP will not sum to the % increase in GDP as these are relative to their respective baselines and are therefore not estimates of the relative contribution of each component to the overall % increase in GDP. ↩
-
ONS (2018), UK total trade: all countries, non-seasonally adjusted. ↩
-
Note that £ values are provided to illustrate the potential magnitude of the deal in cash terms in 2018. These do not reflect the actual value of the FTA in long run (approximately 15 years). ↩
-
GVA is an alternative measure of economic output to GDP. At a sector level, it is the output of that sector minus the value of intermediates that have been used to produce the goods and services in that sector. At the national level, GVA is also the equivalent of the value of GDP plus government subsidies, minus taxes. ↩
-
External CGE modelling. ↩
-
ONS GVA output approach (2018 prices) ↩
-
ONS Trade in Goods, by country by commodities (imports and exports. ↩
-
SMMT, 2019 UK Automotive Trade Report ↩
-
ONS Trade in Goods, by country by commodities (imports and exports. ↩
-
ONS GVA output approach (2018 prices) ↩
-
ONS Trade in Goods, by country by commodities (imports and exports. ↩
-
Sources: Nicoletti et al (2003) http://www.oecd.org/dev/pgd/20354689.pdf, Helpman et al (2003) https://scholar.harvard.edu/files/melitz/files/exportsvsfdi_aer.pdf, Civic Consulting and the Ifo Institute (2017) https://trade.ec.europa.eu/doclib/html/155673.htm. ↩
-
The sector GVS share amounts are DIT calculations using ONS GVA output approach (2018 prices). ↩
-
See, for example: ‘Making Trade Work for All’ (OECD 2017) and ‘Making Trade an Engine of Growth for All’ (IMF/World Bank/WTO 2017) for an overview of the international evidence. ↩
-
To take account of these second-round effects, the impacts on each nation and region are impacted by a location quotient (explained in detail in Annex C). The location quotient-weighted approach amplifies positive and negative regional results, but for most regions the difference is small. To acknowledge the uncertainty around the apportionment approach, the maps in Chart 14 use the mid-point of the two methods. ↩
-
The modelling does not explicitly take account of any impacts arising from the Protocol on Ireland/Northern Ireland (to the Withdrawal Agreement). ↩
-
Other positive spill over effects may include increased foreign direct investment, higher remittances payments, reduction in compliance costs from harmonising to Japan and UK regulation standards. ↩
-
Other negative spill over effects may include the diversion of economic activity of firms from other countries to the UK and/or Japan (preference erosion), increased compliance costs to adjust to changes in regulations and customs arrangements in the UK and Japan. ↩
-
The direction of the impact depends on a variety of factors, including the extent to which FTA partners compete in each other’s markets with third countries. ↩
-
114 countries are included in the analysis. Countries are listed in alphabetical order, High refers to the countries with the greatest share of goods trade with the UK and Japan, with the highest value recorded for Palau, where 30% of goods trade in 2015-2017 was with the UK (~0%) and Japan (30%). Low refers to the 20 countries with the smallest share of goods trade with the UK and Japan, with the lowest value recorded for Tajikistan, where less than 1% of goods trade was with Japan or the UK. Analysis based on UN Comtrade (2015-2017). ↩
-
Annex D provides more detail on the methodology used to provide a preliminary assessment of the scale of the potential impacts of a UK-Japan FTA on UK businesses. ↩
-
In some instances, the exporting business may absorb the cost of the tariff, for example when there is a considerable domestic supply of a product, foreign firms may be forced to absorb tariff costs in order to remain competitive in the market or may not trade at all. ↩
-
We assume the EU-Japan EPA to be the baseline preferential tariff schedule for this analysis. ↩
-
Delivered Duty-Paid agreements are those in which exporters are contracted to pay for all potential costs, including tariffs and insurance risks, rather than these being paid by the buyer of a product. For an explanation, please see: https://www.incotermsexplained.com/the-incoterms-rules/the-eleven-rules-in-brief/delivered-duty-paid/ ↩
-
We assume the EU-Japan EPA to be the baseline preferential tariff schedule for this analysis. ↩
-
The magnitude of potential tariff savings for consumers importing final goods from Japan can be estimated by grouping goods into intermediate or final goods (converting Harmonised System trade data into Broad Economic Categories). ↩
-
In 2021 annual savings on final goods could be around £14 million. ↩
-
HMRC, UK Trade in Goods by Business Characteristics 2018; estimates based on HMTC OTS and ONS IDBR data. ↩
-
This includes “micro”-sized firms which are included in “small” firms in the data. ↩
-
The magnitude of potential tariff savings for consumers importing final goods from Japan can be estimated by grouping goods into intermediate or final goods (converting Harmonised System trade data into Broad Economic Categories). ↩
-
The figures presented in this analysis assumes full utilisation of the agreement, considers EPA tariff rates where no Ad Valorem Equivalent (AVE) rates are available to be zero, does not account for the potential long-term trade growth and the recent implementation of the EPA. ↩
-
The duty change shown here is likely to be an overestimate; as businesses take time to utilise preferences, a significant proportion of trade will continue paying MFN tariffs. It does not consider suspensions and/or inward processing. A small number of products in prepared foodstuffs were excluded due to AVEs not being available. As there are low trade flows in these products, we do not expect it to significantly affect the results. ↩
-
For example, the UK is rated in the top 10 most efficient labour market in the world in the World Economic Forum’s Global Competitiveness Report 2019. ↩
-
Employment is according to the ILO definition as specified by the relevant LFS indicator (ILODEFR). That is, a person is considered employed if they are 16 or over/16-64 and have been engaged for at least one hour within a 7-day reference period in any activity to produce goods or services. This also includes employed persons “not at work” i.e. those who did no work in the reference period due to temporary absence or working patterns. ↩
-
According to DIT Analysis of the ONS three-year pooled Annual Population Dataset (2015-2017). ↩
-
It is possible that non-response to this question in the Annual Population Survey affects the estimated proportion. ↩
-
The Industrial Strategy highlights the importance of harnessing cleaner growth and becoming a world leader in the development, manufacture and use of low carbon technologies, systems and services. ↩
-
The Clean Growth Strategy sets out the UK’s reaffirmed ambition to promote the ambitious economic and environmental policies to mitigate climate change and deliver clean, green growth. ↩
-
https://www.gov.uk/government/publications/bioeconomy-strategy-2018-to-2030 ↩
-
The 25 Year Environment Strategy sets out government action to help the natural world regain and retain good health, calling for a new approach to industry which highlights the importance of sustainable land use and resource efficiency. ↩
-
https://www.theccc.org.uk/tackling-climate-change/the-legal-landscape/the-climate-change-act/ ↩
-
The Committee on Climate Change: https://www.theccc.org.uk/tackling-climate-change/reducing-carbon-emissions/how-the-uk-is-progressing/ ↩
-
Annex 3 of HMG’s 25 Year Environment Plan sets out a non-exhaustive selection of international agreements that the UK is party to which seek to improve the international environment. ↩
-
Including the Kyoto Protocol (1997) and the Paris Agreement (2016). ↩
-
Call for input on a bilateral free trade agreement between the UK and Japan (DIT, 2019). https://www.gov.uk/government/consultations/trade-with-japan ↩
-
EPI 2018 EPI is used to illustrate relative performance, there are other international indices which may measure additional environmental performance metrics and give different scores. ↩
-
HM Government (2018), A Green Future: Our 25 Year Plan to Improve the Environment. ↩
-
OECD (2018), “Assessing the Effectiveness of Environmental Provisions in Regional Trade Agreements”. The OECD found a positive relationship between membership of regional trade agreements and improved environmental quality for two out of three pollutants treated as a proxy for environmental quality. However, the extent to which environmental provisions specifically contributed to the improvement could not be concluded with statistical certainty. ↩
-
The pollution haven hypothesis (PHH) predicts that trade liberalisation will lead to the relocation of pollution-intensive production to countries with lower environmental protections, where firms will face lower costs of compliance with environmental regulations. This could in theory encourage a ‘race to the bottom’ where governments lower environmental protections to give domestic firms a competitive advantage over foreign competitors. However, with harmonised environmental regulations FTAs can reward the most efficient and therefore low-cost producers, with the smallest environmental impacts. The evidence on the PHH is mixed, although newer more credible studies tend to find some support for it (see Broner, Bustos and Carbalho, 2012; Millimet and Roy, 2016; Martínez-Zarzoso, Vidovic and Voicu, 2016). ↩
-
These sectors do not map exactly on to the modelled sectors but are likely to account for the majority of emissions from the ‘Energy’, ‘Chemicals, rubber and plastics’ and ‘Manufactures’ sectors ↩
-
For example, see A. Cristea, et al., Trade and the greenhouse gas emissions from international freight transport, Journal of Environmental Economics and Management (2012). ↩
-
T. Smith, et al., “CO2 emissions from international shipping: Possible reduction targets and their associated pathways,” UMAS (2016). ↩
-
For more information on transport carbon emissions, see BEIS greenhouse gas reporting conversion factors (2018). The mode of transport used will be influenced by the type of good being exported, in particular whether it is perishable or part of a supply process that requires rapid delivery of intermediate products, and the proximity of the export destination to an airport, seaport or rail network. ↩
-
DEFRA (2019) “Clean Air Strategy”. https://assets.publishing.service.gov.uk/government/uploads/system/uploads/attachment_data/file/770715/clean-air-strategy-2019.pdf ↩
-
UK AIR: Air Information Resource. https://uk-air.defra.gov.uk/air-pollution/causes ↩
-
Table 301 in the Energy and environment: data tables. ↩
-
OECD (2018), “Assessing the Effectiveness of Environmental Provisions in Regional Trade Agreements”. The OECD found a positive relationship between membership of regional trade agreements and improved environmental quality for two out of three pollutants treated as a proxy for environmental quality. However, the extent to which environmental provisions specifically contributed to the improvement could not be concluded with statistical certainty. ↩
-
Cherniwchan et al. (2016) https://www.nber.org/papers/w22636 ↩
-
WWF, Living Planet Report 2018 ↩
-
Secretariat of the Convention on Biological Diversity (2015) Water and Biodiversity: Summary of the findings of (GBO4) and implications for action as they relate to water. ↩
-
Defra (2019) The Future Farming and Environment Evidence Compendium. ↩
-
ONS Nominal and real regional gross value added (balanced) by industry (2017) - agriculture and hunting industry. ↩
-
Excluding C129 – Abolition of Forced Labour Convention, 1969 and C111 – Discrimination (Employment and Occupation) Convention, 1958. ↩
-
The Trade Union and Labour Relations (Consolidation) Act 1992 for the UK and for Japan, Article 28 of the constitution of Japan. ↩
-
The Equality Act 2010 for the UK and the Equal Employment Opportunity Commission. ↩
-
Article 27 Paragraph 3 of the Constitution of Japan ↩
-
The Global Slavery Index, 2018. ↩
-
In 1995, 7% of trade agreements in force included labour provisions, rising to 29% by 2016. “Handbook on Assessment of Labour Provisions in Trade and Investment Arrangements”, ILO, 2017. ↩
-
Analysis by the International Labour Organisation (ILO, 2016) noted that “aggregate cross-country analysis does not indicate any impact of labour provisions on other labour market outcomes” (e.g. wages or working hours), but that there was a “possibility that labour provisions may still have an impact at the country-level.” ↩
-
Doumbia-Henry, C, & Gravel, E. (2006). Free trade agreements and labour rights: Recent developments. Int’l Lab. Rev., 145, 185. For example, Samaan & Lopez (2017) examined labour provisions in the 1999 Bilateral Textile Agreement between Cambodia and the US and found that combining obligations to comply with core labour standards with the incentive of higher exports led to a statistically significant reduction in the gender wage gap in the textiles sector. ↩
-
Summary of ILO research (2016), found in “Handbook on Assessment of Labour Provisions in Trade and Investment Arrangements”, ILO, 2017. ↩
-
Joseph Francois: Professor of International Economics, University of Bern. Managing Director, World Trade Institute, Director, European Trade and Study Group. Director FP7 Pronto. Research Fellow, Centre for Economic Policy Research. ↩
-
HM Government. ‘EU Exit: Long-term economic analysis’ November 2018 (viewed January 2019) ↩
-
For example, Egger et al. (2015) ‘Non-tariff measures, integration and the transatlantic economy’. ↩
-
HMG (2018), “EU Exit: Long-term economic analysis: Technical Reference Paper”. ↩
-
Regarding the Change in GDP figure below: A UK-Japan FTA under the WTO baseline is estimated to increase the UK’s long-run annual GDP by around 0.09% in the core scenario. In 2018, the GDP of the UK was around £2.12 trillion. In 2018 this percentage change in UK GDP would have been equivalent to £2 billion. ↩
-
EU Exit: Long-term economic analysis, HMG (2018). ↩
-
Bekkers, E., J. Francois, and H. Rojas-Romagosa (2018), “Melting Ice Caps and the Economic Impact of Opening the Northern Sea Route,” The Economic Journal, Volume 128, Issue 610, 1 May, Appendix available at pages 1095–1127. ↩
-
EU Exit: Long-term economic analysis, November 2018. ↩
-
http://trade.ec.europa.eu/doclib/press/index.cfm?id=1684 ↩
-
For example, language barriers, local regulations, safety standards and border checks are all non-tariff measures that would be expected to result in significantly different operational costs. These costs would also likely change according to the type of firm and in the country where the trade is taking place. ↩
-
This represents the equivalent tariff (as a % of the value of the good) that would restrict trade by the same effect as the non-tariff measure. For example, if a labelling requirement were to increase the cost of wine production by 3%, the impact of the labelling requirement would be estimated as equivalent to a 3% tariff. ↩
-
For further discussion of each approach see Chen & Novy (2012) or Bekkers, Francois & Rojas-Romogosa (2018) ↩
-
Gravity modelling is an econometric framework for estimating the determinants of international trade patterns. It is commonly referred to as the “workhorse model of international trade”, due to its ability to consistently explain patterns of international trade. For a discussion of the history and uses of gravity modelling, see Head & Mayer (2013). ↩
-
NUTS-1 regions of the UK are used. These include Northern Ireland, Scotland, Wales and nine English regions. Further information on the NUTS-1 classification can be found at ‘The establishment of a common classification of territorial units for statistics (NUTS)’, Eurostat 2018. ↩
-
See accompanying manual of the fifth revision of BEC. For the purposes of this analysis, goods that are allocated as “Capital Goods” are treated as “Intermediate”, as they are likely to be purchased by businesses. ↩
-
EU-Extra Imports by Tariff Regime. Trade that enters the UK under an “Unknown” import regime is excluded from the analysis. ↩
-
Such as under a tariff-rate quota with an in-quota tariff rate that is not zero. ↩
-
Read information about inward processing and outward processing. Goods not claiming some form of duty relief are recorded as “normal” trade in “Stat regime” in the EU database. This adjustment may slightly understate potential tariff reductions, as it assumes that processing trade receives 100% tariff relief, which is unlikely to be the case. ↩
-
Specifically imports into Japan from the United Kingdom. ↩
-
See accompanying manual of the fifth revision of BEC. ↩
-
For example, see, “Consumer benefits from EU trade liberalisation: How much did we save since the Uruguay Round?” Lucian Cernat, Daphne Gerard, Oscar Guinea and Lorenzo Isella - Chief Economist Note, DG Trade, Issue 1, February 2018. ↩
-
BEIS Business Population Estimates (BPE, 2018) ↩
-
HMRC Trade in Goods by Business Characteristics (2017) ↩
-
BEIS Business Population Estimates (BPE) combines a number of data sources on the business population (UK Business: Activity, Size and Location (ONS), Business Demography (ONS) and Small and Medium Enterprise Statistics (BEIS)) to generate holistic estimates for all active businesses, including sole-traders and unregistered businesses See Economic & Labour Market Review (Vol. 5, No. 4) (ONS). Please note in the turnover data, there is no data for Financial Services and Insurance sectors. ↩
-
Figures may not sum due to rounding. ↩
-
HMRC Regional trade statistics interactive analysis: first quarter 2019– proportional business count method. ↩
-
These characteristics are a subset of those protected under Equalities Act 2010. Other characteristics are not analysed due to a lack of data covering their demographics across sectors of the economy. ↩
-
The characteristic that has been studied in the greatest depth is gender. (UNCTAD, 2017) uses a method similar to the one used in this annex and (OECD, 2018) extends this approach to look at how women are affected as a result of impacts to global value chains. ↩
-
The sectoral data from the Labour Force Survey are based upon the SIC 2007 classification which are mapped to GTAP sectors. ↩
-
Employment is defined as set out in ILODEFR. For further information see Labour Force Survey User Guide: Details of LFS variables 2019. ↩
-
The data on the UK total workforce is sourced from the Annual Population survey, using a 3-year average (2015-17). ↩
-
For more information on transport carbon emissions, see BEIS greenhouse gas reporting conversion factors (2018). The mode of transport used will be influenced by the type of good being exported, in particular whether it is perishable or part of a supply process that requires rapid delivery of intermediate products, and the proximity of the export destination to an airport, seaport or rail network. ↩