UK House Price Index summary: September 2016
Published 15 November 2016

© Crown copyright 2016
This publication is licensed under the terms of the Open Government Licence v3.0 except where otherwise stated. To view this licence, visit nationalarchives.gov.uk/doc/open-government-licence/version/3 or write to the Information Policy Team, The National Archives, Kew, London TW9 4DU, or email: psi@nationalarchives.gov.uk.
Where we have identified any third party copyright information you will need to obtain permission from the copyright holders concerned.
This publication is available at https://www.gov.uk/government/statistics/uk-house-price-index-summary-september-2016/uk-house-price-index-summary-september-2016
1. Headline statistics
For September 2016:
- the average price of a property in the UK was £217,888
- the annual price change for a property in the UK was 7.7%
- the monthly price change for a property in the UK was 0.2%
- the monthly index figure for the UK was 114.3 (January 2015 = 100)
Estimates for the most recent months are provisional and are likely to be updated as more data is incorporated into the index. Read the revision policies.
2. Economic statement
Housing market indicators for September suggested a period of relative stability during the month. House prices grew by 7.7% in the year to September, unchanged from August. While there is some evidence of a slight recovery in demand on the month, both demand and supply indicators remained somewhat weaker than in 2015 and early 2016. There is evidence of regional variation with the Bank of England Agents’ Summary saying there was a marked slowdown in activity in London and surrounding areas, but activity has fared better elsewhere in the UK.
In terms of housing demand, the Royal Institution of Chartered Surveyors(RICS) market survey for September reported a modest increase in new buyer enquiries – the first increase since February. The volume of lending approvals for house purchases also rose by 3.2% in September compared to August. However, this follows 3 months of consecutive falls and the volume of lending approvals remains around the same level as early 2015.This is reflected in data for home sales in the UK which fell by 4.3% between August and September, with levels remaining lower than in 2014, 2015 and before the stamp duty changes in early 2016.
On the supply side, RICS also reported that new sales listings fell again in September compared to August, continuing the trend over the past 7 months. The latest ONS Output in the Construction Industry reported a 1.3% monthly fall in new-build housing output in August, although new-build housing output remains 8.0% higher compared with August 2015.
3. Price changes
3.1 Annual price change
Annual price change for UK by country over the past five years
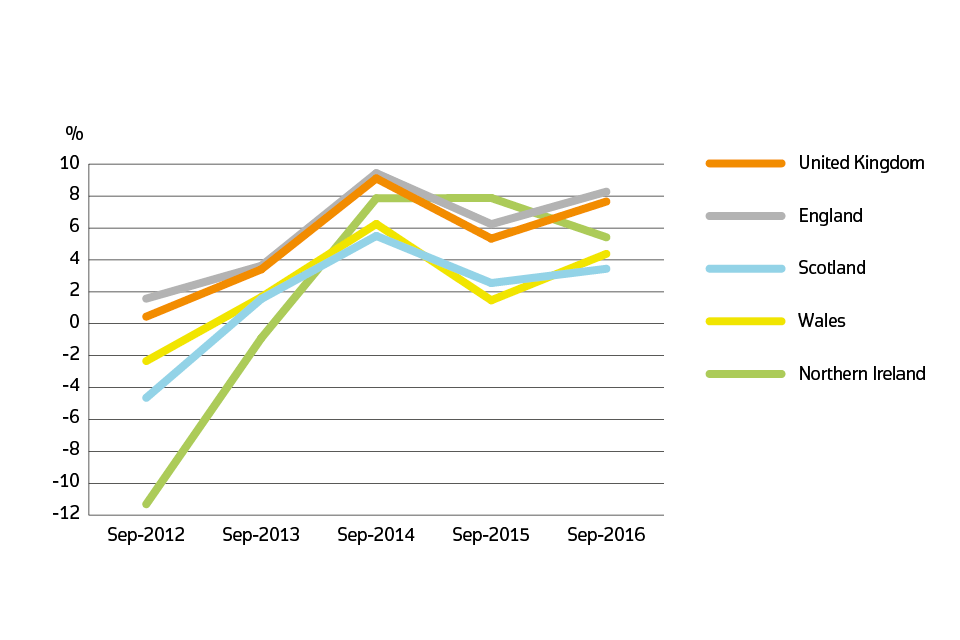
Annual price change for UK by country over the past five years
3.2 Average price by country and government office region
Price, monthly change and annual change by country and government office region
| Country and government office region | Price | Monthly change | Annual change |
|---|---|---|---|
| England | £234,250 | 0.2% | 8.3% |
| Northern Ireland (Quarter 3 - 2016) | £124,093 | 0.8% | 5.4% |
| Scotland | £143,006 | 0.2% | 3.4% |
| Wales | £146,388 | 0.2% | 4.4% |
| East Midlands | £175,441 | 0.7% | 8.2% |
| East of England | £277,248 | 0.7% | 12.1% |
| London | £487,649 | 1.4% | 10.9% |
| North East | £125,213 | -1.9% | 1.5% |
| North West | £150,845 | 0.2% | 5.7% |
| South East | £312,609 | -0.9% | 9.9% |
| South West | £241,262 | 0.6% | 7.5% |
| West Midlands Region | £180,551 | 0.3% | 7.7% |
| Yorkshire and The Humber | £151,399 | -0.4% | 4.7% |
Price changes by country and government office region
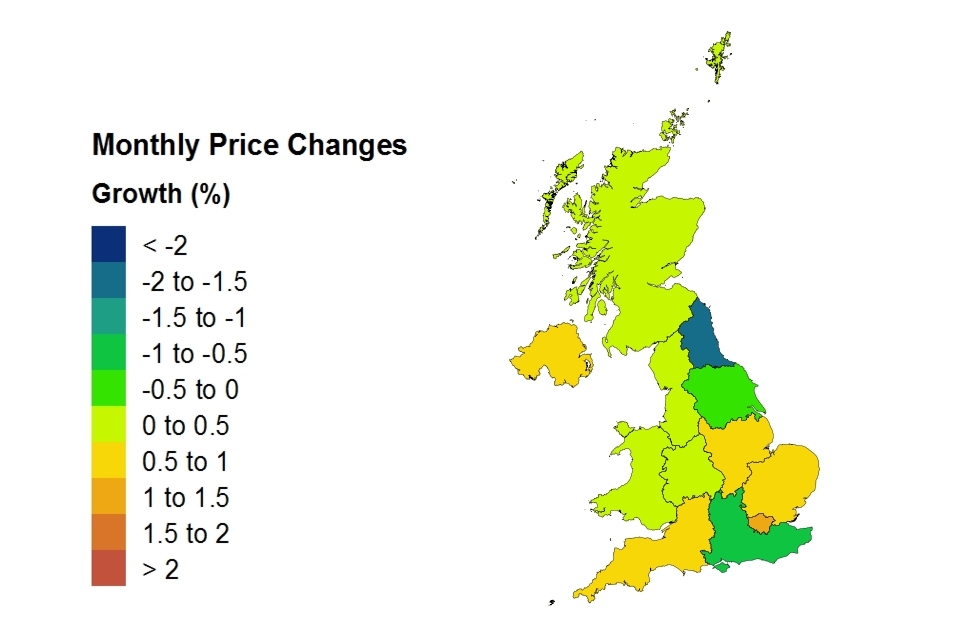
Price changes by country and government office region
3.3 Average price by property type
Average monthly price by property type
| Property type | September 2016 | September 2015 | Difference |
|---|---|---|---|
| Detached | £331,378 | £306,359 | 8.2% |
| Semi-detached | £204,364 | £189,114 | 8.1% |
| Terraced | £175,394 | £164,097 | 6.9% |
| Flat or maisonette | £196,653 | £182,638 | 7.7% |
| All | £217,888 | £202,389 | 7.7% |
4. Sales volumes
Due to a period of 2 to 8 weeks between completion and registration of sales, volume figures for the most recent two months are not yet complete, so they are not included in the report.
4.1 Sales volumes: July 2016
Number of sales by country
| Country | July 2016 | July 2015 | Difference |
|---|---|---|---|
| England | 66,870 | 93,040 | -28.1% |
| Northern Ireland (Quarter 3 - 2016) | 5,200 | 5,820 | -10.7% |
| Scotland | 9,108 | 10,021 | -9.1% |
| Wales | 3,525 | 4,603 | -23.4% |
4.2 Sales volumes for the UK over the past 5 years
Sales volumes for 2012 to 2016 by country: July 2016
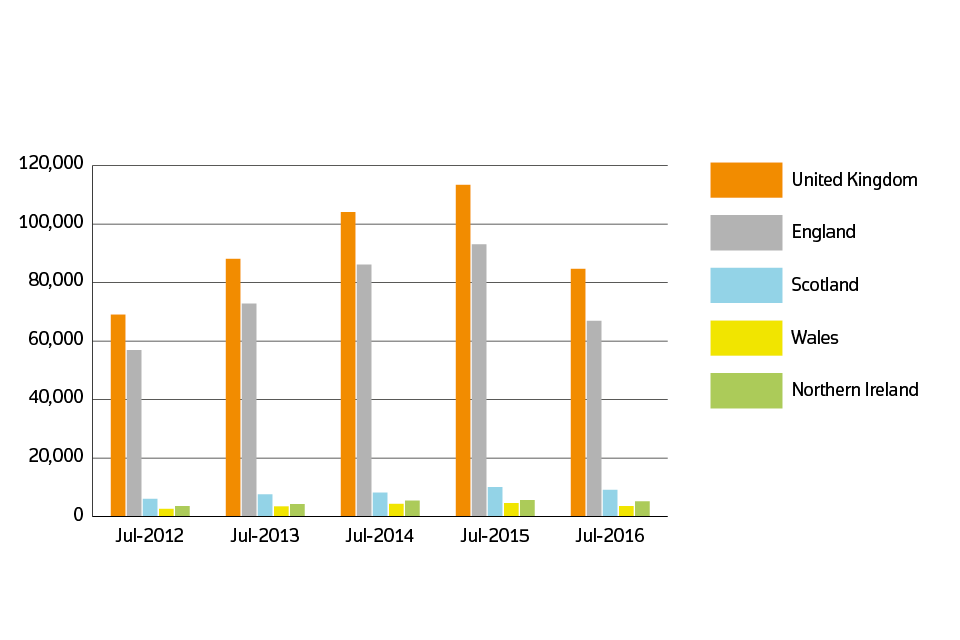
sales volumes for 2012 to 2016 by country: June 2016
5. Property status for UK
New build and existing resold property
| Property Status | Average price | Monthly change | Annual change |
|---|---|---|---|
| New build | £286,092 | 3.2% | 20.6% |
| Existing resold property | £213,385 | -0.1% | 6.7% |
Note: the first estimate for new build is based on a small sample which can cause volatility in this initial estimate.
6. Buyer status for Great Britain
First time buyer and former owner occupier
For Great Britain only, Northern Ireland data is not available for buyer status.
| Type of buyer | Average price | Monthly change | Annual change |
|---|---|---|---|
| First time buyer | £183,385 | 0.0% | 7.5% |
| Former owner occupier | £253,086 | 0.3% | 7.9% |
7. Funding status for Great Britain
Cash and mortgage
For Great Britain only, Northern Ireland data is not available for funding status.
| Funding status | Average price | Monthly change | Annual change |
|---|---|---|---|
| Cash | £206,922 | 0.1% | 6.9% |
| Mortgage | £227,602 | 0.2% | 8.1% |
8. About the UK House Price Index
The UK House Price Index (UK HPI) is calculated by the Office for National Statistics and Land & Property Services Northern Ireland. Find out about the methodology used to create the UK HPI.
Data for the UK House Price Index is provided by Land Registry, Registers of Scotland, Land & Property Services Northern Ireland and the Valuation Office Agency.
Find out more about the UK House Price Index.
9. Access the data
Download the data as CSV files or access it with our UK HPI tool.
10. Contact
Eileen Morrison, Data Services Team Leader, HM Land Registry
Email eileen.morrison@landregistry.gov.uk
Telephone 0300 006 5288
Aimee North, Head of Housing Market Indices, Office for National Statistics
Email aimee.north@ons.gov.uk
Telephone 01633 580090
Ciara Cunningham, Statistician for the Northern Ireland HPI
Email ciara.cunningham@finance-ni.gov.uk
Telephone 028 90 336035