UK House Price Index summary: June 2016
Published 16 August 2016

© Crown copyright 2016
This publication is licensed under the terms of the Open Government Licence v3.0 except where otherwise stated. To view this licence, visit nationalarchives.gov.uk/doc/open-government-licence/version/3 or write to the Information Policy Team, The National Archives, Kew, London TW9 4DU, or email: psi@nationalarchives.gov.uk.
Where we have identified any third party copyright information you will need to obtain permission from the copyright holders concerned.
This publication is available at https://www.gov.uk/government/statistics/uk-house-price-index-summary-june-2016/uk-house-price-index-summary-june-2016
1. Headline statistics
For June 2016:
- the average price of a property in the UK was £213,927
- the annual price change for a property in the UK was 8.7%
- the monthly price change for a property in the UK was 1.0%
- the monthly index figure for the UK was 112.2 (January 2015 = 100)
2. Economic statement
Continuing price pressures in the housing market reflect stronger demand relative to supply in the housing market. However, there are also indications that the housing market pressure softened recently, with falls in both demand and supply.
Several indicators point toward weakening housing demand in recent months. The volume of lending approvals for house purchases continued to fall in June 2016 - by 2.9% compared with the previous month. However, monthly approvals are still below levels seen in the 10 months prior to stamp duty changes in April 2016. Following a strong increase in sales in March, UK home sales fell by 55.4% in April 2016, recovering slightly in May and June 2016. Data from the Royal Institution of Chartered Surveyors (RICS) suggest that buyer demand fell for a third consecutive month, reaching its lowest level since mid-2008. New buyer enquiries declined across most parts of the UK, with the more southern parts of England seeing the sharpest contraction in demand.
There is an indication that housing market activity has softened in recent months. RICS reported that general supply, as measured by new instructions to sell, continued to fall in June 2016 in all areas except for Northern Ireland. In contrast, the latest ONS Output in the Construction Industry release indicated that new-build housing output increased by 1.8% in the previous three months (March to May 2016) compared with the same period a year earlier. These indications of weakening demand and supply are reflected in other institutions’ measures of general activity in the housing market. The Bank of England Agents Summary for Q2 2016 reported that housing market activity was more subdued in April and May following an increase in housing transactions in January to March, while RICS reported a third consecutive monthly fall in overall housing market activity in June 2016.
3. Price changes
3.1 Annual price change
Annual price change for UK by country over the past five years
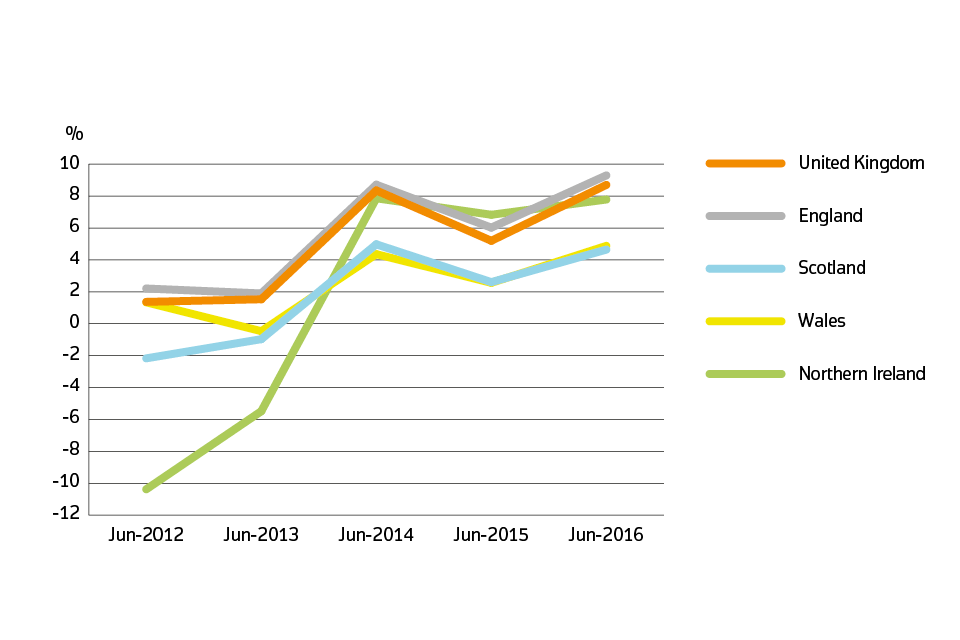
Annual price change for UK by country over the past five years
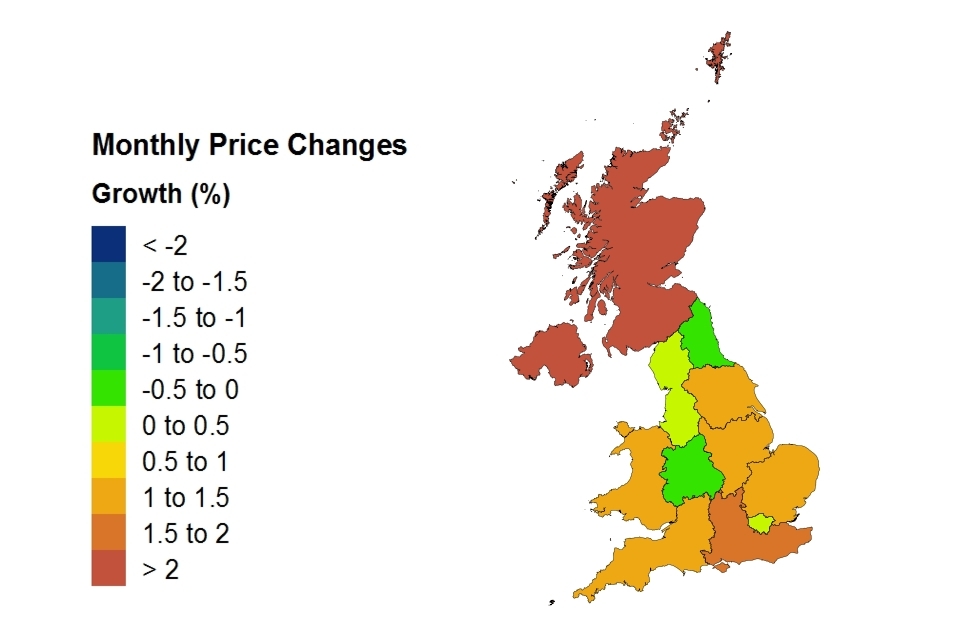
3.2 Average price by country and government office region
Price, monthly change and annual change by country and government office region
| Country and government office region | Price | Monthly change | Annual change |
|---|---|---|---|
| England | £229,383 | 0.8% | 9.3% |
| Northern Ireland (Quarter 2 - 2016) | £123,241 | 3.8% | 7.8% |
| Scotland | £143,282 | 2.7% | 4.6% |
| Wales | £145,238 | 1.2% | 4.9% |
| East Midlands | £171,462 | 1.3% | 7.9% |
| East of England | £270,029 | 1.3% | 14.3% |
| London | £472,204 | 0.2% | 12.6% |
| North East | £124,470 | -0.2% | 1.5% |
| North West | £148,320 | 0.4% | 6.6% |
| South East | £309,149 | 1.5% | 12.3% |
| South West | £234,987 | 1.0% | 8.0% |
| West Midlands Region | £174,998 | -0.2% | 6.4% |
| Yorkshire and The Humber | £149,706 | 1.2% | 5.5% |
Price changes by country and government office region
Annual price change for UK by country over the past five years
3.3 Average price by property type
Average monthly price by property type
| Property type | June 2016 | June 2015 | Difference |
|---|---|---|---|
| Detached | £318,945 | £295,273 | 8.0% |
| Semi-detached | £200,789 | £185,011 | 8.5% |
| Terraced | £174,495 | £160,538 | 8.7% |
| Flat or maisonette | £193,758 | £176,467 | 9.8% |
| All | £213,927 | £196,802 | 8.7% |
4. Sales volumes
Due to a period of 2 to 8 weeks between completion and registration of sales, volume figures for the most recent two months are not yet complete, so they are not included in the report.
4.1 Sales volumes: April 2016
Number of sales by country
| Country | April 2016 | April 2015 | Difference |
|---|---|---|---|
| England | 42,938 | 64,467 | -33.4% |
| Northern Ireland (Quarter 2 - 2016) | 4,075 | 5,200 | -21.6% |
| Scotland | 6,665 | 7,936 | -16.0% |
| Wales | 2,394 | 3,237 | -26.0% |
4.2 Sales volumes for the UK over the past 5 years
Sales volumes for 2012 to 2016 by country: April 2016
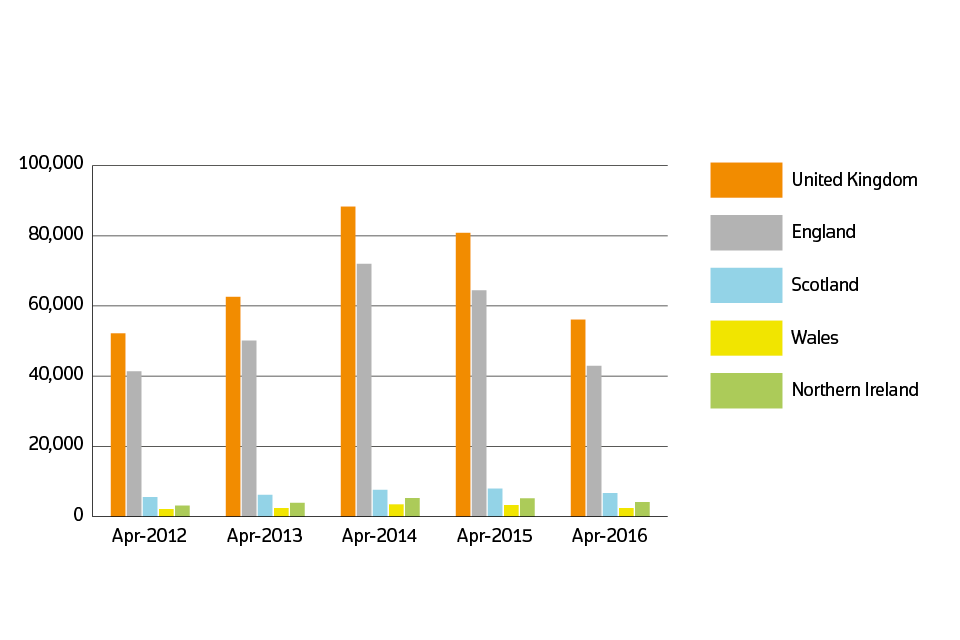
Sales volumes for 2012 to 2016 by country
5. Property status for UK
New build and existing resold property
| Property Status | Average price | Monthly change | Annual change |
|---|---|---|---|
| New build | £249,976 | -4.2% | 8.8% |
| Existing resold property | £211,992 | 1.7% | 9.0% |
Note: the first estimate for new build is based on a small sample which can cause volatility in this initial estimate. A three month moving average has been applied to the latest estimate for new builds to remove some of this volatility.
6. Buyer status for Great Britain
First time buyer and former owner occupier
For Great Britain only, Northern Ireland data is not available for buyer status.
| Type of buyer | Average price | Monthly change | Annual change |
|---|---|---|---|
| First time buyer | £180,677 | 0.7% | 8.6% |
| Former owner occupier | £247,736 | 1.2% | 8.8% |
7. Funding status for Great Britain
Cash and mortgage
For Great Britain only, Northern Ireland data is not available for funding status.
| Funding status | Average price | Monthly change | Annual change |
|---|---|---|---|
| Cash | £203,639 | 1.2% | 8.2% |
| Mortgage | £223,126 | 0.9% | 9.0% |
8. About the UK House Price Index
The UK House Price Index (UK HPI) is calculated by the Office for National Statistics and Land & Property Services Northern Ireland. Find out about the methodology used to create the UK HPI.
Data for the UK House Price Index is provided by Land Registry, Registers of Scotland, Land & Property Services Northern Ireland and the Valuation Office Agency.
Find out more about the UK House Price Index.
9. Access the data
Download the data as CSV files or access it with our UK HPI tool.
10. Contact
Eileen Morrison, Data Services Team Leader, HM Land Registry
Email eileen.morrison@landregistry.gov.uk
Telephone 0300 006 5288
Ian Boreham, Head of Housing Market Indices, Office for National Statistics
Email ian.boreham@ons.gov.uk
Telephone 01633 456228
Ciara Cunningham, Statistician for the Northern Ireland HPI
Email ciara.cunningham@finance-ni.gov.uk
Telephone 028 90 336035