UK House Price Index Scotland: August 2016
Published 18 October 2016
Applies to Scotland
1. Headline Statistics
In August 2016:
- the average price of a property in Scotland was £144,561
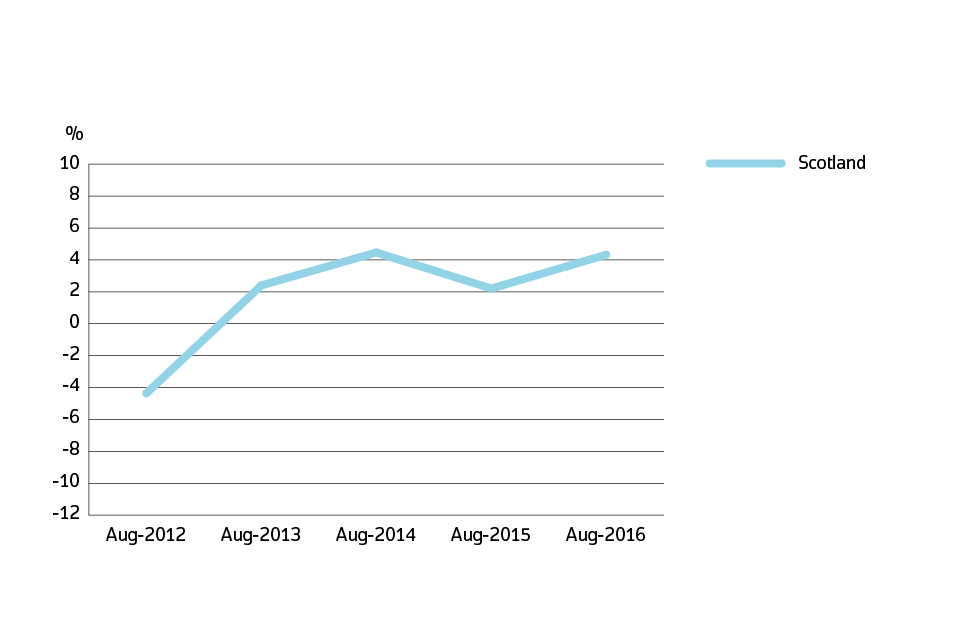
- the annual price change of a property in Scotland was 4.3%
- the monthly price change of a property in Scotland was 1.3%
- the index figure for Scotland was 107.1 (January 2015 = 100)
Estimates for the most recent months are provisional and are likely to be updated as more data is incorporated into the index. Read the revision policies.
2. Price change
2.1 Annual price change
Annual price change for Scotland over the past 5 years

Annual price change for Scotland over the past 5 years
Annual price change by local authority for Scotland
| Local authorities | August 2016 | August 2015 | Difference |
|---|---|---|---|
| Aberdeenshire | £202,192 | £199,447 | 1.4% |
| Angus | £142,599 | £142,143 | 0.3% |
| Argyll and Bute | £132,599 | £134,613 | -1.5% |
| City of Aberdeen | £175,922 | £192,744 | -8.7% |
| City of Dundee | £120,964 | £118,495 | 2.1% |
| City of Edinburgh | £226,454 | £223,091 | 1.5% |
| City of Glasgow | £122,004 | £115,264 | 5.8% |
| Clackmannanshire | £119,213 | £115,848 | 2.9% |
| Dumfries and Galloway | £118,168 | £122,134 | -3.2% |
| East Ayrshire | £95,002 | £91,750 | 3.5% |
| East Dunbartonshire | £196,692 | £180,632 | 8.9% |
| East Lothian | £201,765 | £197,680 | 2.1% |
| East Renfrewshire | £219,511 | £194,690 | 12.7% |
| Falkirk | £114,424 | £107,940 | 6.0% |
| Fife | £127,659 | £121,649 | 4.9% |
| Highland | £155,559 | £154,519 | 0.7% |
| Inverclyde | £108,877 | £99,062 | 9.9% |
| Midlothian | £157,097 | £152,644 | 2.9% |
| Moray | £143,096 | £136,725 | 4.7% |
| Na h-Eileanan Siar | £100,804 | £91,859 | 9.7% |
| North Ayrshire | £102,546 | £102,352 | 0.2% |
| North Lanarkshire | £103,586 | £94,372 | 9.8% |
| Orkney Islands | £129,982 | £117,953 | 10.2% |
| Perth and Kinross | £179,211 | £170,825 | 4.9% |
| Renfrewshire | £115,561 | £112,203 | 3.0% |
| Scottish Borders | £149,148 | £147,121 | 1.4% |
| Shetland Islands | £149,490 | £123,716 | 20.8% |
| South Ayrshire | £130,960 | £132,971 | -1.5% |
| South Lanarkshire | £119,953 | £112,371 | 6.7% |
| Stirling | £176,648 | £166,907 | 5.8% |
| West Dunbartonshire | £101,601 | £97,778 | 3.9% |
| West Lothian | £144,296 | £133,769 | 7.9% |
| Scotland | £144,561 | £138,564 | 4.3% |
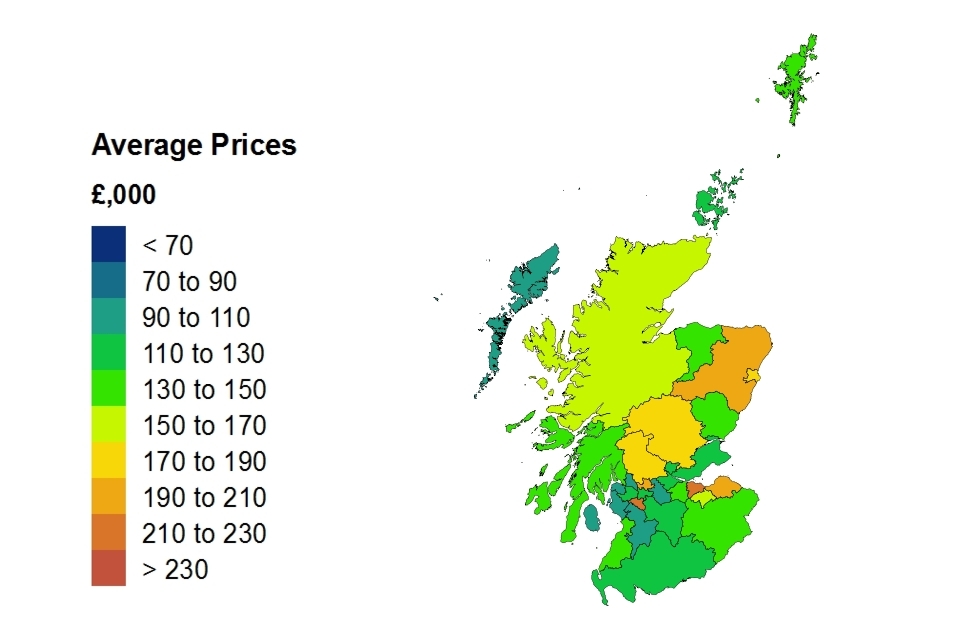
Average price by local authority for Scotland

Average price by local authority for Scotland
2.2 Average price change by property type
Average price change by property type for Scotland
| Property type | August 2016 | August 2015 | Difference |
|---|---|---|---|
| Detached | £252,567 | £239,337 | 5.5% |
| Semi-detached | £151,917 | £143,841 | 5.6% |
| Terraced | £120,310 | £115,536 | 4.1% |
| Flat or maisonette | £102,400 | £99,731 | 2.7% |
| All | £144,561 | £138,564 | 4.3% |
3. Sales volumes
Due to a period of 2 to 8 weeks between completion and registration of sales, volume figures for the most recent two months are not yet complete, so they are not included in the report.
3.1 Sales volumes by local authority
Sales volumes for Scotland by local authority: June 2016
| Local authorities | Sales volume |
|---|---|
| Aberdeenshire | 336 |
| Angus | 183 |
| Argyll and Bute | 141 |
| City of Aberdeen | 366 |
| City of Dundee | 254 |
| City of Edinburgh | 1,053 |
| City of Glasgow | 1,003 |
| Clackmannanshire | 65 |
| Dumfries and Galloway | 144 |
| East Ayrshire | 152 |
| East Dunbartonshire | 159 |
| East Lothian | 183 |
| East Renfrewshire | 155 |
| Falkirk | 305 |
| Fife | 515 |
| Highland | 371 |
| Inverclyde | 126 |
| Midlothian | 175 |
| Moray | 145 |
| Na h-Eileanan Siar | 33 |
| North Ayrshire | 209 |
| North Lanarkshire | 448 |
| Orkney Islands | 35 |
| Perth and Kinross | 250 |
| Renfrewshire | 344 |
| Scottish Borders | 150 |
| Shetland Islands | 23 |
| South Ayrshire | 166 |
| South Lanarkshire | 568 |
| Stirling | 166 |
| West Dunbartonshire | 121 |
| West Lothian | 276 |
| Scotland | 8,620 |
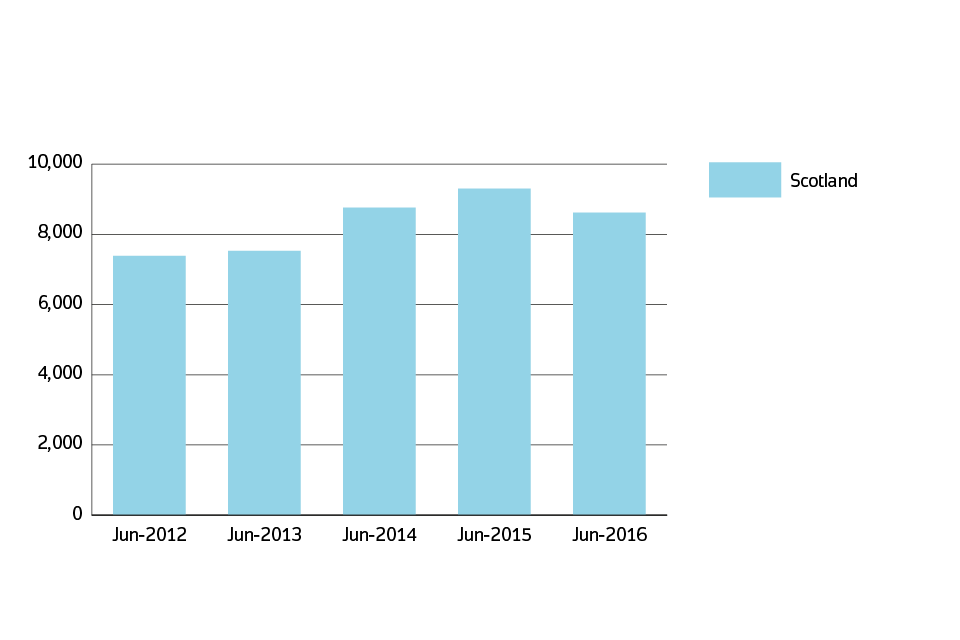
3.2 Sales volumes: June 2016
Sales volumes for Scotland over the past 5 years

Sales volumes for Scotland over the past 5 years
4. Building status
New build and existing resold property for Scotland
| Property status | Average price | Monthly change | Annual change |
|---|---|---|---|
| New build | £219,121 | 14.2% | 21.7% |
| Existing resold property | £141,605 | 0.7% | 3.5% |
Note: the first estimate for new build is based on a small sample which can cause volatility in this initial estimate.
5. Buyer status
First time buyer and former owner occupier for Scotland
| Type of buyer | Average price | Monthly change | Annual change |
|---|---|---|---|
| First time buyer | £116,383 | 0.2% | 3.9% |
| Former owner occupier | £173,859 | 2.3% | 4.7% |
6. Funding status
Cash and mortgage indicator for Scotland
| Funding status | Average price | Monthly change | Annual change |
|---|---|---|---|
| Cash | £132,784 | 0.8% | 3.8% |
| Mortgage | £150,020 | 1.6% | 4.6% |
7. About the UK House Price Index
The UK House Price Index (UK HPI) is calculated by the Office for National Statistics and Land & Property Services Northern Ireland. Find out about the methodology used to create the UK HPI.
Data for the UK House Price Index is provided by Land Registry, Registers of Scotland, Land & Property Services Northern Ireland and the Valuation Office Agency.
Find out more about the UK House Price Index.
8. Access the data
Download the data as CSV files or access it with our UK HPI tool.
9. Contact
Garreth Jones, Land & Property Data Team, Registers of Scotland
Email Garreth.Jones@ros.gov.uk
Telephone 0131 378 4991

